

Abstract
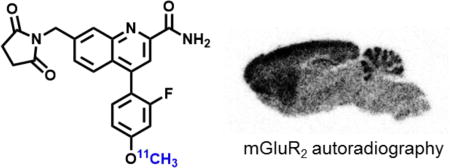
Metabotropic glutamate 2 receptors (mGlu2) are involved in the pathogenesis of several CNS disorders and neurodegenerative diseases. Pharmacological modulation of this target represents a potential disease-modifying approach for the treatment of substance abuse, depression, schizophrenia and dementias. While quantification of mGlu2 receptors in the living brain by positron emission tomography (PET) would help us better understand signaling pathways relevant to these conditions, few successful examples have been demonstrated to image mGlu2 in vivo and a suitable PET tracer is yet to be identified. Herein we report the design and synthesis of a radiolabeled negative allosteric modulator (NAM) for mGlu2 PET tracer development based on a quinoline 2-carboxamide scaffold. The most promising candidate, 7-((2,5-dioxopyrrolidin-1-yl)methyl)-4-(2-fluoro-4-[11C]methoxyphenyl) quinoline-2-carboxamide ([11C]QCA) was prepared in 13% radiochemical yield (non-decay corrected at the end of synthesis) with >99% radiochemical purity and >74 GBq/µmol (2 Ci/µmol) specific activity. While the tracer showed limited brain uptake (0.3 SUV), probably attributable to effects on PgP/Bcrp efflux pump, in vitro autoradiography studies demonstrated heterogeneous brain distribution and specific binding. Thus, [11C]QCA is a chemical probe that provides the basis for the development of a new generation mGlu2 PET tracers.
Keywords: positron emission tomography, metabotropic glutamate receptor 2, mGlu2, 11C, negative allosteric modulator
Graphical abstract
INTRODUCTION
Glutamate is the most abundant endogenous excitatory neurotransmitter and glutamate receptors (Glus) play a pivotal role in modulating a wide scope of neurological functions in the central nervous system (CNS).1–6 Glutamatergic signaling is primarily mediated via two distinct groups, namely ionotropic receptors (iGlus) and the G protein-coupled metabotropic receptors (mGlus). Based on different sequence homology, anatomical distribution and pharmacology, the mGlus are typically divided into three subcategories. Group I mGlus (mGlu1 and mGlu5), coupled to Gq/G11 proteins, mobilize calcium from intracellular stores upon activation and increase protein kinase C activity. Group II (mGlu2 and mGlu3) and Group III (mGlu4, mGlu6, mGlu7 and mGlu8) mGlus, coupled to Gi/o proteins, downregulate cAMP formation through inhibition of adenylyl cyclase.7 In particular, mGlu2 receptors negatively regulate endogenous glutamate release and consequently may be involved in the protection of neurons against excitotoxicity. The receptors are predominantly localized on presynaptic membranes although they are also found in peripheral regions of the synapse.8,9 Moderate-to-high expression of mGlu2 can be found in many brain regions, including the cerebral cortex, cerebellum, amygdala and hippocampus.10–14 It has been reported that mGlu2 is involved in the pathogenesis of numerous brain dysfunctions, including psychiatric disorders and neurodegenerative diseases.7,15–19 Therefore pharmacological modulation of mGlu2 represents a promising therapeutic approach for the treatment of several CNS diseases,20 including drug dependence,21–23 chronic pain,24 anxiety,17 depression,25,26 schizophrenia,27 Parkinson’s disease28,29 and Alzheimer’s disease.30 Initial drug discovery efforts focused on non-selective mGlu2/3 agonists and antagonists that bind to the mGlu orthosteric binding site (evolutionarily conserved glutamate binding site);31 however, in recent years there has been a shift towards allosteric modulation strategies (consisting of positive and negative allosteric modulators; abbreviated as PAM and NAM, respectively) that offer the potential for improved selectivity for mGlu2 or mGlu3.32,33 While a wide range of highly selective mGlu2 PAMs have been discovered and recently reviewed,33,34 the development of selective mGlu2 NAMs has remained in its nascent stage with only one report based on a dihydroquinoline 2-carboxamide scaffold in the primary literature.35
Positron emission tomography (PET) is a non-invasive imaging technology that is capable of quantifying biochemical processes in vivo,36–39 which would enable investigations of mGlu2 based glutamatergic signaling under normal and disease conditions, and assessment of distribution and testing target engagement and dose occupancy of mGlu2 drug candidates for clinical trials. Unlike several mGlu1 or mGlu5-targeting PET radiotracers in human use,40–45 there is an unmet need for probing mGlu2 in clinical research and drug development towards this important receptor subtype in the glutamatergic pathway. As shown in Figure 1, there are continuous research efforts in the development of mGlu2 PET tracers,40–43 including [11C]CMGDE (1),46,47 [11C]JNJ-42491293 (2),48,49 [18F]FE-JNJ42491293 (3),50 [11C]CMDC (4)51 and two tracers (18F-compound 5 and 11C-compound 6) in the patent literature.52,53 Among these studies [11C]CMGDE (1), the first mGlu2 radiotracer based on a prodrug of an antagonist LY341495, provided a foundation for the further development of a specific mGlu2 tracer.47 On the other hand [11C]CMDC (4), a derivative of JNJ-40068782,54 was not further pursued due to limited brain penetration (peak brain uptake ca. 0.6 SUV).51 Preliminary evaluation in PET imaging studies for compounds 3, 5, 6 are not yet disclosed for the development of mGlu2 tracers.52,53 Only two PET tracers, namely [11C]JNJ-42491293 (2) and a 11C-compound from Merck, have been advanced to first-in-human studies. [11C]JNJ-42491293 (2) was discontinued for mGlu2 imaging due to unexpected off-target binding in vivo during clinical trials55,56 and only limited preliminary data on the Merck compound (no structural information) were reported in abstracts.57,58 These mGlu2 imaging efforts combined with pharmaceutical development and the potential of mGlu2-modulating pharmacotherapy provide a strong impetus to advance PET tracer development for this target.
Figure 1.

PET tracers targeting mGlu2. While the majority of compounds in this figure have no selectivity data available in the primary literature, compound 2 showed mGlu2 selectivity greater than 350 fold over the other mGlu receptors.49
Herein we describe the synthesis of a small array of potent and selective mGlu2 NAMs that are amenable for radiolabeling and their preliminary evaluation in rodents by PET. In vitro autoradiography studies confirm the specific binding of these new NAMs bearing a quinoline 2-carboxamide moiety, which provides an excellent starting point for future mGlu2 PET tracer design.
RESULTS AND DISCUSSION
Chemistry
We designed a focused library of small molecule based on a series of NAMs disclosed in the patent literature,59 with the goal to develop a selective mGlu2 PET tracer amenable to radiolabeling with either 11C or 18F. In particular, the succinimidyl compound 16 was selected in our proof-of-concept studies because of reported low EC50 value (8 nM), reasonable cLogP value (2.95) and amenability for 11C-labeling from its corresponding phenolic precursor. Thus a set of quinolone 2-carboxamides and their labeling precursors were synthesized according to our synthetic strategy (see detailed retrosynthetic analysis in Scheme S1 of Supporting Information, SI). As summarized in Scheme 1, oxidation of 7-methylquinoline (7) with mCPBA followed by cyanide addition provided quinoline-2-carbonitrile 8 in 74% yield over two steps, which was converted to chloroquinoline 9 after mCPBA oxidation and POCl3 chlorination (60% yield). Site-specific bromination at the benzyl position of chloroquinoline 9 followed by succinimide substitution gave key intermediate 11 in 80% yield. Several parallel syntheses were carried out to introduce aryl groups at the ipso position of the chloride via palladium catalyzed Suzuki cross-coupling reactions. The coupling reaction with (2-fluoro-4-methoxyphenyl)boronic acid gave quinoline nitrile 12, which was hydrolyzed in basic H2O2 solution to afford the final standard 7-((2,5-dioxopyrrolidin-1-yl)methyl)-4-(2-fluoro-4-methoxyphenyl)quinoline-2-carboxamide (QCA; 16) in 55% yield over 2 steps. The cross coupling procedure was also applied to obtain phenol 17 (51% yield), fluoroethyl (FEPAD (18), 60% yield) and fluoropropyl derivatives (FPPAD (19), 53% yield). In brief, the synthesis of QCA (16), its precursor 17 and fluorinated derivatives (18–19) were achieved in eight to nine steps with overall yields of 6% - 10%.
Scheme 1.

Synthesis of quinoline 2-carboxamide analogs. (i) mCPBA, DCM, 1h; (ii) TMSCN, dimethylcarbamic chloride, DCM, 12 h, 74% for two steps; (iii) mCPBA, DCM, 40°C, 4 h; (iv) POCl3, DMF, CHCl3, 70°C, 6 h, 64% yield for two steps; (v) NBS, Benzoyl peroxide, CCl4, 85°C, 4 h, 60% yield; (vi) succinimide, Cs2CO3, DMF, 30 min, 80% yield; (vii) arylboronic acid, Pd(PPh3)4, Na2CO3, 1,4-dioxane, H2O, 100°C; (viii) Cs2CO3, DMF, 12 h, IC2H4F for 14, 45% yield over 2 steps from 11; IC3H6F for 15, 53% yield over 2 steps from 11; (ix) sodium percarbonate, 55% yield for QCA (16) over 2 steps from 11, 51% yield for precursor 17 over 2 steps from 11, 60% yield for FEQCA (18), and 53% yield for FPQCA (19).
Pharmacology and physicochemical properties
QCA and its two fluorinated derivatives (FEQCA and FPQCA) were subsequently screened for their in vitro activity towards mGlu2 and mGlu3, and the results are shown in Figure 2. A thallium flux assay in human embryonic kidney 293 (HEK) cells expressing heteromeric G-protein coupled inwardly rectifying potassium (GIRK) channels60 and human mGlu2 or mGlu3, was utilized to determine potency, efficacy and selectivity. The concentration-response relationship that antagonizes the effect of an EC80 concentration of glutamate was determined for each candidate. Potency is expressed as the IC50 for inhibition of the glutamate EC80 response. All three candidates showed NAM activity (IC50 values 45 ± 5 nM for QCA, 130 ± 10 nM for FEQCA, and 1080 ± 1300 nM for FPQCA) at human mGlu2 and excellent selectivity for mGlu2 over mGlu3. We utilized MNI-137, a mGlu2/3 NAM, as a positive control in our GIRK assay,61 and found no evidence of mGlu3 potencies up to the highest concentration of 30 µM. In addition, QCA was inactive towards other mGlu receptors at the test concentration of 30 µM, and showed no significant interaction with major CNS targets, which was conducted via GPCRome assays62 developed by the NIH PDSP program. (see excel data sheet in the associate content).
Figure 2.

In vitro evaluation of the potencies of QCA, FEQCA, FPQCA, and the control mGlu2/3 NAM MNI-137 in mGlu2 GIRK (A) or mGlu3 GIRK (B) functional assays.
We next evaluated whether QCA inhibits mGlu2 by a competitive or noncompetitive mechanism of action in functional studies by performing a Schild analysis.63 For these studies, the concentration-response relationships of glutamate-induced increases in thallium flux were evaluated for both mGlu2 and mGlu3 in the absence or presence (30 µM, 10 µM, 3333 nM, 1111 nM, 370 nM, 123 nM, or 41 nM) of QCA (Figure 3). QCA dose-dependently right-shifted the concentration-response of glutamate toward mGlu2 (Figure 3A) and decreased the maximal glutamate response, consistent with a noncompetitive mode of action. Alternatively, consistent with the previous in vitro studies (Figure 2B), QCA had no effect on either the glutamate potency or glutamate maximal response toward mGlu3 (Figure 3B), which also serves as an additional control demonstrating the mGlu2 selectivity of QCA.
Figure 3.

QCA noncompetitively right-shifts the glutamate concentration-response for mGlu2 and decreases the maximal glutamate response (A) but has no effect on the glutamate concentration-response for mGlu3 (B).
Lipophilicity of candidate compounds can be used as a predictive parameter for assessing blood-brain barrier permeability, with preferred range of 1.0–3.5.64–66 The cLogP values of compounds QCA (16), FEQCA (18) and FPQCA (19) were predicted to be 2.95, 3.44 and 3.69, respectively, using Pallas 3.0 prediction software (Table 1). Using liquid-liquid partition between n-octanol and water (“shake flask method”),67 the LogP values for QCA, FEQCA, and FPQCA were 1.27 ± 0.29, 1.75 ± 0.14 and 1.99 ± 0.12, respectively. Since in vitro assessments of pH stability, plasma and microsomal stability are important to the initial selection of candidate compounds,68 we carried out preliminary experiments to determine these parameters. We first evaluated the stability of the compounds under physiological conditions (pH = 5.0–9.4). All three compounds showed excellent stability at pH 5 and diminished stability at pH 7.4 and 9.4 at 37°C, which may be attributed to hydrolysis of succinimidyl group at higher pH. In addition, QCA and its fluorinated derivatives showed reasonable plasma and microsomal stability. Based on the functional assay results (cf. Figs. 2 & 3) and physicochemical properties (cf. Table 1), QCA (16) exhibited the lowest EC50 value among all derivatives and reasonable lipophilicity and plasma/microsomal stability, which warrants further radiolabeling and subsequent evaluation by in vivo PET imaging and ex vivo biodistribution studies.
Table 1.
Physicochemical properties of QCA (16), FEQCA (18) and FPQCA (19).
| Entry | lipophilicitya | pH stabilityb | plasma stabilityc |
microsomal stabilityd |
|||
|---|---|---|---|---|---|---|---|
|
|
|
||||||
| cLogP | LogP | 5.0 | 7.4 | 9.4 | |||
| 16 | 2.95 | 1.27 | 97.9% | 50.9% | 46.7% | 22.5% | 64.4% |
| 18 | 3.44 | 1.75 | 98.5% | 53.6% | 59.0% | 46.7% | 70.1% |
| 19 | 3.69 | 1.99 | 91.5% | 72.5% | 76.3% | 87.5% | 64.6% |
lipophilicity is calculated and measured by Pallas 3.0 software and the shake flask method, respectively.
percent (average, n ≥ 3) remaining of the parent molecule after incubation at 37 °C for 60 min.
diltiazem and
verapamil as positive controls, respectively.
Radiochemistry
As shown in Scheme 2, there are three possible labeling strategies for QCA (16), namely (1) 11C-cyanation followed by H2O2 hydrolysis from 2-chloroquinoline precursor; (2) 11C-carbonylation via [11C]CO followed by aminolysis from 2-chloroquinoline precursor and (3) 11C-methylation from the the phenolic precursor 17. Although the first two approaches may entail a general and unified strategy for the formation of 11C-carbonyl labeled quinoline carboxamides, as proof of concept, we chose the most convenient phenolic site for QCA labeling. The radiosynthesis of [11C]QCA was performed by the reaction of the phenolic precursor 17 (0.5 mg) with [11C]CH3I in the presence of NaOH (1.25 µmol) in DMF (300 µL). The reaction was carried out at 80 °C for 5 min, followed by purification using semi-preparative HPLC. Specifically, [11C]QCA was obtained from the reaction between its phenolic precursor and [11C]CH3I. The radiochemical yield was 13 ± 4% non-decay corrected (n = 3), calculated from starting [11C]CO2. The [11C]QCA was then reformulated in a saline solution containing 100 µL of 25% ascorbic acid in sterile water and 100 µL of 20% Tween® 80 in ethanol at the end of synthesis (see details in Methods). The radiochemical and chemical purity were greater than 99% and specific activity was greater than 74 GBq/µmol (2 Ci/µmol). The overall synthesis time was ca. 30 min and no radiolysis was observed up to 90 min.
Scheme 2.

Radiosynthesis of [11C]QCA (A) potential labeling methods; (B) 11CH3I labeling method.
Whole body biodistribution studies in mice
The uptake, distribution and clearance of [11C]QCA ([11C]16) were studied in mice at five time points (1, 5, 15, 30 and 60 min) post tracer injection. The results are expressed as the percentage of the injected dose per gram of wet tissue (%ID/g) in Figure 4 and Table S1 (SI) and standardized uptake value (SUV) in Figure S1 and Table S2 (SI). High uptake (>3% ID/g) was observed in the heart, lungs, liver, pancreas, kidneys and small intestine at 1 min post injection of [11C]QCA. After the initial phase the radioactivity levels in most tissues decreased rapidly, while the signals in the liver and small intestine continually increased until 30 min and then decreased slowly. The radioactivity was efficiently cleared from blood (1 min/60 min ratio of 2.4) and high radioactivity in the liver, kidneys and small intestine indicated urinary and hepatobiliary excretion, as well as a possible intestinal reuptake pathway. The distribution of [11C]QCA in the peripheral organs was similar to prior reports with other compounds,51,56,69,70 in which rapid clearance of radioactivity from heart, lungs, spleen and muscle was observed. Limited brain uptake (peak value 0.42% ID/g at 1 min post injection) was observed, and thus the regional brain distribution was further studied by in vitro autoradiography.
Figure 4.

Ex vivo biodistribution in mice at five different time points (1, 5, 15, 30 and 60 min) post [11C]QCA injection. Data are expressed as %ID/g.
In vitro Autoradiography
The binding specificity of [11C]QCA to mGlu2 was confirmed by in vitro autoradiography. Representative in vitro autograms of [11C]QCA on sagittal sections of rat brains are shown in Figure 5A. In the baseline study, the distribution of bound radioactivity was heterogeneous with signal levels from high to low in the order of cerebral cortex, striatum, hippocampus, cerebellum and pons/medulla (Figure 5B). These autographic results are in agreement with both the previously published distribution of mGlu2 in rat brain,10,12 and with other autoradiography studies with the mGlu2 radioligands [11C]CMDC,51 [3H]JNJ-40068782,54 [3H]LY34149571 and [3H]LY459477.14 As shown in Figure 5C, quantitative analysis of radioactivity binding in the mGlu2-rich regions (cerebral cortex, striatum, hippocampus and cerebellum) with unlabeled QCA (1 µM) and a NAM MNI-13761 (1 µM) showed ca. 50–60% reduced binding compared with that of baseline. We also observed marginal reductions (ca. 10–20%) of radioactivity binding when a mGlu2 PAM LY48737972 was used for blocking study, which may indicate a possible shared, yet at a low level, binding site between positive and negative allosteric modulators.73,74 These results indicate that [11C]QCA has a moderate-to-high level of in vitro specific binding to mGlu2 and the binding mechanism is consistent with that of a negative allosteric modulator.
Figure 5.

In vitro autoradiography of [11C]QCA binding in rat brain sections. (A) Brain sections were treated with [11C]QCA in the absence (baseline) or presence of QCA, MNI-137, LY-487379 (1 µM each). Cer, cerebellum; Hip, hippocampus; Cx, cortex; Str, striatum. (B) The radioactivity distribution was quantified in regional rat brain. The data are expressed as radioactivity per mm2 (n = 4). (C) Blocking studies. The data are normalized to % of radioactivity vs control (n = 4).
PET imaging studies in normal rat brain
Dynamic PET acquisitions were carried out with [11C]QCA in Sprague-Dawley rats for 60 min. Representative PET images (summed 0–60 min) in whole brain and time-activity curves are shown in Figure 6. The tracer [11C]QCA showed limited brain uptake (ca. 0.3 SUV whole brain) in rat and no obvious washout (ratio of SUV5 min/SUV90 min = 1.1). Pretreatment with unlabeled QCA (1 mg/kg) failed to show significant reduction of brain uptake, likely attributed to low brain permeability and possible in vivo non-specific binding (Figure 6C). We next carried out radiometabolite analysis and PET imaging in PgP/Bcrp knockout mice to investigate possible reasons of limited CNS penetration.
Figure 6.

PET/MRI fused images of [11C]QCA in rat brain: (A) baseline and (B) self-blocking with QCA (1 mg/kg). (C) Time-activity curves in whole brain under baseline and QCA self-blocking.
Radiometabolite analysis
To evaluate the in vivo stability of [11C]QCA, radiometabolites in the plasma and brain homogenate of Sprague-Dawley rats were evaluated post-tracer injection. The percentages of unchanged [11C]QCA and the corresponding radiometabolites, as determined by radio-HPLC, are shown in Figure 7. The fraction corresponding to unchanged [11C]QCA in plasma was 93% at 5 min, 88% at 20 min and 79% at 60 min, respectively, with only one other more polar metabolite observed (Top three possible sites for the metabolism are predicted by SMARTCyp75 and the results are listed as Table S3 in the supporting information). Analysis of rat brain homogenates in the same time interval showed unchanged [11C]QCA was 78%, 41% and 34%, respectively, with the same radiometabolite as found in plasma. These results indicate that the resulting polar radiometabolite may be brain penetrant.
Figure 7.

Percentages of unchanged [11C]QCA in rat brain tissue and plasma (n = 3) at 5, 20 and 60 min post injection.
PET imaging studies in PgP/Bcrp knockout mice
Based on the results of in vitro autoradiography and in vivo PET studies on rat brain, we speculated that insufficient brain permeability of [11C]QCA might be induced by ATP-binding cassette efflux transporters located at the blood-brain barrier,66,76–79 particularly, P-glycoprotein (PgP, ABCB1) and breast cancer resistance protein (Bcrp, ABCG2). To test this hypothesis, we carried out PET imaging studies of [11C]QCA on wild-type and PgP/Bcrp knockout (ABCB1a/1b−/−ABCG2−/−) mice, and compared pharmacokinetic profiles, particularly brain uptake and clearance.
As shown in Figure 8, peak brain uptake in whole brain was ca. 0.8 SUV in PgP/Bcrp knockout mice, indicating a significant difference compared with that (ca. 0.3 SUV) of the wild-type mice. Whole brain uptake increased 130% in PgP/Bcrp knockout mice compared with that of wild-type mice (calculated based on area under curve). Therefore these results indicated that [11C]QCA had intensive interactions with brain efflux pumps on the murine blood-brain barrier and is likely a PgP/Bcrp substrate in rodents.
Figure 8.

PET/MRI fused images in the whole brain of (A) wild-type and (B) Pgp/Bcrp knockout mouse. (C) Time-activity curves of whole brain in wildtype and Pgp/Bcrp knockout mouse after [11C]QCA injection.
CONCLUSION
We have efficiently synthesized a focused library of NAMs targeting mGlu2, and radiolabeled the most promising ligand, namely [11C]QCA in good radiochemical yield, high radiochemical purity and high specific activity. The pharmacokinetic profile (ex vivo distribution, uptake and clearance), in vitro autoradiography, brain penetration, efflux pump and metabolism studies were evaluated to determine the suitability of [11C]QCA as a mGlu2 tracer. While [11C]QCA is not likely pursued for in vivo mapping of mGlu2 due to limited brain permeability, in vitro specific binding studies by autoradiography showed promise as a new chemotype for mGlu2 tracer development. Further SAR studies of succinimidyl and/or quinoline carboxamide functionality are necessary to test PgP/Bcrp efflux liability and to facilitate next generation tracer design with improved brain permeability. In-depth pharmacology evaluation is equally important to validate in vivo specificity using mGlu2 knockout mice and/or mGlu2-specific NAMs. Radiotracer’s binding will also be evaluated under different agonist concentrations to characterize and select NAM- or PAM-based tracer for future clinical translation.”
METHODS
Materials and Methods
General Consideration
All the chemicals employed in the syntheses were purchased from commercial vendors and used without further purification. Thin-layer chromatography (TLC) was conducted with 0.25 mm silica gel plates (60F254) and visualized by exposure to UV light (254 nm) or stained with potassium permanganate. Flash column chromatography was performed using silica gel (particle size 0.040–0.063 mm). H-Nuclear magnetic resonance (NMR) spectra were obtained on a 300 MHz on Bruker spectrometers and 13C NMR spectra were obtained at 75 MHz. Chemical shifts (δ) are reported in ppm and coupling constants are reported in Hertz. The multiplicities are abbreviated as follows: s = singlet, d = doublet, t = triplet, q = quartet, quint = quintet, sext = sextet, sept = setpet, m = multiplet, br = broad signal, dd = doublet of doublets. For LC-MS/MS measurements, the ionization method is ESI using Agilent 6430 Triple Quad LC/MS. Lipophilicity was calculated by Pallas 3.4 ADME prediction software (CompDrug International, Inc., USA). The animal experiments were approved by the Institutional Animal Care and Use Committee of Massachusetts General Hospital or the Animal Ethics Committee at the National Institute of Radiological Sciences. DdY mice (male; 7 weeks, 34–36 g), Pgp/Bcrp knockout (Abcb1a/1b−/−Abcg2−/−; male; 17–18 weeks old; 31–33 g), wild-type (male; 17–18 weeks old; 30–32 g) FAB mice and Sprague-Dawley rats (male; 7 weeks; 210–230 g) were kept on a 12 h light/12 h dark cycle and were allowed food and water ad libitum.
Chemistry
7-methylquinoline-2-carbonitrile (8)
7-methylquinoline (10 g, 57.9 mmol) was dissolved in dichloromethane (200 mL) in a round bottom flask with a stir bar. 3-Chloroperoxybenzoic acid (14.4 g, 75%, 75.33 mmol) was added in portions with ice bath. The mixture was stirred at room temperature overnight, then quenched with 400 mL 1N NaOH(aq.) and extracted with dichloromethane (200 mL × 3). The combined organic layers were washed with saturated aqueous sodium bicarbonate, dried over MgSO4 and concentrated to give 7-methylquineline N-oxide. The crude product was used without further purification. To a solution of 7-methylquinoline N-oxide in dichloromethane (200 mL) was added trimethylsilyl cyanide (11.9g, 120.6 mmol) and dimethylcarbamoyl chloride (13.0 g 120.6 mmol). The mixture was stirred at room temperature overnight, then quenched with saturated sodium bicarbonate and extracted with dichloromethane (200 mL × 3). The combined organic layers were washed with saturated aqueous sodium chloride, dried over MgSO4 and concentrated in vacuo. The residue was purified by flash chromatography on silica gel (hexanes to ethyl acetate gradient column) to yield the compound 8 as white solid (7.3 g, 74% over two steps). Rf = 0.3 (Hexanes/EtOAc = 20:1). 1H NMR (400 MHz, CDCl3) δ 8.27 (d, J = 8.3 Hz, 1H), 7.95 (s, 1H), 7.81 (d, J = 8.4 Hz, 1H), 7.66 (d, J = 8.3 Hz, 1H), 7.58 – 7.52 (m, 1H), 2.62 (s, 3H). 13C NMR (100 MHz, CDCl3) δ 148.3, 142.1, 137.1, 133.3, 131.8, 128.6, 127.3, 126.8, 122.6, 117.5, 21.9.
4-chloro-7-methylquinoline-2-carbonitrile (9)
Compound 8 (7.0 g, 41.6 mmol) was dissolved in dichloromethane (300 mL) in a round bottom flask with a stir bar. 3-Chloroperoxybenzoic acid (28.7 g, 75%, 124.8 mmol) was added in portions with ice bath. The mixture was stirred at 40°C for 3 h, then additional 3-chloroperoxybenzoic acid (28.7 g, 75%, 124.8 mmol) was added. The mixture was stirred at room temperature overnight, then quenched with 400 mL 1N NaOH(aq.) and extracted with dichloromethane (200 mL × 3). The combined organic layers were washed with saturated aqueous sodium bicarbonate, dried over MgSO4 and concentrated to give 4-chloro-7-methylquinoline-2-carbonitrile N-oxide. The crude product was used without further purification. To a solution of 4-chloro-7-methylquinoline-2-carbonitrile N-oxide in chloroform (200 mL) was added DMF (3.0 g, 41.3 mmol). Then POCl3 (38.0 g, 247.6 mmol) was added in three portions at 70°C in 4 h. The mixture was stirred at 70 °C for 2 h before pour into iced water and extracted with dichloromethane (200 mL × 3). The combined organic layers were washed with saturated aqueous sodium chloride, dried over MgSO4 and concentrated in vacuo. The residue was purified by flash chromatography on silica gel (hexanes to ethyl acetate gradient column) to yield the compound 9 as white solid (5.4 g, 64% over two steps). Rf = 0.3 (Hexanes/EtOAc = 20:1). 1H NMR (400 MHz, CDCl3) δ 8.17 (d, J = 8.6 Hz, 1H), 8.00 – 7.91 (m, 1H), 7.72 (s, 1H), 7.64 (dd, J = 8.7, 1.7 Hz, 1H), 2.62 (s, 3H). 13C NMR (100 MHz, CDCl3) δ 149.0, 143.7, 143.0, 133.1, 132.8, 129.2, 125.3, 123.8, 122.5, 116.7, 21.8.
7-(bromomethyl)-4-chloroquinoline-2-carbonitrile (10)
To a solution of the compound 9 (1.17 g, 5.76 mmol) in CCl4 (110 mL) under Ar was added N-bromosuccinimide (1.13 g, 6.33 mmol) and benzoyl peroxide (139.50 mg, 0.579 mmol). The mixture was stirred at 85°C for 4 h, then quenched with water (50 mL) and extracted with dichloromethane (100 mL × 3). The combined organic layers were washed with saturated aqueous sodium chloride, dried over MgSO4 and concentrated in vacuo. The residue was purified by flash chromatography on silica gel (hexanes to ethyl acetate gradient column) to yield the compound 10 as white solid (60%, 967 mg). Rf = 0.2 (Hexanes/EtOAc = 20:1). 1H NMR (400 MHz, CDCl3) δ 8.29 (d, J = 8.6 Hz, 1H), 8.17 (s, 1H), 7.84 (d, J = 8.6 Hz, 1H), 7.80 (s, 1H), 4.68 (s, 2H). 13C NMR (100 MHz, CDCl3) δ 148.7, 144.0, 142.1, 133.8, 131.4, 129.8, 126.8, 125.1, 123.7, 116.4, 31.5.
4-chloro-7-((2,5-dioxopyrrolidin-1-yl)methyl)quinoline-2-carbonitrile (11)
To a solution of the compound 10 (719 mg, 2.55 mmol) and succinimide (303 mg, 3.06 mmol) in DMF (15 mL) was added Cs2CO3 (1.66 g, 5.11 mmol). The mixture was stirred at room temperature for 0.5 h, then quenched with saturated aqueous KH2PO4 (40 mL) and extracted with ethyl acetate (40 mL × 3). The combined organic layers were washed with saturated aqueous sodium chloride, dried over MgSO4 and concentrated in vacuo. The residue was purified by flash chromatography on silica gel (hexanes to ethyl acetate gradient column) to yield the compound 11 as white solid (80%, 612 mg). Rf = 0.2 (Hexanes/EtOAc = 1:1). 1H NMR (400 MHz, CDCl3) δ 8.25 (d, J = 8.7 Hz, 1H), 8.09 (s, 1H), 7.80 (d, J = 8.8 Hz, 1H), 7.77 (s, 1H), 4.92 (s, 2H), 2.81 (s, 4H). 13C NMR (100 MHz, CDCl3) δ 176.5, 148.7, 144.0, 140.0, 133.6, 130.9, 129.3, 126.6, 124.8, 123.4, 116.4, 41.8, 28.2.
7-((2,5-dioxopyrrolidin-1-yl)methyl)-4-(2-fluoro-4-methoxyphenyl)quinoline-2-carboxamide (QCA; 16)
To a solution of the 2-fluoro-4-methoxyphenylboronic acid (54.4 mg, 0.320 mmol) and Na2CO3 (56.6 mg, 0.534 mmol) in 1,4-dioxane : water (v/v, 10/1, 1.8 mL) was added compound 11 (80.0 mg, 0.267 mmol) and Pd(PPh3)4 (30.9 mg, 0.0267 mmol) under Ar. The mixture was stirred at 100°C for 4 h, then quenched with water (3 mL) and extracted with ethyl acetate (5 mL × 3). The combined organic layers were washed with saturated aqueous sodium chloride, dried over MgSO4 and concentrated in vacuo. The residue was used without further purification. To the residue solution in acetone : water (v/v, 2/1, 15 mL) was added sodium percarbonate (0.251 g, 1.60 mmol). The mixture was stirred at room temperature for 4h, then added ethyl acetate (5 mL) and extracted with ethyl acetate (5 mL × 3). The residue was purified by flash chromatography on silica gel (hexanes to ethyl acetate gradient column) to yield QCA (16) as white solid (42% for two steps, 55 mg). Rf = 0.2 (Hexanes/EtOAc = 1:3). 1H NMR (300 MHz, DMSO-d6) δ 8.02 (s, 1H), 8.01 (s, 1H), 7.97 (s, 1H), 7.82 (s, 1H), 7.69 – 7.56 (m, 2H), 7.46 (t, J = 8.6 Hz, 1H), 6.86 – 6.72 (m, 2H), 4.78 (s, 2H), 3.87 (s, 3H), 2.73 (s, 4H). 13C NMR (75 MHz, DMSO-d6) δ 178.1, 166.4, 161.9 (d, J = 11.0 Hz), 160.0 (d, J = 244.1 Hz), 150.8, 146.8, 143.7, 139.2, 132.6 (d, J = 4.9 Hz), 128.9, 128.3, 126.8, 126.3, 120.0, 116.7 (d, J = 15.9 Hz), 111.6, 102.4 (d, J = 25.4 Hz), 56.3, 41.6, 28.7.
7-((2,5-dioxopyrrolidin-1-yl)methyl)-4-(2-fluoro-4-hydroxyphenyl)quinoline-2-carboxamide (17)
To a solution of the 2-fluoro-4-hydroxyphenylboronic acid (50 mg, 0.320 mmol) and Na2CO3 (56.6 mg, 0.534 mmol) in 1,4-dioxane : water (v/v, 10/1, 1.8 mL) was added compound 11 (80.0 mg, 0.267 mmol) and Pd(PPh3)4 (30.9 mg, 0.0267 mmol) under Ar. The mixture was stirred at 100°C for 4 h, then quenched with water (3 mL) and extracted with ethyl acetate (5 mL × 3). The combined organic layers were washed with saturated aqueous sodium chloride, dried over MgSO4 and concentrated in vacuo. The residue was used without further purification. To the residue solution in acetone : water (v/v, 2/1, 1.5 mL) was added sodium percarbonate (0.251 g, 1.60 mmol). The mixture was stirred at room temperature for 4 h, then added ethyl acetate (5mL) and extracted with ethyl acetate (5 mL × 3). The residue was purified by flash chromatography on silica gel (hexanes to ethyl acetate gradient column) to yield the compound 13 as white solid (39% for two steps, 49 mg). Rf = 0.2 (Hexanes/EtOAc = 1:3). 1H NMR (300 MHz, DMSO-d6) δ 10.32 (s, 1H), 8.31 (s, 1H), 8.01 (s, 1H), 7.96 (s, 1H), 7.81 (s, 1H), 7.71 – 7.66 (m, 2H), 7.34 (t, J = 8.6 Hz, 1H), 6.86 – 6.72 (m, 2H), 4.78 (s, 2H), 2.73 (s, 4H). 13C NMR (75 MHz, DMSO-d6) δ 177.6, 166.0, 159.6 (d, J = 243.7 Hz), 160.0 (d, J = 11.7 Hz), 150.3, 146.4, 143.6, 138.6, 132.2 (d, J = 5.0 Hz), 128.4, 127.9, 126.5, 126.0, 119.5, 114.7 (d, J = 15.7 Hz), 112.3, 103.0 (d, J = 24.1 Hz), 41.2, 28.2.
7-((2,5-dioxopyrrolidin-1-yl)methyl)-4-(2-fluoro-4-(2-fluoroethoxy)phenyl)quinoline-2-carboxamide (FEQCA; 18)
To a solution of the 2-fluoro-4-hydroxyphenylboronic acid (50 mg, 0.320 mmol) and Na2CO3 (56.6 mg, 0.534 mmol) in 1,4-dioxane : water (v/v, 10/1, 1.8 mL) was added compound 11 (80.0 mg, 0.267 mmol) and Pd(PPh3)4 (30.9 mg, 0.0267 mmol) under Ar. The mixture was stirred at 100°C for 4 h, then quenched with water (3 mL) and extracted with ethyl acetate (5 mL × 3). The combined organic layers were washed with saturated aqueous sodium chloride, dried over MgSO4 and concentrated in vacuo. The residue was used without further purification. To the residue solution in DMF (1.5 mL) was added 1-fluoro-2-iodoethane (112 mg, 0.640 mmol) and Cs2CO3 (209 mg, 0.640 mmol). The mixture was stirred at room temperature overnight, then quenched with saturated aqueous KH2PO4 (5 mL). The combined organic layers were washed with saturated aqueous sodium chloride, dried over MgSO4 and concentrated in vacuo. The residue was purified by flash chromatography on silica gel (hexanes to ethyl acetate gradient column) to yield the compound 14 as white solid (45% for two steps, 50.6 mg) and used directly in the next step. To the solution of compound 14 (42.1 mg, 0.1 mmol) in acetone : water (v/v, 2/1, 2 mL) was added sodium percarbonate (78 mg, 0.50 mmol). The mixture was stirred at room temperature for 4h, then added ethyl acetate (5 mL) and extracted with ethyl acetate (5 mL × 3). The residue was purified by flash chromatography on silica gel (hexanes to ethyl acetate gradient column) to yield FEQCA (18) as white solid (60%, 26.3 mg). Rf = 0.2 (Hexanes/EtOAc = 1:3). 1H NMR (300 MHz, DMSO-d6) δ 8.34 (s, 1H), 8.03 (s, 1H), 7.99 (s, 1H), 7.83 (s, 1H), 7.69 – 7.59 (m, 2H), 7.47 (t, J = 8.6 Hz, 1H), 7.45 – 7.02 (m, 2H), 4.79 (dt, J=47.9, 3.5 Hz), 4.78 (s, 2H), 4.37 (dt, J=30.0, 3.5 Hz), 2.73 (s, 4H). 13C NMR (75 MHz, DMSO-d6) δ 178.1, 166.4, 160.0 (d, J = 243.8 Hz), 160.6 (d, J = 11.1 Hz), 150.7, 146.8, 143.6, 139.2, 134.7 (d, J = 4.7 Hz), 128.9, 128.4, 126.7, 126.3, 120.0, 117.1 (d, J = 15.8 Hz), 112.0, 103.0 (d, J = 25.7 Hz), 82.4 (d, J = 165.6 Hz), 68.2 (d, J = 18.8 Hz), 41.6, 28.6.
7-((2,5-dioxopyrrolidin-1-yl)methyl)-4-(2-fluoro-4-(3-fluoropropoxy)phenyl)quinoline-2-carboxamide (FPQCA; 19)
To a solution of the 2-fluoro-4-hydroxyphenylboronic acid (50 mg, 0.320 mmol) and Na2CO3 (56.6 mg, 0.534 mmol) in 1,4-dioxane : water (v/v, 10/1, 1.8 mL) was added compound 11 (80.0 mg, 0.267 mmol) and Pd(PPh3)4 (30.9 mg, 0.0267 mmol) under Ar. The mixture was stirred at 100°C for 4 h, then quenched with water (3 mL) and extracted with ethyl acetate (5 mL × 3). The combined organic layers were washed with saturated aqueous sodium chloride, dried over MgSO4 and concentrated in vacuo. The residue was used without further purification. To the residue solution in DMF (1.5 mL) was added 1-fluoro-3-iodopropane (120 mg, 0.640 mmol) and Cs2CO3 (209 mg, 0.640 mmol). The mixture was stirred at room temperature overnight, then quenched with saturated aqueous KH2PO4 (5 mL). The combined organic layers were washed with saturated aqueous sodium chloride, dried over MgSO4 and concentrated in vacuo. The residue was purified by flash chromatography on silica gel (hexanes to ethyl acetate gradient column) to yield the compound 15 as white solid (47% for two steps, 54.6 mg) and used directly in the next step. To the solution of compound 15 (43.6 mg, 0.1 mmol) in acetone : water (v/v, 2/1, 2 mL) was added sodium percarbonate (78 mg, 0.50 mmol). The mixture was stirred at room temperature for 4 h, then added ethyl acetate (5 mL) and extracted with ethyl acetate (5 mL × 3). The residue was purified by flash chromatography on silica gel (hexanes to ethyl acetate gradient column) to yield FPQCA (19) as white solid (53%, 24 mg). Rf = 0.2 (Hexanes/EtOAc = 1:3). 1H NMR (300 MHz, DMSO-d6) δ 8.33 (s, 1H), 8.02 (s, 1H), 7.97 (s, 1H), 7.82 (s, 1H), 7.69 – 7.57 (m, 2H), 7.46 (t, J=8.6 Hz, 1H), 7.45 – 7.02 (m, 2H), 4.78 (s, 2H), 4.63 (dt, J = 47.3, 5.9 Hz), 4.19 (t, J = 6.3 Hz), 2.73 (s, 4H), 2.22 – 2.07 (m, 2H). 13C NMR (75 MHz, DMSO-d6) δ 178.1, 166.4, 160.0(d, J = 244.4 Hz), 161.0 (d, J = 12.5 Hz), 150.7, 146.8, 143.7, 139.2, 132.6 (d, J = 5.0 Hz), 128.9, 128.3, 126.8, 126.3, 120.0, 116.8 (d, J = 16.0 Hz), 112.0, 102.9 (d, J = 25.6 Hz), 81.2 (d, J = 160.7 Hz), 64.7 (d, J = 5.3 Hz), 41.6, 64.7 (d, J = 19.6 Hz), 28.6.
Pharmacology
Cell line generation and thallium flux assays
In order to generate human mGlu2 and mGlu3 stable cell lines to be used for thallium flux assays, human mGlu2 and mGlu3 were prepared by PCR amplification of the entire coding sequence of each receptor and cloning into pIRES puro 3 (Invitrogen). For mGlu2 and mGlu3, the cloning sites were NheI/NotI. HEK GIRK cells, generously provided by Lily Jan (University of California San Francisco, San Francisco, CA), were transfected with 24 μg of DNA using Fugene6 (Promega), stable transfectants were selected with 1000 ng/mL puromycin dihydrochloride (Sigma-Aldrich, St. Louis, MO), and polyclonal human mGlu2 GIRK and mGlu3 GIRK cell lines were established. Cells were maintained following selection in 45% DMEM, 45% Ham's F12, 10% FBS, 100 units/mL penicillin/streptomycin, 20 mM HEPES, pH 7.3, 1 mM sodium pyruvate, 2 mM glutamine, 700 μg/mL G418 (Mediatech, Inc., Herndon, VA), and 600 μg/mL puromycin (growth media) at 37°C in the presence of 5% CO2. All cell culture reagents were purchased from Invitrogen Corp. (Carlsbad, CA) unless otherwise noted.
Human mGlu2 and mGlu3 thallium flux in vitro assays
Compound activity at mGlu2 and mGlu3 was assessed using thallium flux through GIRK channels, a method that has been described in detail.80,81 Briefly, cells were plated into 384-well, black-walled, clear-bottomed poly-D-lysine-coated plates at a density of 15,000 cells/20 µL/well in DMEM containing 10% dialyzed FBS, 20 mM HEPES, and 100 units/mL penicillin/streptomycin (assay media). Plated cells were incubated overnight at 37°C in the presence of 5% CO2. The following day, the medium was exchanged from the cells to assay buffer [Hanks’ balanced salt solution (Invitrogen) containing 20 mM HEPES, pH 7.3] using an ELX405 microplate washer (BioTek), leaving 20 µL/well, followed by the addition of 20 µL/well FluoZin2-AM (330 nM final concentration) indicator dye (Invitrogen; prepared as a stock in DMSO and mixed in a 1:1 ratio with Pluronic acid F-127) in assay buffer. Cells were incubated for 1 h at room temperature, and the dye exchanged to assay buffer using an ELX405, leaving 20 µL/well. For concentration-response curve experiments, compounds were serially diluted 1:3 into 10 point concentration response curves and were transferred to daughter plates using an Echo acoustic plate reformatter (Labcyte, Sunnyvale, CA). Test compounds were diluted to 2 times their final desired concentration in assay buffer (0.3% DMSO final concentration). Agonists were diluted in thallium buffer [125 mM sodium bicarbonate (added fresh the morning of the experiment), 1 mM magnesium sulfate, 1.8 mM calcium sulfate, 5 mM glucose, 12 mM thallium sulfate, and 10 mM HEPES, pH 7.3] at 5 times the final concentration to be assayed. Cell plates and compound plates were loaded onto a kinetic imaging plate reader (FDSS 6000 or 7000; Hamamatsu Corporation, Bridgewater, NJ). Appropriate baseline readings were taken (10 images at 1 Hz; excitation, 470 ± 20 nm; emission, 540 ± 30 nm) and test compounds were added in a 20 µL volume and incubated for approximately 1 hour at room temperature before the addition of 10 µL of thallium buffer with or without an EC80 concentration of the agonist glutamate for potency evaluation experiments or with a full concentration-response of glutamate for Schild analysis experiments. After the addition of agonist, data were collected for approximately an additional 2.5 min. Data were analyzed using Excel (Microsoft Corp, Redmond, WA). The slope of the fluorescence increase beginning 5 s after thallium/agonist addition and ending 15 s after thallium/agonist addition was calculated, corrected to vehicle and maximal agonist control slope values, and plotted in using either XLfit (ID Business Solutions Ltd) or Prism software (GraphPad Software, San Diego, CA) to generate concentration-response curves. Potencies were calculated from fits using a four-point parameter logistic equation.
Measurement of physicochemical properties
Measurement of partition coefficient (LogP) (“shake flask method”)
The measurement of LogP value was performed by mixing test compound (50µL, 20 µM in DMSO) with n-octanol (475 µL) and water (475 µL) in a test tube. The n-octanol and water were pre-saturated with each other before use. The tube was vortexed for 1 min before shaken at 37°C overnight. Water phase and n-octanol phase (200 µL each) were aliquoted. The amount of the test compound in each phase was determined by LC-MS/MS (Agilent 6430 Triple Quad LC/MS). The LogP was calculated by Log [ratio between the amount of test compound in n-octanol and water solution]. The procedure was repeated triplicate and the value was shown in Table 1.
Measurement of pH stability
The stability of compounds in buffer solutions was measured using a HPLC method adapted from our previous protocol.82 Briefly, testing compounds 16, 18–19 (0.25 µmol) were each dissolved in 1 mL DMSO to make a stock solution. An aliquot (50 µL stock solution) was mixed with phosphate buffer (950 µL, 20 mM, pH 7.4), boric acid-KCl-NaOH buffer (950 µL, 20 mM, pH 9.4) or sodium acetate-KCl-HCl buffer (950 µL, 20 mM, pH 5.0) and incubated for 1 h at 37 °C. The percentage of the unchanged compound was monitored by HPLC (Luna analytical column, 4.6 × 250 mm, 5 µm, CH3CN/H2O + 0.1% TFA).
Measurement of plasma stability
The stability of candidate compounds in rat serum was measured using a literature method.83 Briefly, the test was performed by mixing a candidate compound (10 µL, 10 µM in DMSO stock solution) with 250 µL aliquot of rat serum (Abcam, Inc. No. ab7488) in a test tube. The tube was vortexed before incubated at 37°C for 60 min. The reaction was quenched by the addition of 250 µL ice-cold CH3CN, followed by centrifuge at 10,000 × g for 10 min. The amount of the test compound was quantified by LC-MS/MS (Agilent 6430 Triple Quad LC/MS). The percentage remaining was calculated by (peak area at 60 min) / (peak area at 0 min)×100%. The procedure was repeated at least triplicate and diltiazem was used as a positive control.
Measurement of liver microsomal stability
The stability of candidate compounds in liver microsomes was measured using a literature method.84 Briefly, the test was performed by mixing a candidate compound (0.5 µL, 2 mM in DMSO stock solution) with PBS (432 µL) and 13 µL aliquot of Sprague-Dawley rat liver microsomes (Sigma-Aldrich, No. M9066) in a test tube. The tube was vortexed before shaken at 37°C for 5 min, followed by the addition of NADPH (50 µL, 10 mM in PBS stock solution). The mixture was incubated at 37°C for 60 min, and quenched by the addition of 250µL ice-cold CH3CN and centrifuge at 10,000 × g for 10 min. The amount of the test compound was quantified by LC-MS/MS (Agilent 6430 Triple Quad LC/MS). The percentage remaining was calculated by (peak area at 60 min)/(peak area at 0 min) × 100%. The procedure was repeated at least triplicate and verapamil was used as a positive control.
Radiochemistry
Radiolabeling of [11C]QCA
[11C]Methyl iodide ([11C]CH3I) was synthesized from cyclotron-produced [11C]CO2, which was produced by 14N(p, α)11C nuclear reaction. Briefly, [11C]CO2 was bubbled into a solution of LiAlH4 (0.4 M in THF, 300 μL). After evaporation, the remaining reaction mixture was treated with hydroiodic acid (57% aqueous solution, 300 μL). The resulting [11C]CH3I was transferred under helium gas with heating into a pre-cooled (−15 to −20 °C) reaction vessel containing precursor 17 (0.5 mg), NaOH (2.5 μL, 0.5 M) and anhydrous DMF (300 μL). After the radioactivity reached a plateau during transfer, the reaction vessel was warmed to 80 °C and maintained for 5 min. CH3CN/H2O + 0.1% Et3N (v/v, 4/6, 0.5 mL) was added to the reaction mixture, which was then injected to a semi-preparative HPLC system. HPLC purification was completed on a Capcell Pak UG80 C18 column (10 mm ID × 250 mm) using a mobile phase of CH3CN/H2O + 0.1% Et3N (v/v, 4/6) at a flowrate of 6.0 mL/min. The retention time for [11C]QCA was 9.5 min. The radioactive fraction corresponding to the desired product was collected in a sterile flask, evaporated to dryness in vacuo, and reformulated in a saline solution (3 mL) containing 100 µL of 25% ascorbic acid in sterile water and 100 µL of 20% Tween® 80 in ethanol. (Note: We added ascorbic acid to prevent potential radiolysis and Tween® 80 to improve aqueous solubility.) The synthesis time was ca. 30 min from end-of-bombardment. Radiochemical and chemical purity were measured by analytical HPLC (Capcell Pak UG80 C18, 4.6 mm ID × 250 mm, UV at 254 nm; CH3CN / H2O + 0.1% Et3N (v/v, 4/6) at a flowrate of 1.2 mL/min). The identity of [11C]QCA was confirmed by the co-injection with unlabeled QCA. Radiochemical yield was 46% decay-corrected based on [11C]CO2 with >99% radiochemical purity and greater than 2 Ci/μmol specific activity.
Ex vivo biodistribution in mice
A solution of [11C]QCA (50 μCi/150–200 µL) was injected into DdY mice via the tail vein. These mice (n = 5, each time point) were sacrificed at 1, 5, 15, 30 and 60 min post tracer injection. Major organs, including whole brain, heart, liver, lung, spleen, kidneys, small intestine (including contents), muscle, testes, and blood samples were quickly harvested and weighted. The radioactivity present in these tissues was measured using a gamma counter (PerkinElmer, USA), and all radioactivity measurements were automatically decay corrected based on half-life of 11C. The results are expressed as the percentage of injected dose per gram of wet tissue (% ID/g) or standardized uptake value (SUV).
In vitro autoradiography
Rat brain was cut into 20 µM sections and stored at −80°C until they were used for experiment. The rat brain sections were pre-incubated with Tris-HCl buffer (50 mM), MgCl2 (1.2 mM) and CaCl2 (2 mM) solution for 20 min at ambient temperature, followed by incubation with [11C]QCA (0.48 nM). For blocking studies, unlabeled QCA (1 µM) was added to incubation solution in advance to determine the specificity of radioligand binding. After incubation, brain sections were rinsed with ice-cold buffer three times for 2 min, dipped in cold distilled water for 10 sec. The brain sections were dried with cold air, then placed on imaging plates (BAS-MS2025, GE Healthcare, NJ, USA) for optimized contact periods. Autoradiograms were obtained and ROIs were carefully drawn with the reference of naked-eye observation. Radioactivity was expressed as photostimulated luminescene values per unit area (PSL/mm2) and measured by a Bio-Imaging analyzer system (BAS5000, Fujifilm)
Small-animal PET imaging studies
PET scans were acquired by an Inveon PET scanner (Siemens Medical Solutions, Knoxville, TN, USA). Sprague-Dawley rats were kept under anesthesia with 1–2% (v/v) isoflurane during the scan. The radiotracer (ca. 1 mCi/150–200 µL) was injected via a preinstalled catheter via tail vein. A dynamic scan in 3D list mode was acquired for 60 min. For pretreatment studies, QCA (1 mg/kg) pre-dissolved in 300 µL saline containing 10% ethanol and 5% Tween® 80 was injected at 30 min via the tail vein catheter before the injection of [11C]QCA.
As we previously reported,78,79 the PET dynamic images were reconstructed using ASIPro VW software (Analysis Tools and System Setup/Diagnostics Tool, Siemens Medical Solutions). Volumes of interest, including the whole brain, cerebral cortex, cerebellum, striatum, thalamus and pons were placed using ASIPro software. The radioactivity was decay-corrected and expressed as the standardized uptake value. SUV = (radioactivity per mL tissue/injected radioactivity) × body weight.
Radiometabolite analysis
Following the intravenous injection of [11C]QCA, Sprague-Dawley rats were sacrificed at 5, 20 and 60 min (n = 3 each time point). Blood and whole brain samples were quickly removed and the blood samples were centrifuged at 15,000 × g for 2 min at 4 °C to separate the plasma. The supernatant (0.5 mL) was then collected in a test tube containing CH3CN (0.5 mL) and the resulting mixture was vortexed for 15s and centrifuged at 15,000 × g for 2 min for deproteinization. The rat brain was homogenized in an ice-cooled CH3CN/H2O (1 mL, 1/1, v/v) solution. The homogenate was centrifuged at 150,000 rpm for 2 min at 4 °C and the supernatant was collected. The recovery of radioactivity into the supernatant was > 90% based on the total radioactivity in the brain homogenate.
An aliquot of the supernatant (100 µL) obtained from the plasma or brain homogenate was injected into the radio-HPLC system, and analyzed using a Capcell Pak UG80 C18 column (4.6 mm ID × 250 mm) in a mobile phase of CH3CN / H2O + 0.1% Et3N (v/v, 45/55) at a flowrate of 1.0 mL/min. The retention time of [11C]QCA is 7.8 min. The percentage of [11C]QCA to total radioactivity (corrected for decay) on the HPLC charts was calculated as (peak area for [11C]QCA/total peak area) × 100.
Supplementary Material
Acknowledgments
We would like to thank the staff at the radiochemistry program, Massachusetts General Hospital, MA, USA and National Institutes for Quantum and Radiological Science and Technology, National Institute of Radiological Sciences, Chiba, Japan for their support. We thank the National Institute of Mental Health's Psychoactive Drug Screening Program (NIMH PDSP) for the compound screening. The NIMH PDSP is directed by Bryan L. Roth MD, PhD at the University of North Carolina at Chapel Hill and Project Officer Jamie Driscoll at NIMH, Bethesda MD, USA. We also thank Drs. Thomas J. Brady and Lei Zhang for helpful discussion. X.Z. is supported by China Scholarship Council Fellowship (201606200041). N.D.P.C. is supported by a National Institute of Mental Health grant (R01-MH106865). S.H.L is a recipient of NIH career development award from the National Institute on Drug Abuse (DA038000).
ABBREVIATIONS
- PET
positron emission tomography
- mGlu2
metabotropic glutamate receptor 2
- PAM
positive allosteric modulator
- NAM
negative allosteric modulator
- NBS
N-bromosuccinimide
- AIBN
2,2-azobis(2-methylpropionitrile)
- mCPBA
meta-chloroperbenzoic acid
- DCM
dichloromethane
- DMF
dimethylformamide
- ADME
absorption, distribution, metabolism and excretion
- MPO
multiparameter optimization
- SUV
standardized uptake value
- TAC
time-activity curve
- %ID/g
percentage of injected dose per gram of wet tissue
- KO
knockout
- PgP
P-glycoprotein
- Bcrp
breast cancer resistance protein.
Footnotes
ASSOCIATED CONTENT
Retrosynthetic analysis; Characterization of all new compounds and NMR spectra; assay methods; GPCRome data sheet. This material is available free of charge via the Internet at http://pubs.acs.org.
Author Contributions
The manuscript was written through contributions of all authors. All authors have given approval to the final version of the manuscript. #X. Zhang and K. Kumata contributed equally.
The authors declare no competing financial interest.
References
- 1.Nakanishi S. Molecular diversity of glutamate receptors and implications for brain function. Science. 1992;258:597–603. doi: 10.1126/science.1329206. [DOI] [PubMed] [Google Scholar]
- 2.Kew JN, Kemp JA. Ionotropic and metabotropic glutamate receptor structure and pharmacology. Psychopharmacology. 2005;179:4–29. doi: 10.1007/s00213-005-2200-z. [DOI] [PubMed] [Google Scholar]
- 3.Bowie D. Ionotropic glutamate receptors & CNS disorders. CNS Neurol Disord Drug Targets. 2008;7:129–143. doi: 10.2174/187152708784083821. [DOI] [PMC free article] [PubMed] [Google Scholar]
- 4.Traynelis SF, Wollmuth LP, McBain CJ, Menniti FS, Vance KM, Ogden KK, Hansen KB, Yuan H, Myers SJ, Dingledine R. Glutamate receptor ion channels: structure, regulation, and function. Pharmacol Rev. 2010;62:405–496. doi: 10.1124/pr.109.002451. [DOI] [PMC free article] [PubMed] [Google Scholar]
- 5.Lau A, Tymianski M. Glutamate receptors, neurotoxicity and neurodegeneration. Pflugers Arch. 2010;460:525–542. doi: 10.1007/s00424-010-0809-1. [DOI] [PubMed] [Google Scholar]
- 6.Niciu MJ, Kelmendi B, Sanacora G. Overview of glutamatergic neurotransmission in the nervous system. Pharmacol Biochem Behav. 2012;100:656–664. doi: 10.1016/j.pbb.2011.08.008. [DOI] [PMC free article] [PubMed] [Google Scholar]
- 7.Niswender CM, Conn PJ. Metabotropic glutamate receptors: physiology, pharmacology, and disease. Annu Rev Pharmacol Toxicol. 2010;50:295–322. doi: 10.1146/annurev.pharmtox.011008.145533. [DOI] [PMC free article] [PubMed] [Google Scholar]
- 8.Testa CM, Friberg IK, Weiss SW, Standaert DG. Immunohistochemical localization of metabotropic glutamate receptors mGluR1a and mGluR2/3 in the rat basal ganglia. J Comp Neurol. 1998;390:5–19. [PubMed] [Google Scholar]
- 9.Schoepp DD. Unveiling the functions of presynaptic metabotropic glutamate receptors in the central nervous system. J Pharmacol Exp Ther. 2001;299:12–20. [PubMed] [Google Scholar]
- 10.Ohishi H, Shigemoto R, Nakanishi S, Mizuno N. Distribution of the messenger RNA for a metabotropic glutamate receptor, mGluR2 in the central nervous system of the rat. Neuroscience. 1993;53:1009–1018. doi: 10.1016/0306-4522(93)90485-x. [DOI] [PubMed] [Google Scholar]
- 11.Ohishi H, Ogawa-Meguro R, Shigemoto R, Kaneko T, Nakanishi S, Mizuno N. Immunohistochemical localization of metabotropic glutamate receptors, mGluR2 and mGluR3, in rat cerebellar cortex. Neuron. 1994;13:55–66. doi: 10.1016/0896-6273(94)90459-6. [DOI] [PubMed] [Google Scholar]
- 12.Ohishi H, Neki A, Mizuno N. Distribution of a metabotropic glutamate receptor, mGluR2, in the central nervous system of the rat and mouse: an immunohistochemical study with a monoclonal antibody. Neurosci Res. 1998;30:65–82. doi: 10.1016/s0168-0102(97)00120-x. [DOI] [PubMed] [Google Scholar]
- 13.Richards G, Messer J, Malherbe P, Pink R, Brockhaus M, Stadler H, Wichmann J, Schaffhauser H, Mutel V. Distribution and abundance of metabotropic glutamate receptor subtype 2 in rat brain revealed by [3H]LY354740 binding in vitro and quantitative radioautography: Correlation with the sites of synthesis, expression, and agonist stimulation of [35S]GTPγs binding. J Comp Neurol. 2005;487:15–27. doi: 10.1002/cne.20538. [DOI] [PubMed] [Google Scholar]
- 14.Wright RA, Johnson BG, Zhang C, Salhoff C, Kingston AE, Calligaro DO, Monn JA, Schoepp DD, Marek GJ. CNS distribution of metabotropic glutamate 2 and 3 receptors: transgenic mice and [3H]LY459477 autoradiography. Neuropharmacology. 2013;66:89–98. doi: 10.1016/j.neuropharm.2012.01.019. [DOI] [PubMed] [Google Scholar]
- 15.Hovelso N, Sotty F, Montezinho LP, Pinheiro PS, Herrik KF, Mork A. Therapeutic potential of metabotropic glutamate receptor modulators. Curr Neuropharmacol. 2012;10:12–48. doi: 10.2174/157015912799362805. [DOI] [PMC free article] [PubMed] [Google Scholar]
- 16.Soto D, Altafaj X, Sindreu C, Bayes A. Glutamate receptor mutations in psychiatric and neurodevelopmental disorders. Commun Integr Biol. 2014;7:6. doi: 10.4161/cib.27887. [DOI] [PMC free article] [PubMed] [Google Scholar]
- 17.Golubeva AV, Moloney RD, O'Connor RM, Dinan TG, Cryan JF. Metabotropic Glutamate Receptors in Central Nervous System Diseases. Curr Drug Targets. 2016;17:538–616. doi: 10.2174/1389450116666150316224011. [DOI] [PubMed] [Google Scholar]
- 18.Muguruza C, Meana JJ, Callado LF. Group II Metabotropic Glutamate Receptors as Targets for Novel Antipsychotic Drugs. Front Pharmacol. 2016;7 doi: 10.3389/fphar.2016.00130. [DOI] [PMC free article] [PubMed] [Google Scholar]
- 19.Ribeiro FM, Vieira LB, Pires RG, Olmo RP, Ferguson SS. Metabotropic glutamate receptors and neurodegenerative diseases. Pharmacol Res. 2017;115:179–191. doi: 10.1016/j.phrs.2016.11.013. [DOI] [PubMed] [Google Scholar]
- 20.Vaidya A, Jain S, Jain AK, Agrawal A, Kashaw SK, Jain SK, Agrawal RK. Metabotropic glutamate receptors: a review on prospectives and therapeutic aspects. Mini Rev Med Chem. 2013;13:1967–1981. doi: 10.2174/1389557511313130010. [DOI] [PubMed] [Google Scholar]
- 21.Cleva RM, Olive MF. mGlu receptors and drug addiction. Wiley Interdiscip Rev Membr Transp Signal. 2012;1:281–295. doi: 10.1002/wmts.18. [DOI] [PMC free article] [PubMed] [Google Scholar]
- 22.Pomierny-Chamiolo L, Rup K, Pomierny B, Niedzielska E, Kalivas PW, Filip M. Metabotropic glutamatergic receptors and their ligands in drug addiction. Pharmacol Ther. 2014;142:281–305. doi: 10.1016/j.pharmthera.2013.12.012. [DOI] [PubMed] [Google Scholar]
- 23.Kalivas PW, Volkow ND. New medications for drug addiction hiding in glutamatergic neuroplasticity. Mol Psychiatry. 2011;16:974–986. doi: 10.1038/mp.2011.46. [DOI] [PMC free article] [PubMed] [Google Scholar]
- 24.Chiechio S, Nicoletti F. Metabotropic glutamate receptors and the control of chronic pain. Curr Opin Pharmacol. 2012;12:28–34. doi: 10.1016/j.coph.2011.10.010. [DOI] [PubMed] [Google Scholar]
- 25.Campo B, Kalinichev M, Lambeng N, El Yacoubi M, Royer-Urios I, Schneider M, Legrand C, Parron D, Girard F, Bessif A, Poli S, Vaugeois JM, Le Poul E, Celanire S. Characterization of an mGluR2/3 negative allosteric modulator in rodent models of depression. J Neurogenet. 2011;25:152–166. doi: 10.3109/01677063.2011.627485. [DOI] [PubMed] [Google Scholar]
- 26.Dwyer JM, Lepack AE, Duman RS. mGluR2/3 blockade produces rapid and long-lasting reversal of anhedonia caused by chronic stress exposure. J Mol Psychiatry. 2013;1:15. doi: 10.1186/2049-9256-1-15. [DOI] [PMC free article] [PubMed] [Google Scholar]
- 27.Conn PJ, Lindsley CW, Jones CK. Activation of metabotropic glutamate receptors as a novel approach for the treatment of schizophrenia. Trends Pharmacol Sci. 2009;30:25–31. doi: 10.1016/j.tips.2008.10.006. [DOI] [PMC free article] [PubMed] [Google Scholar]
- 28.Dickerson JW, Conn PJ. Therapeutic potential of targeting metabotropic glutamate receptors for Parkinson’s disease. Neurodegener Dis Manag. 2012;2:221–232. doi: 10.2217/nmt.12.6. [DOI] [PMC free article] [PubMed] [Google Scholar]
- 29.Samadi P, Rajput A, Calon F, Grégoire L, Hornykiewicz O, Rajput AH, Di Paolo T. Metabotropic Glutamate Receptor II in the Brains of Parkinsonian Patients. J Neuropathol Exp Neurol. 2009;68:374–382. doi: 10.1097/NEN.0b013e31819cabe4. [DOI] [PubMed] [Google Scholar]
- 30.Lee HG, Zhu X, O'Neill MJ, Webber K, Casadesus G, Marlatt M, Raina AK, Perry G, Smith MA. The role of metabotropic glutamate receptors in Alzheimer's disease. Acta Neurobiol Exp. 2004;64:89–98. doi: 10.55782/ane-2004-1494. [DOI] [PubMed] [Google Scholar]
- 31.Celanire S, Sebhat I, Wichmann J, Mayer S, Schann S, Gatti S. Novel metabotropic glutamate receptor 2/3 antagonists and their therapeutic applications: a patent review (2005 - present) Expert Opin Ther Pat. 2015;25:69–90. doi: 10.1517/13543776.2014.983899. [DOI] [PubMed] [Google Scholar]
- 32.Melancon BJ, Hopkins CR, Wood MR, Emmitte KA, Niswender CM, Christopoulos A, Conn PJ, Lindsley CW. Allosteric modulation of seven transmembrane spanning receptors: theory, practice, and opportunities for central nervous system drug discovery. J Med Chem. 2012;55:1445–1464. doi: 10.1021/jm201139r. [DOI] [PMC free article] [PubMed] [Google Scholar]
- 33.Lindsley CW, Emmitte KA, Hopkins CR, Bridges TM, Gregory KJ, Niswender CM, Conn PJ. Practical Strategies and Concepts in GPCR Allosteric Modulator Discovery: Recent Advances with Metabotropic Glutamate Receptors. Chem Rev. 2016;116:6707–6741. doi: 10.1021/acs.chemrev.5b00656. [DOI] [PMC free article] [PubMed] [Google Scholar]
- 34.Trabanco AA, Cid JM. mGluR2 positive allosteric modulators: a patent review (2009 - present) Expert Opin Ther Pat. 2013;23:629–647. doi: 10.1517/13543776.2013.777043. [DOI] [PubMed] [Google Scholar]
- 35.Felts AS, Rodriguez AL, Smith KA, Engers JL, Morrison RD, Byers FW, Blobaum AL, Locuson CW, Chang S, Venable DF, Niswender CM, Daniels JS, Conn PJ, Lindsley CW, Emmitte KA. Design of 4-Oxo-1-aryl-1,4-dihydroquinoline-3-carboxamides as Selective Negative Allosteric Modulators of Metabotropic Glutamate Receptor Subtype 2. J Med Chem. 2015;58:9027–9040. doi: 10.1021/acs.jmedchem.5b01371. [DOI] [PMC free article] [PubMed] [Google Scholar]
- 36.Fowler JS, Wolf AP. Working against Time: Rapid Radiotracer Synthesis and Imaging the Human Brain. Acc Chem Res. 1997;30:181–188. [Google Scholar]
- 37.Phelps ME. Positron emission tomography provides molecular imaging of biological processes. Proc Natl Acad Sci. 2000;97:9226–9233. doi: 10.1073/pnas.97.16.9226. [DOI] [PMC free article] [PubMed] [Google Scholar]
- 38.Lee C-M, Farde L. Using positron emission tomography to facilitate CNS drug development. Trends Pharmacol Sci. 2006;27:310–316. doi: 10.1016/j.tips.2006.04.004. [DOI] [PubMed] [Google Scholar]
- 39.Willmann JK, van Bruggen N, Dinkelborg LM, Gambhir SS. Molecular imaging in drug development. Nature reviews. Drug discovery. 2008;7:591–607. doi: 10.1038/nrd2290. [DOI] [PubMed] [Google Scholar]
- 40.Sobrio F. Radiosynthesis of carbon-11 and fluorine-18 labelled radiotracers to image the ionotropic and metabotropic glutamate receptors. J Labelled Comp Radiopharm. 2013;56:180–186. doi: 10.1002/jlcr.2995. [DOI] [PubMed] [Google Scholar]
- 41.Fuchigami T, Nakayama M, Yoshida S. Development of PET and SPECT Probes for Glutamate Receptors. Scientific World J. 2015:19. doi: 10.1155/2015/716514. [DOI] [PMC free article] [PubMed] [Google Scholar]
- 42.Mu L, Ametamey SM. Current Radioligands for the PET Imaging of Metabotropic Glutamate Receptors. In: Dierckx RAJO, Otte A, de Vries EFJ, van Waarde A, Luiten PGM, editors. PET and SPECT of Neurobiological Systems. Springer Berlin Heidelberg; Berlin, Heidelberg: 2014. pp. 409–443. [Google Scholar]
- 43.Zhang Z, Brownell A-L. Imaging of Metabotropic Glutamate Receptors (mGluRs) In: Bright PP, editor. Neuroimaging - Clinical Applications. 2012. [DOI] [Google Scholar]
- 44.Li D, Shan H, Conti P, Li Z. PET imaging of metabotropic glutamate receptor subtype 5 (mGluR5) Am J Nucl Med Mol Imaging. 2012;2:29–32. [PMC free article] [PubMed] [Google Scholar]
- 45.Li S, Huang Y. In vivo imaging of the metabotropic glutamate receptor 1 (mGluR1) with positron emission tomography: recent advance and perspective. Curr Med Chem. 2014;21:113–123. doi: 10.2174/09298673113209990217. [DOI] [PubMed] [Google Scholar]
- 46.Wang J-Q, Kuruppu D, Brownell A-L. Radiosynthesis of the mGluR2/3 PET tracer (S, S, S)-2-(2-carboxycyclopropyl)-2-(4-[11C]methoxyphenethyl)glycine dimethyl ester ([11C]CMG) J Nucl Med. 2008;49:286P. [Google Scholar]
- 47.Wang J-Q, Zhang Z, Kuruppu D, Brownell A-L. Radiosynthesis of PET radiotracer as a prodrug for imaging group II metabotropic glutamate receptors in vivo. Bioorg Med Chem Lett. 2012;22:1958–1962. doi: 10.1016/j.bmcl.2012.01.039. [DOI] [PMC free article] [PubMed] [Google Scholar]
- 48.Celen S, Koole M, Alcazar J, De Angelis M, Schmidt M, Van Laere K, Verbruggen A, Langlois X, Andres JI, Bormans G. Preliminary biological evaluation of [11C]JNJ42491293 as a radioligand for PET imaging of mGluR2 in brain. J Nucl Med. 2012;53:286. [Google Scholar]
- 49.Andrés J-I, Alcázar J, Cid JM, De Angelis M, Iturrino L, Langlois X, Lavreysen H, Trabanco AA, Celen S, Bormans G. Synthesis, Evaluation, and Radiolabeling of New Potent Positive Allosteric Modulators of the Metabotropic Glutamate Receptor 2 as Potential Tracers for Positron Emission Tomography Imaging. J Med Chem. 2012;55:8685–8699. doi: 10.1021/jm300912k. [DOI] [PubMed] [Google Scholar]
- 50.Majo V, Prabhakaran J, Simpson N, Arango V, Mann JJ, Kumar JD. Development of a [18F]-labeled positive allosteric modulator of the metabotropic glutamate receptor 2 (mGluR2) as a potential PET tracer. J Nucl Med. 2013;54:1072. [Google Scholar]
- 51.Ma Y, Kumata K, Yui J, Zhang Y, Yamasaki T, Hatori A, Fujinaga M, Nengaki N, Xie L, Wang H, Zhang M-R. Synthesis and evaluation of 1-(cyclopropylmethyl)-4-(4-[11C]methoxyphenyl)-piperidin-1-yl-2-oxo-1,2-dihydropyridine-3-carbonitrile ([11C]CMDC) for PET imaging of metabotropic glutamate receptor 2 in the rat brain. Bioorg Med Chem. 2017;25:1014–1021. doi: 10.1016/j.bmc.2016.12.011. [DOI] [PubMed] [Google Scholar]
- 52.PCT/US2015/046962.
- 53.WO2016/087489A1.
- 54.Lavreysen H, Langlois X, Ahnaou A, Drinkenburg W, te Riele P, Biesmans I, Van der Linden I, Peeters L, Megens A, Wintmolders C, Cid JM, Trabanco AA, Andres JI, Dautzenberg FM, Lutjens R, Macdonald G, Atack JR. Pharmacological characterization of JNJ-40068782, a new potent, selective, and systemically active positive allosteric modulator of the mGlu2 receptor and its radioligand [3H]JNJ-40068782. J Pharmacol Exp Ther. 2013;346:514–527. doi: 10.1124/jpet.113.204990. [DOI] [PubMed] [Google Scholar]
- 55.Van Laere K, Koole M, de Hoon J, Van Hecken A, Langlois X, Andres JI, Bormans G, Schmidt M. Biodistribution, dosimetry and kinetic modeling of [11C]JNJ-42491293, a PET tracer for the mGluR2 receptor in the human brain. J Nucl Med. 2012;53:355. [Google Scholar]
- 56.Leurquin-Sterk G, Celen S, Van Laere K, Koole M, Bormans G, Langlois X, Van Hecken A, te Riele P, Alcázar J, Verbruggen A, de Hoon J, Andrés J-I, Schmidt ME. What We Observe In Vivo Is Not Always What We See In Vitro: Development and Validation of 11C-JNJ-42491293, A Novel Radioligand for mGluR2. J Nucl Med. 2017;58:110–116. doi: 10.2967/jnumed.116.176628. [DOI] [PubMed] [Google Scholar]
- 57.McQuade P, Joshi A, Miller P, Zeng Z, Purcell M, Gantert L, Holahan M, Meissner R, Uslaner J, Hostetler E. Discovery and Preclinical Evaluation of an mGluR2-NAM PET Radioligand. J Nucl Med. 2016;57:290. [Google Scholar]
- 58.Lohith T, McQuade P, Salinas C, Anderson M, Reynders T, Bautmans A, Bormans G, Serdons K, Van Laere K, Hostetler E. First-in-human PET imaging of mGluR2 receptors. J Nucl Med. 2016;57:213. [Google Scholar]
- 59.WO2013/066736A1.
- 60.Niswender CM, Johnson KA, Luo Q, Ayala JE, Kim C, Conn PJ, Weaver CD. A novel assay of Gi/o-linked G protein-coupled receptor coupling to potassium channels provides new insights into the pharmacology of the group III metabotropic glutamate receptors. Mol Pharmacol. 2008;73:1213–1224. doi: 10.1124/mol.107.041053. [DOI] [PubMed] [Google Scholar]
- 61.Hemstapat K, Da Costa H, Nong Y, Brady AE, Luo Q, Niswender CM, Tamagnan GD, Conn PJ. A novel family of potent negative allosteric modulators of group II metabotropic glutamate receptors. J Pharmacol Exp Ther. 2007;322:254–264. doi: 10.1124/jpet.106.117093. [DOI] [PubMed] [Google Scholar]
- 62.Kroeze WK, Sassano MF, Huang XP, Lansu K, McCorvy JD, Giguere PM, Sciaky N, Roth BL. PRESTO-Tango as an open-source resource for interrogation of the druggable human GPCRome. Nat Struct Mol Biol. 2015;22:362–369. doi: 10.1038/nsmb.3014. [DOI] [PMC free article] [PubMed] [Google Scholar]
- 63.Arunlakshana O, Schild HO. Some quantitative uses of drug antagonists. Br J Pharmacol Chemother. 1959;14:48–58. doi: 10.1111/j.1476-5381.1959.tb00928.x. [DOI] [PMC free article] [PubMed] [Google Scholar]
- 64.Waterhouse RN. Determination of lipophilicity and its use as a predictor of blood-brain barrier penetration of molecular imaging agents. Mol Imaging Biol. 2003;5:376–389. doi: 10.1016/j.mibio.2003.09.014. [DOI] [PubMed] [Google Scholar]
- 65.Patel S, Gibson R. In vivo site-directed radiotracers: a mini-review. Nucl Med Biol. 2008;35:805–815. doi: 10.1016/j.nucmedbio.2008.10.002. [DOI] [PubMed] [Google Scholar]
- 66.Pike VW. Considerations in the Development of Reversibly Binding PET Radioligands for Brain Imaging. Curr Med Chem. 2016;23:1818–1869. doi: 10.2174/0929867323666160418114826. [DOI] [PMC free article] [PubMed] [Google Scholar]
- 67.OECD. Test No. 107: Partition Coefficient (n-octanol/water): Shake Flask Method. OECD Publishing; [Google Scholar]
- 68.Chung TDY, Terry DB, Smith LH. In Vitro and In Vivo Assessment of ADME and PK Properties During Lead Selection and Lead Optimization - Guidelines, Benchmarks and Rules of Thumb. Bethesda (MD): Eli Lilly & Company and the National Center for Advancing Translational Sciences; 2015. 2004- [PubMed] [Google Scholar]
- 69.Gill SS, Pulido OM. Glutamate receptors in peripheral tissues: current knowledge, future research, and implications for toxicology. Toxicol Pathol. 2001;29:208–223. doi: 10.1080/019262301317052486. [DOI] [PubMed] [Google Scholar]
- 70.Andrés J-I, Alcázar J, Cid JM, De Angelis M, Iturrino L, Langlois X, Lavreysen H, Trabanco AA, Celen S, Bormans G. Synthesis, Evaluation, and Radiolabeling of New Potent Positive Allosteric Modulators of the Metabotropic Glutamate Receptor 2 as Potential Tracers for Positron Emission Tomography Imaging. J Med Chem. 2012;55:8685–8699. doi: 10.1021/jm300912k. [DOI] [PubMed] [Google Scholar]
- 71.Johnson BG, Wright RA, Arnold MB, Wheeler WJ, Ornstein PL, Schoepp DD. [3H]-LY341495 as a novel antagonist radioligand for group II metabotropic glutamate (mGlu) receptors: characterization of binding to membranes of mGlu receptor subtype expressing cells. Neuropharmacology. 1999;38:1519–1529. doi: 10.1016/s0028-3908(99)00053-2. [DOI] [PubMed] [Google Scholar]
- 72.Nikiforuk A, Popik P, Drescher KU, van Gaalen M, Relo AL, Mezler M, Marek G, Schoemaker H, Gross G, Bespalov A. Effects of a positive allosteric modulator of group II metabotropic glutamate receptors, LY487379, on cognitive flexibility and impulsive-like responding in rats. J Pharmacol Exp Ther. 2010;335:665–673. doi: 10.1124/jpet.110.170506. [DOI] [PubMed] [Google Scholar]
- 73.Harpsoe K, Isberg V, Tehan BG, Weiss D, Arsova A, Marshall FH, Brauner-Osborne H, Gloriam DE. Selective Negative Allosteric Modulation Of Metabotropic Glutamate Receptors - A Structural Perspective of Ligands and Mutants. Sci Rep. 2015;5:13869. doi: 10.1038/srep13869. [DOI] [PMC free article] [PubMed] [Google Scholar]
- 74.Lundström L, Bissantz C, Beck J, Wettstein JG, Woltering TJ, Wichmann J, Gatti S. Structural determinants of allosteric antagonism at metabotropic glutamate receptor 2: mechanistic studies with new potent negative allosteric modulators. Br J Pharmacol. 2011;164:521–537. doi: 10.1111/j.1476-5381.2011.01409.x. [DOI] [PMC free article] [PubMed] [Google Scholar]
- 75.Rydberg P, Gloriam DE, Zaretzki J, Breneman C, Olsen L. SMARTCyp: A 2D Method for Prediction of Cytochrome P450-Mediated Drug Metabolism. ACS Medicinal Chemistry Letters. 2010;1:96–100. doi: 10.1021/ml100016x. [DOI] [PMC free article] [PubMed] [Google Scholar]
- 76.Tatsuta T, Naito M, Oh-hara T, Sugawara I, Tsuruo T. Functional involvement of P-glycoprotein in blood-brain barrier. J Biol Chem. 1992;267:20383–20391. [PubMed] [Google Scholar]
- 77.Pike VW. PET Radiotracers: crossing the blood-brain barrier and surviving metabolism. Trends Pharmacol Sci. 2009;30:431–440. doi: 10.1016/j.tips.2009.05.005. [DOI] [PMC free article] [PubMed] [Google Scholar]
- 78.Wang L, Yui J, Wang Q, Zhang Y, Mori W, Shimoda Y, Fujinaga M, Kumata K, Yamasaki T, Hatori A, Rotstein BH, Collier TL, Ran C, Vasdev N, Zhang M-R, Liang SH. Synthesis and preliminary PET imaging studies of a FAAH radiotracer ([11C]MPPO) based on α-ketoheterocyclic scaffold. ACS Chem Neurosci. 2016;7:109–118. doi: 10.1021/acschemneuro.5b00248. [DOI] [PMC free article] [PubMed] [Google Scholar]
- 79.Wang L, Mori W, Cheng R, Yui J, Hatori A, Ma L, Zhang Y, Rotstein BH, Fujinaga M, Shimoda Y, Yamasaki T, Xie L, Nagai Y, Minamimoto T, Higuchi M, Vasdev N, Zhang M-R, Liang SH. Synthesis and Preclinical Evaluation of Sulfonamido-based [11C-Carbonyl]-Carbamates and Ureas for Imaging Monoacylglycerol Lipase. Theranostics. 2016;6:1145–1159. doi: 10.7150/thno.15257. [DOI] [PMC free article] [PubMed] [Google Scholar]
- 80.Sidique S, Dhanya R-P, Sheffler DJ, Nickols HH, Yang L, Dahl R, Mangravita-Novo A, Smith LH, D’Souza MS, Semenova S, Conn PJ, Markou A, Cosford NDP. Orally Active Metabotropic Glutamate Subtype 2 Receptor Positive Allosteric Modulators: Structure-Activity Relationships and Assessment in a Rat Model of Nicotine Dependence. J Med Chem. 2012;55:9434–9445. doi: 10.1021/jm3005306. [DOI] [PMC free article] [PubMed] [Google Scholar]
- 81.Dhanya RP, Sheffler DJ, Dahl R, Davis M, Lee PS, Yang L, Nickols HH, Cho HP, Smith LH, D'Souza MS, Conn PJ, Der-Avakian A, Markou A, Cosford ND. Design and synthesis of systemically active metabotropic glutamate subtype-2 and -3 (mGlu2/3) receptor positive allosteric modulators (PAMs): pharmacological characterization and assessment in a rat model of cocaine dependence. J Med Chem. 2014;57:4154–4172. doi: 10.1021/jm5000563. [DOI] [PMC free article] [PubMed] [Google Scholar]
- 82.Wang L, Mori W, Cheng R, Yui J, Hatori A, Ma L, Zhang Y, Rotstein BH, Fujinaga M, Shimoda Y, Yamasaki T, Xie L, Nagai Y, Minamimoto T, Higuchu M, Vasdev N, Zhang M-R, Liang SH. Synthesis and Preclinical Evaluation of Sulfonamido-based [11C-Carbonyl]-Carbamates and Ureas for Imaging Monoacylglycerol Lipase. Theranostics. 2016;6:1145–1159. doi: 10.7150/thno.15257. [DOI] [PMC free article] [PubMed] [Google Scholar]
- 83.Reed GA. Curr Protoc Pharmacol. Vol. 75. John Wiley & Sons, Inc; 2016. Stability of Drugs, Drug Candidates, and Metabolites in Blood and Plasma; pp. 7.6.1–7.6.12. [DOI] [PMC free article] [PubMed] [Google Scholar]
- 84.Hill JR. In vitro drug metabolism using liver microsomes. Curr Protoc Pharmacol. 2004;23:7.8:7.8.1–7.8.11. doi: 10.1002/0471141755.ph0708s23. [DOI] [PubMed] [Google Scholar]
Associated Data
This section collects any data citations, data availability statements, or supplementary materials included in this article.