ABSTRACT
Mycoplasma gallisepticum, the primary etiologic agent of chronic respiratory disease (CRD) in poultry, leads to prolonged recruitment and activation of inflammatory cells in the respiratory mucosa. This is consistent with the current model of immune dysregulation that ostensibly allows the organism to evade clearance mechanisms and establish chronic infection. To date, studies using quantitative reverse transcription-PCR (qRT-PCR) and microarrays have shown a significant transient upregulation of cytokines and chemokines from tracheal epithelial cells (TECs) in vitro and tracheal tissue ex vivo in response to virulent strain Rlow that contributes to the infiltration of inflammatory cells into the tracheal mucosa. To expand upon these experiments, RNA was isolated from tracheas of 20 chickens infected with M. gallisepticum Rlow and 20 mock-infected animals at days 1, 3, 5, and 7 postinoculation, and samples were analyzed for differential gene expression using Illumina RNA sequencing. A rapid host response was observed 24 h postinfection, with over 2,500 significantly differentially expressed genes on day 3, the peak of infection. Many of these genes have immune-related functions involved in signaling pathways, including Toll-like receptor (TLR), mitogen-activated protein kinase, Jak-STAT, and the nucleotide oligomerization domain-like receptor pathways. Of interest was the increased expression of numerous cell surface receptors, including TLR4 and TLR15, which may contribute to the production of cytokines. Metabolic pathways were also activated on days 1 and 3 postinfection, ostensibly due to epithelial cell distress that occurs upon infection. Early perturbations in tissue-wide gene expression, as observed here, may underpin a profound immune dysregulation, setting the stage for disease manifestations characteristic of M. gallisepticum infection.
KEYWORDS: chicken, immune response, Mycoplasma gallisepticum, RNA-seq
INTRODUCTION
Mycoplasma gallisepticum is the primary etiologic agent of chronic respiratory disease (CRD) in poultry. Infection with this pathogen results in decreased feed efficiency, reduced weight gain, subsequent downgrading of carcasses, and limited egg production and hatchability. Three commercial vaccines are available to control M. gallisepticum infection; however, further development of an improved vaccine that is safe and efficacious for susceptible birds of multiple ages and species is needed (1, 2). To ensure eradication, broiler industries cull their entire flocks in the event of a sporadic outbreak. However, with M. gallisepticum infection frequently being found in U.S. egg-laying facilities, culling is not economically feasible (1–3). These flocks often remain infected for life and provide the opportunity for further spread of infection to other facilities and wild birds (1, 4).
The host mounts a vigorous inflammatory response to M. gallisepticum, resulting in respiratory distress in chickens (1). Lesions of various severities are found lining the trachea and air sacs due to colonization of the bacteria and the excessive recruitment and activation of inflammatory cells. This is one aspect of the immune dysregulation orchestrated by M. gallisepticum that allows it to establish chronic infection (5–10). In addition, virulent strains of M. gallisepticum, such as Rlow, are able to avoid clearance by the host's natural defense mechanisms of the respiratory tract by cytadhering to tracheal epithelial cells. This is established by the function and coexpression of the primary cytadherence molecules GapA and CrmA, which play a critical role in colonization and pathogenesis (11–13).
Previous studies assessing the host tracheal response to M. gallisepticum have utilized methods such as exposure of cultured tracheal epithelial cells in vitro and whole trachea ex vivo (9, 10, 14, 15). The most relevant to the current study, however, is an in vivo analysis of chemokine and cytokine expression profiles of the tracheal host response to Rlow (14). Over the course of an 8-day infection, increased expression of proinflammatory chemokines and cytokines, including lymphotactin, CXCL13, CXCL14, RANTES, interleukin-6 (IL-6), and IL-1β, was observed, while decreased expression was seen in CCL20, IL-8, and IL-12p40. While ex vivo and in vitro studies have revealed similar expression profiles, some discrepancies exist regarding the significance and expression kinetics of inflammatory genes. Irrespective of these differences, these studies further support the premise that the overwhelming host response is ineffective at clearing the organism and contributory to the immunopathogenesis observed upon infection, thereby contributing to the development and progression of CRD (9, 10, 14).
Studies to date have provided beneficial but limited insight into the host response to M. gallisepticum through methods such as quantitative reverse transcription-PCR (qRT-PCR) and microarrays. Given the potential interactions and downstream effects of the proinflammatory genes that have been implicated to date, we hypothesized that the tracheal host response will show much broader changes in differential expression than what has currently been identified. To expand on previous studies, we have utilized RNA sequencing (RNA-Seq) of the host tracheal tissue transcripts subsequent to infection with virulent M. gallisepticum strain Rlow over a 7-day time course. This will provide a comprehensive, unbiased assessment of the changes in gene expression that comprise the maladaptive host response.
RESULTS
Global DEGs between infected and control chickens.
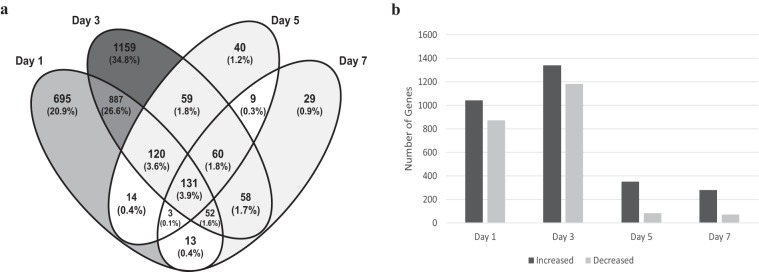
Sampling directly from the tracheal lumen yielded sufficient quantities of RNA to assess transcripts from each chicken and mapped to 17,935 Gallus gallus genes. We found 1,913 differentially expressed genes (DEGs) on day 1 postinfection (p.i.), 2,523 on day 3, 435 on day 5, and 351 on day 7. This indicated that the host mounts a rapid response to M. gallisepticum strain Rlow that peaked at day 3 and decreased toward baseline levels by day 7. Days 1 and 3 postinfection contained the largest numbers of unique DEGs, likely due to the numerous metabolic pathways seen to be involved during early infection, as indicated by pathway analysis (Fig. 1a and 2). At each time point, the number of DEGs with increased expression values exceeded those with decreased expression (Fig. 1b).
FIG 1.
Number of DEGs between infected and control chickens per time point as identified by Cuffdiff. (a) Venn diagram displaying the total number of DEGs. The gray scale is based on the number and percentage of genes identified. (b) The number of DEGs with increased or decreased expression.
FIG 2.
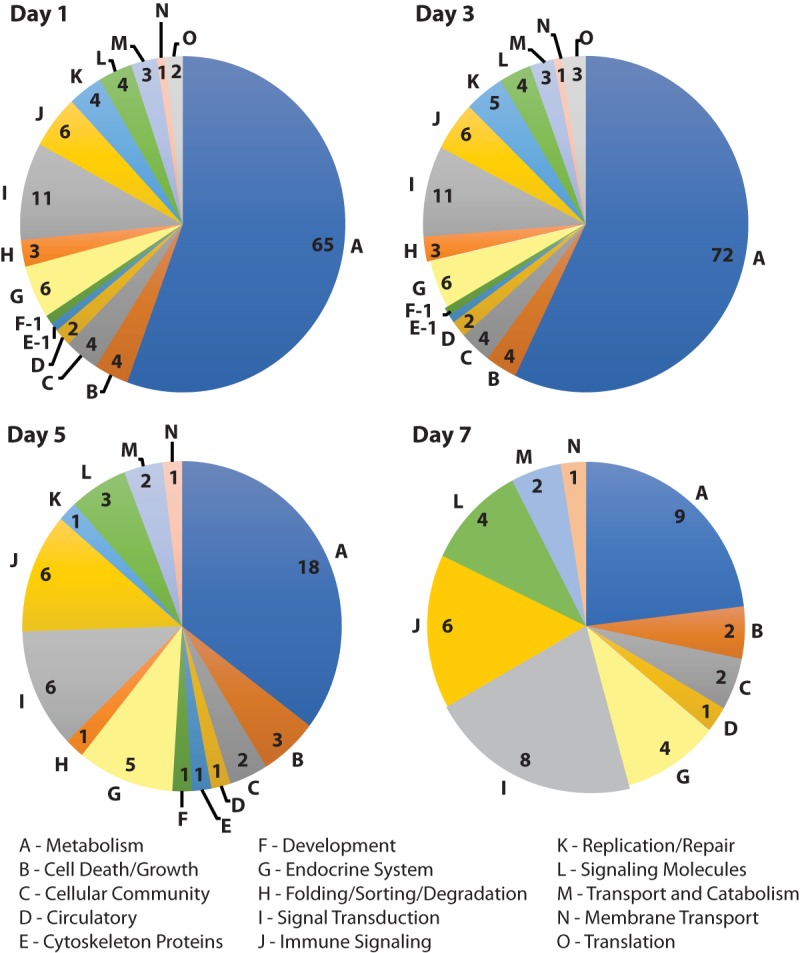
Pathway analysis. Pathways containing ≥2 DEGs were categorized based on function using DAVID bioinformatics software. The number of identified pathways per category is indicated.
Pathway analysis.
The number of pathways affected by M. gallisepticum Rlow, as identified by containing a minimum of two DEGs, was 117 on day 1, 126 on day 3, 51 on day 5, and 39 on day 7. Out of 168 total metabolic pathways identified in chickens, on days 1 and 3 postinfection we found 65 and 72 metabolism-related pathways, respectively, containing DEGs (Fig. 2). As the course of infection continued, the number of metabolic pathways involved decreased to 18 on day 5 and 9 on day 7, reflecting a return to homeostasis. There were 46 pathways involving immune-related functions categorized as immune signaling, signal transduction, and signaling molecule functions. Less variability was seen within immune-related pathway categories throughout the time course, with 21 pathways identified as being affected by infection on days 1 and 3, 15 on day 5, and 18 on day 7.
Functional GO.
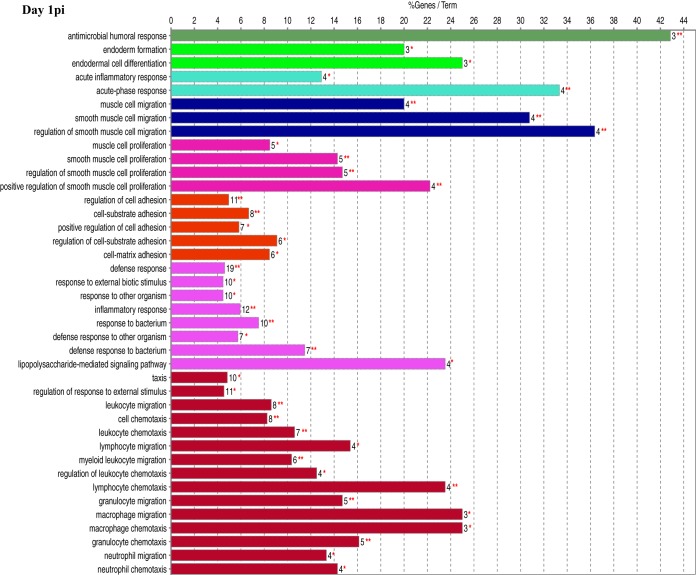
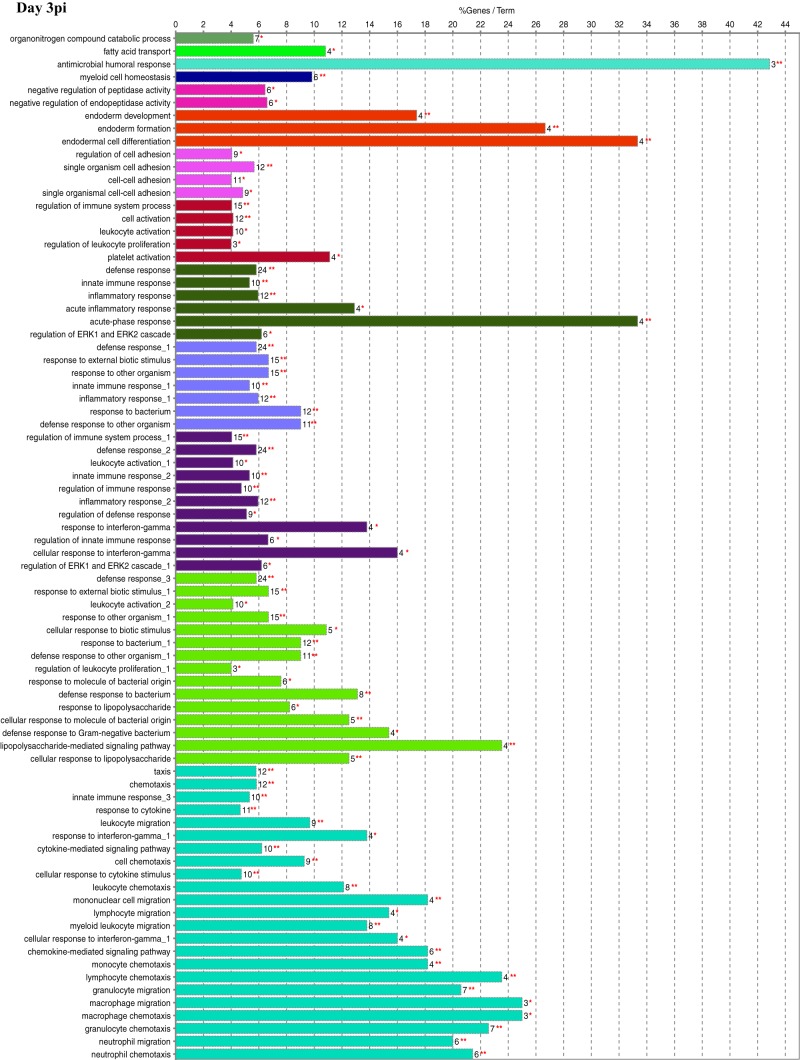
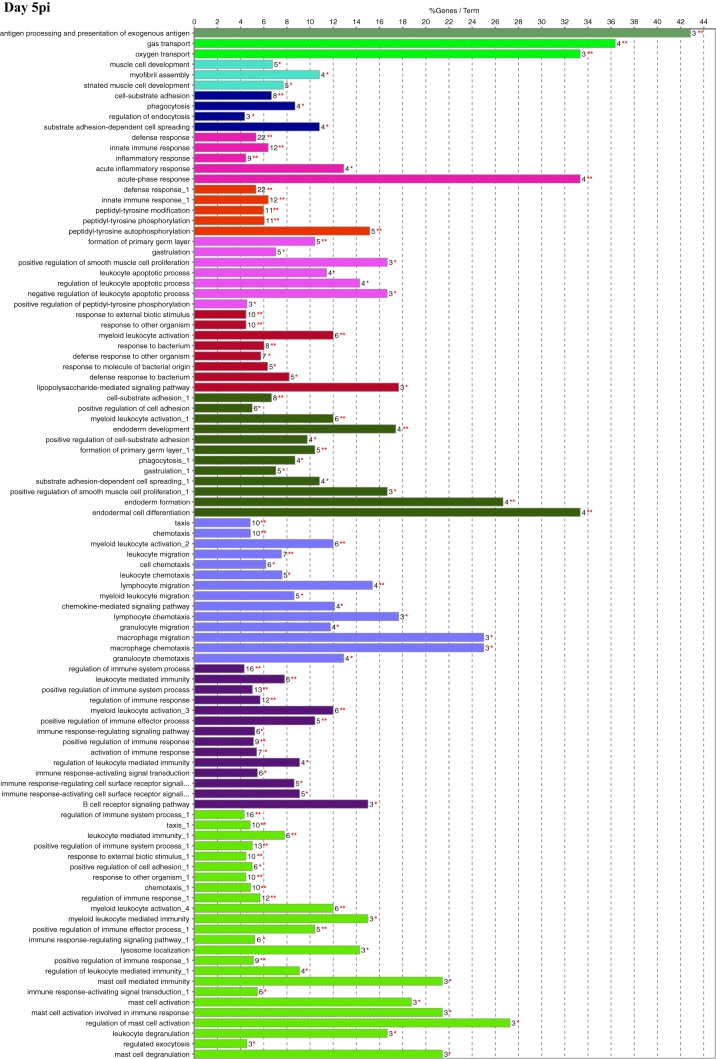
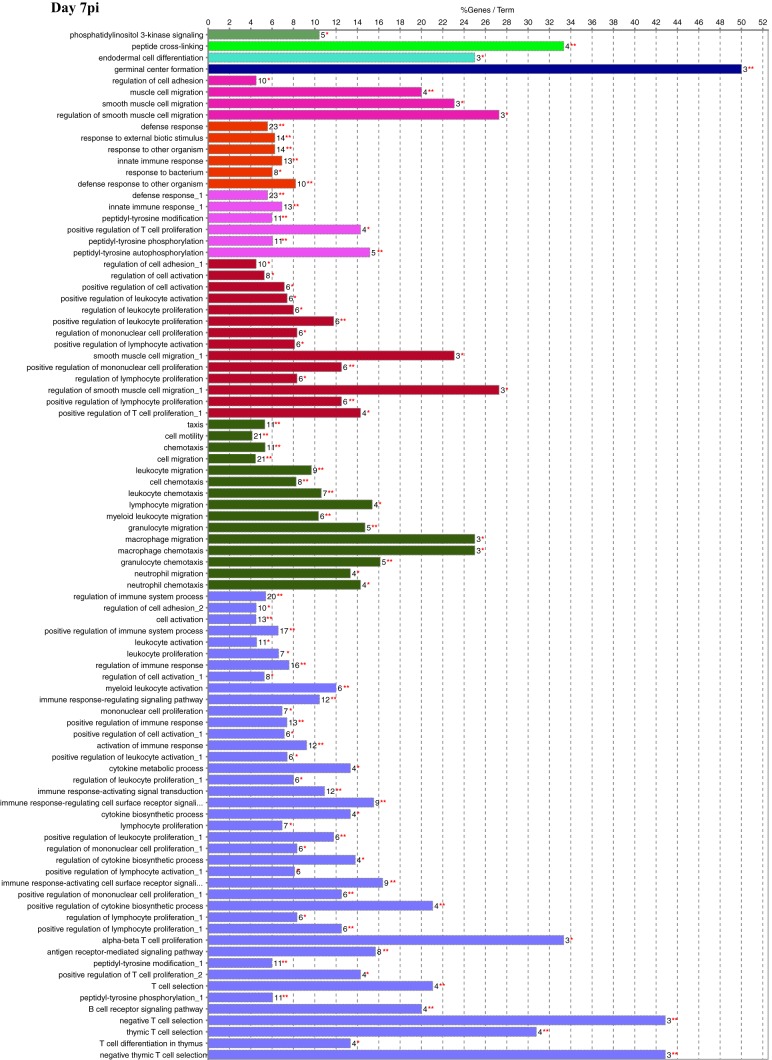
Functional gene ontology (GO) assessment of the DEGs allowed the genes to be categorized based on enriched biological processes (Fig. 3). On day 1 postinfection, there were 195 genes with a log2 fold change of ≥2.00. While a large proportion of pathways were metabolic on days 1 and 3 postinfection (Fig. 2), very few differentially expressed metabolic genes had a log2 fold change of ≥2.00, which resulted in a minimal number of metabolic genes being assessed. The biological process with the highest percentage of DEGs per GO term was “antimicrobial humoral response,” at nearly 43%. Of interest was the number of DEGs found in biological processes related to the host immune, inflammatory, and defense responses as well as “immune cell migration.” One hundred seventy-six DEGs were categorized on day 3 postinfection and indicated additional mitogenic and cytokine-related cellular responses, as shown by the presence of the “regulation of ERK1 and ERK2 cascade,” “response to interferon gamma,” and “cytokine-mediated signaling pathway” biological processes that were not seen on day 1. For day 5 postinfection, 165 DEGs were categorized, including two unique biological processes, “phagocytosis” and “antigen processing and presentation of exogenous antigen,” with the highest percentage of genes per GO term at 43%. There were 184 DEGs categorized on day 7 postinfection, and while there was still an indication of the continued host response to the bacterial pathogen, there were many more processes related to the regulation of the immune response. In addition, this was the first time that processes related to “T-cell selection and differentiation” were identified, potentially reflecting antigen processing, cellular activation, and proliferation/differentiation over time.
FIG 3.
Functional gene ontology. Significant DEGs with a log2 fold change of ≥2.00 were analyzed for enriched biological processes using the ClueGO application for Cytoscape. Bars represent the percentage of associated genes assigned to a unique GO term with the absolute number of associated genes located at the end of the bars. The color of the bars indicates functionally related groups based on the similarity of associated genes. The significance levels of enriched biological processes are indicated (*, P ≤ 0.05; **, P ≤ 0.001).
Immune response.
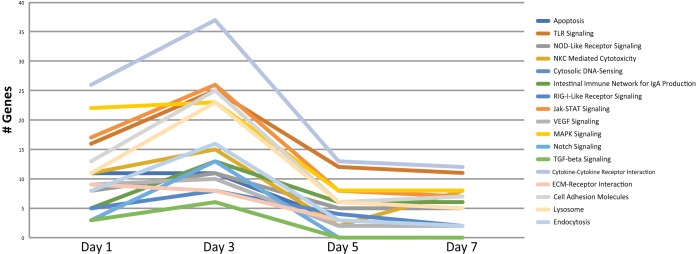
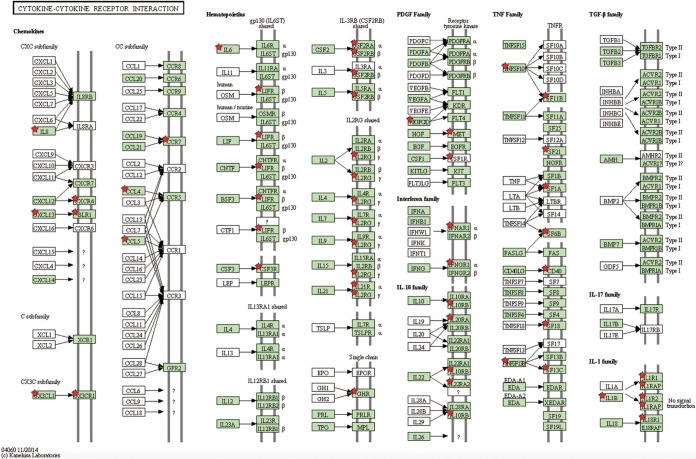
Due to the significant enrichment of immune genes, further assessment of immune-related pathways was conducted. Pathways containing DEGs included, but were not limited to, cytokine-cytokine receptor interaction, the Toll-like receptor (TLR) pathway, the mitogen-activated protein kinase (MAPK) pathway, and the nucleotide oligomerization domain (NOD)-like receptor pathway (Fig. 4). Each of the aforementioned pathways are involved in pathogen recognition and the proinflammatory environment initiated by the production of chemokines and cytokines. The number of DEGs per pathway increased from day 1 to day 3 (peak), decreased at day 5, and appeared to level out by day 7. The cytokine-cytokine receptor interaction pathway contained the greatest number of DEGs, and these predominantly encoded cytokine receptors (Fig. 5).
FIG 4.
Immune-related pathways. Pathway analysis using DAVID bioinformatics software identified the number of DEGs involved in immune-related pathways at each time point.
FIG 5.
Cytokine-cytokine receptor interaction. DEGs identified on day 3 postinfection involved in this pathway are indicated with red stars, as identified by DAVID bioinformatics software. Green shading represents the completeness of the pathway identified within the Gallus gallus genome.
As expected, TLR2 and TLR1A showed significant differential expression on days 3 and 7 postinfection (Fig. 6). Interestingly, TLR4, traditionally a pattern recognition receptor (PRR) for lipopolysaccharide, a ligand that is absent from Mycoplasma species, was significantly increased at each time point. TLR15, unique to avian species, was also found to be significantly increased at all time points.
FIG 6.
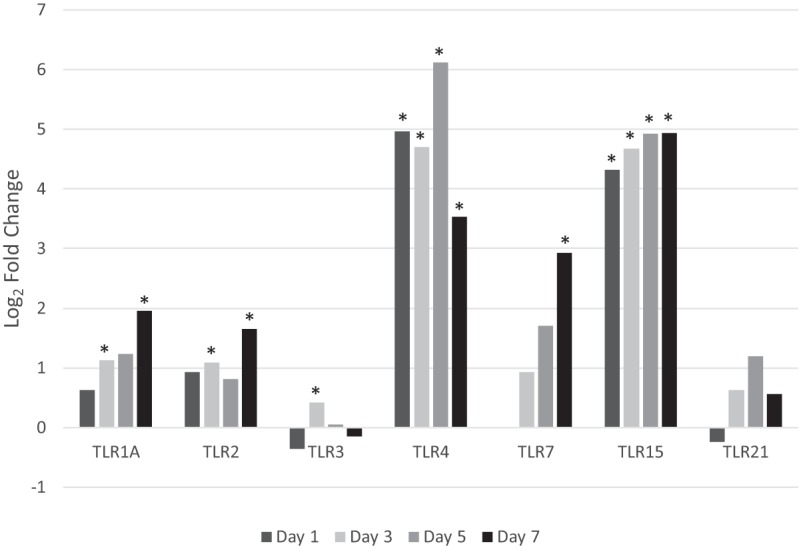
Toll-like receptors. TLRs identified by RNA-Seq are displayed. Differential expression of TLRs between infected and control birds is expressed as log2 fold change. Those with significant differential expression (q ≤ 0.05) are indicated with an asterisk.
Genes with greatest differential expression.
Fold change values for the top 25 genes per time point ranged from a log2 fold change value of −5.0 to +9.2 (Table 1). Protein functions encoded by these genes are involved in pathogen recognition, receptor ligation, proinflammatory cytokines and chemokines, catalytic activity, negative feedback of inflammation, and the maintenance and remodeling of tissue structure. Of the 131 DEGs common to all four time points, many of the genes with the greatest log2 fold change were involved with the host's proinflammatory response, defense, and repair mechanisms, including CCL5, TLR15, TLR4, IL-1β, IL-8, bactericidal permeability-increasing protein (BPI), and matrix metalloprotease 9 (MMP9) (Table 2). The fold change of differential expression for many of the proinflammatory genes was transient and peaked at either day 3 or day 5 postinfection, while the fold change of other genes was stable over the course of infection. Importantly, the continued significant differential expression of multiple cell receptors, proinflammatory cytokines, and chemokines highlights the sustained signaling of immune-related pathways.
TABLE 1.
Top 25 DEGs for each time point based on log2 fold changes as indicated by Cuffdiff
| DEG and day p.i. | Log2 fold change | q value |
|---|---|---|
| Day 1 | ||
| OGCHI | 6.04088 | 0.0124222 |
| ORM1 | 5.74098 | 0.0199122 |
| MMP7 | 5.59571 | 0.00074413 |
| TAC1 | 5.46247 | 0.0199122 |
| IL13RA2 | 5.40911 | 0.00074413 |
| CA4 | 5.40011 | 0.00074413 |
| OLFM4 | 5.36158 | 0.00074413 |
| AVD | 5.28292 | 0.00074413 |
| NOXO1 | 5.10679 | 0.00792793 |
| TNXB | −5.08516 | 0.0124222 |
| CALCA | 5.0309 | 0.00074413 |
| TLR4 | 4.96328 | 0.00074413 |
| NOX1 | 4.88366 | 0.00074413 |
| CXCL1-like | 4.6884 | 0.00074413 |
| BPI-like | 4.63326 | 0.00074413 |
| MR1-11 | 4.58371 | 0.00074413 |
| EX-FABP | 4.52168 | 0.00074413 |
| IL1R2 | 4.48184 | 0.00243919 |
| ENPP3 | 4.47861 | 0.00074413 |
| LOC428141 | 4.33948 | 0.00074413 |
| TLR15 | 4.3237 | 0.00074413 |
| SOCS3 | 4.3124 | 0.00074413 |
| CSF3R | 4.30121 | 0.00074413 |
| DIO2 | 4.21007 | 0.00074413 |
| CCL4 | 4.19982 | 0.0130504 |
| Day 3 | ||
| MMP7 | 9.22771 | 0.000540175 |
| AVD | 6.35072 | 0.000540175 |
| BPI-like | 5.96431 | 0.000540175 |
| IL13RA2 | 5.81634 | 0.0264145 |
| CCL5 | 5.716 | 0.00216963 |
| IL-8L1 | 5.66709 | 0.000540175 |
| DUOXA1 | 5.5092 | 0.00452629 |
| OLFM4 | 5.33946 | 0.000540175 |
| ENPP3 | 5.31691 | 0.000540175 |
| NOX1 | 5.30958 | 0.000540175 |
| EX-FABP | 5.11639 | 0.000540175 |
| GVIN1 | 5.08679 | 0.000540175 |
| RARRES1 | 4.95679 | 0.000540175 |
| LYG2 | 4.8369 | 0.000540175 |
| CCLI10 | 4.83626 | 0.00356638 |
| TLR4 | 4.70113 | 0.000540175 |
| CXCL1-like | 4.68996 | 0.000540175 |
| TLR15 | 4.67092 | 0.000540175 |
| SEMA3G | 4.63938 | 0.00100296 |
| SOCS3 | 4.60883 | 0.000540175 |
| FAM26F | 4.54028 | 0.013978 |
| CSF3R | 4.52223 | 0.000540175 |
| ENSGALG00000004041 | 4.45456 | 0.000540175 |
| IL4I1 | 4.41317 | 0.000540175 |
| MMP9 | 4.38006 | 0.000540175 |
| Day 5 | ||
| CCL5 | 7.14783 | 0.00272989 |
| MMP9 | 6.95883 | 0.00272989 |
| BPI-like | 6.62699 | 0.00272989 |
| IL-8L1 | 6.42486 | 0.00272989 |
| TLR4 | 6.11835 | 0.0429958 |
| EX-FABP | 5.81914 | 0.00272989 |
| SEMA3G | 5.24163 | 0.024569 |
| CCLI10 | 5.21577 | 0.0174307 |
| IL-1BETA | 5.21417 | 0.00272989 |
| TLR15 | 4.92173 | 0.00272989 |
| LYG2 | 4.90495 | 0.00272989 |
| NOX1 | 4.89579 | 0.00272989 |
| IL4I1 | 4.88468 | 0.0148475 |
| ENPP3 | 4.6874 | 0.00272989 |
| CXCL13L2 | 4.67038 | 0.00272989 |
| ENSGALG00000004159 | 4.62434 | 0.0387631 |
| IL-8L2 | 4.62414 | 0.00272989 |
| IRG1 | 4.58645 | 0.00272989 |
| ENSGALG00000001520 | 4.47759 | 0.0222941 |
| INPPL1 | 4.42783 | 0.0134262 |
| ENSGALG00000002902 | 4.36105 | 0.00272989 |
| LY96 | 4.28532 | 0.00272989 |
| SPP1 | 4.26922 | 0.00272989 |
| SOCS3 | 4.19433 | 0.00272989 |
| CALCA | 4.16685 | 0.00272989 |
| Day 7 | ||
| AVD | 8.65253 | 0.0451375 |
| MMP7 | 7.59615 | 0.00314431 |
| CD72 | 5.86627 | 0.0123263 |
| ENSGALG00000023370 | 5.22307 | 0.0229971 |
| CSF3R | 5.1408 | 0.00314431 |
| BPI-like | 4.99055 | 0.00314431 |
| MMP9 | 4.96884 | 0.00314431 |
| TLR15 | 4.93934 | 0.0271603 |
| CCLI10 | 4.89954 | 0.0142561 |
| CCL5 | 4.57728 | 0.0189036 |
| IL-8L1 | 4.57668 | 0.0159813 |
| IL2RG | 4.46378 | 0.00314431 |
| ENSGALG00000005941 | 4.45204 | 0.00824764 |
| IRF-4 | 4.439 | 0.00314431 |
| ANG | 4.35225 | 0.00314431 |
| CYBB | 4.30937 | 0.00314431 |
| IL1R2 | 4.27765 | 0.00314431 |
| NOX1 | 4.21683 | 0.00314431 |
| K123 | 4.19358 | 0.00314431 |
| ENPP3 | 4.15996 | 0.00314431 |
| ENSGALG00000004041 | 4.11758 | 0.00314431 |
| INPPL1 | 4.02408 | 0.0365979 |
| MGAT5B | 3.99352 | 0.00314431 |
| RGS1 | 3.96458 | 0.00314431 |
| CXORF9 | 3.8988 | 0.00314431 |
TABLE 2.
Top 30 DEGs common to all time pointsa
| DEG | Log2 fold change on day p.i.: |
|||
|---|---|---|---|---|
| 1 | 3 | 5 | 7 | |
| BPI-like | 4.63326 | 5.96431 | 6.62699 | 4.99055 |
| CCL5 | 4.19982 | 5.716 | 7.14783 | 4.57728 |
| IL-8L1 | 3.24065 | 5.66709 | 6.42486 | 4.57668 |
| DUOXA1 | 2.64219 | 5.5092 | 3.67084 | 3.25108 |
| OLFM4 | 5.36158 | 5.33946 | 3.3068 | 3.02132 |
| ENPP3 | 4.47861 | 5.31691 | 4.6874 | 4.15996 |
| NOX1 | 4.88366 | 5.30958 | 4.89579 | 4.21683 |
| RARRES1 | 3.83189 | 4.95679 | 3.30349 | 2.91255 |
| LYG2 | 3.0302 | 4.8369 | 4.90495 | 2.41283 |
| CCLI10 | 2.69156 | 4.83626 | 5.21577 | 4.89954 |
| TLR4 | 4.96328 | 4.70113 | 6.11835 | 3.53102 |
| TLR15 | 4.3237 | 4.67092 | 4.92173 | 4.93934 |
| SOCS3 | 4.3124 | 4.60883 | 4.19433 | 3.76184 |
| LOC428141 | 4.33948 | 4.45456 | 4.08157 | 4.11758 |
| IL4I1 | 3.48615 | 4.41317 | 4.88468 | 2.5721 |
| MMP9 | 3.91132 | 4.38006 | 6.95883 | 4.96884 |
| IL1R2 | 4.48184 | 4.34042 | 4.09522 | 4.27765 |
| IRG1 | 3.83225 | 4.33338 | 4.58645 | 3.81257 |
| ENSGALG00000019325 | 1.44738 | 4.27359 | 2.82898 | 2.63588 |
| CALCA | 5.0309 | 4.24828 | 4.16685 | 3.16541 |
| IL-1BETA | 3.37598 | 4.14312 | 5.21417 | 2.70404 |
| IL-8L2 | 3.26202 | 3.85625 | 4.62414 | 3.81967 |
| MLKL | 3.11988 | 3.7713 | 3.86533 | 2.17199 |
| DPYSL3 | 0.982301 | 3.66839 | 3.90804 | 3.09111 |
| SLC5A11 | 3.36215 | 3.61828 | 2.95951 | 2.1136 |
| ENSGALG00000002902 | 2.30604 | 3.53979 | 4.36105 | 2.19814 |
| LY96 | 2.82024 | 3.5325 | 4.28532 | 3.65581 |
| SPP1 | 3.36144 | 3.50817 | 4.26922 | 3.19621 |
| LGALS2 | 0.928863 | 3.30387 | 3.40564 | 3.20535 |
| BPI | 3.34441 | 3.20803 | 3.7472 | 2.7993 |
Sorted by day 3 postinfection log2 fold changes as indicated by Cuffdiff.
DISCUSSION
This study examined global transcriptomic analysis of differential gene expression in chicken tracheal cells following exposure to Mycoplasma gallisepticum Rlow over a 7-day time course. In keeping with prior studies, this analysis provided copious data reaffirming the vigorous proinflammatory response mounted in the chicken trachea subsequent to M. gallisepticum infection. This response ostensibly is due to prolonged signaling through epithelial cell receptors, resulting in increased production of cytokines and chemokines paired with tissue infiltration of inflammatory cells (7, 10, 14, 15). Previous ex vivo analysis of host tracheal epithelial cells had suggested that the exaggerated influx of inflammatory cells into the respiratory lamina propria is dependent upon robust TLR2 signaling that occurs as early as 1.5 h postexposure to M. gallisepticum (10). Furthermore, in vitro exposure of tracheal epithelial cells to Rlow resulted in a rapid response with increased expression of inflammatory genes encoding CCL20, IL-8, IL-6, IL-12p40, NOS2, CXCL13, CXCL14, MIP-1β, and IL-1β within 24 h of exposure (10). Previous in vivo analysis, however, indicated that CCL20, IL-8, and IL-12p40 had decreased expression upon infection with Rlow while minimal changes were seen with IL-1β over the course of 8 days (14). The findings of the current study differed from those of earlier in vitro and in vivo studies; TLR2 was found to be increased, but not to the extent seen with TLR4 or TLR15. CCL20 (MIP-3α) showed decreased expression; however, this was found to be significant only on day 5, while differential expression of IL-12p40 (IL-12B) was observed only on day 1. IL-1β, IL-8L1, and IL-8L2 showed significantly increased expression at each time point, which differed from the findings of the previous in vivo study. Given the important proinflammatory function of IL-1β and chemotactic properties of IL-8L1 and IL-8L2, significantly increased expression was expected. Differences found among these studies are likely a reflection of the difference in experimental methodology and, hence, the cell types captured in the analysis. It should be pointed out that the sampling methods used here and postcollection analysis were quite different from those in the previous in vivo study (14). Previously, whole tracheal tissues were assessed, whereas the current study preferentially sampled cells from the tracheal lumen by pipetting TRIzol through the lumen. Based on the gene expression profiles observed in the current study, it appears that heterophils and lymphocytes were present in the samples collected; however, the extent of tissue penetration is unknown, and certain cell populations may have been excluded (e.g., cells trapped in the connective tissue of the lamina propria). However, this TRIzol method is quite relevant to the study of differential gene expression in that the recovered cells are in close contact with the pathogen.
While increased expression of TLRs may not be a direct reflection of ligand binding and subsequent signaling, it is of interest that the host response increases the sensitivity of the epithelial and immune cells involved through increased expression of receptors. TLR15, specific to avian and reptilian lineages and largely expressed on the surface of heterophils, macrophages, and fibroblasts, shares approximately 30% identity with TLR2 (16–18). It has been suggested that TLR15 is a broad-spectrum TLR that recognizes heat-stable components of both Gram-negative and -positive bacteria, CpG oligonucleotides, tripalmitoylated lipopeptide, and lipopolysaccharide (LPS) (17, 18). More recently, it has been shown to be activated in the presence of diacylated lipopeptide from Mycoplasma synoviae (19). In the current study, TLR15 had an average log2 fold change of 4.71 throughout the course of the 7-day infection and may reflect the persistent presence of M. gallisepticum (data not shown). The stable differential expression of TLR15 was greater than that observed for TLR1A and TLR2, unlike what was seen in previous in vitro work with M. gallisepticum (10). Its importance with respect to M. gallisepticum pathogenesis, however, remains uncertain. The increase in differential expression of TLR4, while partly due to increased numbers of immune cells, may also indicate increased cellular responses to extrinsic signals. Although M. gallisepticum does not contain lipopolysaccharide (LPS), the hallmark TLR4 ligand, other studies have shown TLR4 signaling due to the presence of damage-associated molecular pattern molecules (DAMPs) such as heparin sulfate, fibrinogen, fibronectin, or heat shock proteins 60 and 70 as a result of damaged extracellular matrix (ECM) or injured cells (20–23). Associated with this may be the significantly increased differential expression of matrix metalloprotease 7 (MMP7) and/or MMP9 genes found within the top 25 DEGs at every time point. On day 3, the MMP7 gene had the greatest increase in differential expression of all genes, with a log2 fold change of 9.22. In mucosal epithelium, MMP7 has been shown to play an important role in the injury response, with increased expression found in cells surrounding the site of injury (24). Research on equine chronic obstructive pulmonary disease (COPD) suggested that MMP9 serves as a marker for ongoing tissue remodeling (25). It has also been proposed that disproportionate expression of MMPs, likely a result of increased cytokine production, coupled with deficient expression levels of tissue inhibitors of metalloproteinases (TIMPs), results in excess ECM degradation (20, 26, 27). Components of the ECM may then ligate TLR4 and result in signaling through MyD88 (16, 20–22). In addition, increased expression of TLR4 may provide greater accessibility of endogenous Gram-negative bacteria to this receptor. Ligation of TLR4 and TLR15 and subsequent increase of proinflammatory cytokines may contribute to and perpetuate the exaggerated and dysregulated host immune response.
Significant differential expression of many cytokine and chemokine receptors was also observed over the course of infection. For example, on day 3, the peak of infection as indicated by gross and histological analyses (data not shown) and the point at which the highest number of DEGs was observed, the number of cytokine/chemokine receptor genes found to be differentially expressed outnumbered the cytokine genes by a 4-to-1 ratio. This indicates that M. gallisepticum infection results in increased cell sensitivity to inflammatory agonists by virtue of upregulating receptors for signaling molecules not present on mycoplasmas.
Pathway analysis showed that the greatest change in proportion of pathway categories occurred in those with metabolic function, with the number of immune-related pathways remaining constant. However, further analysis for GO revealed that the majority of DEGs with a log2 fold change of ≥2.00 were related to pathogen recognition and the subsequent host immune response. A recent study assessing the changes in microRNA (miRNA) due to M. gallisepticum strain HS in the lung identified numerous miRNAs with gene targets found in immune pathways. These included, but were not limited to, genes found within the MAPK, TLR, and Jak-STAT pathways (28). While the RNA-Seq data presented cannot explicitly show gene regulation changes in individual cells, analysis of miRNAs and their targets further supports the differential expression seen in the tracheal host response presented here.
Collectively, the differential gene expression data observed in this study further revealed the complexity of the host response to M. gallisepticum, especially at early time points. It is easy to envisage how the myriad differentially expressed inflammatory, signaling, and immune response genes could result in a profoundly dysregulated host response. Numerous genes were found to have significant differential expression over the course of infection, and while there were significantly fewer DEGs observed on days 5 and 7 postinfection, many proinflammatory genes maintained their expression throughout the time course. Both pathogen-associated molecular patterns (PAMPs) and DAMPs likely contributed to the ligation of receptors that may not have been activated based solely on the components of M. gallisepticum and subsequent downstream signaling. The presence of PAMPs and DAMPs, coupled with the increased expression of PRRs and cytokine receptors, may underpin the robust host response that results in the recruitment and activation of inflammatory/immunoregulatory cells, thereby establishing an ecological niche favoring pathogen persistence. As previously mentioned, various immune cells are recruited into the lamina propria during the course of M. gallisepticum infection. While the changing cell populations may also contribute to differences in expression observed here, it does not mitigate the potential importance of these changes in the local host response.
This study has provided global assessment of the chicken tracheal response to M. gallisepticum over the course of early infection and further elucidated the complex response contributing to the early development of CRD. A better understanding of these molecular events is critical to identifying those which lead to a maladaptive rather than beneficial host response and may be important in the development of future therapeutics and vaccines.
MATERIALS AND METHODS
Animals.
Four-week-old female specific-pathogen-free White Leghorn chickens (SPAFAS, North Franklin, CT, USA) were received and divided randomly into groups, placed in HEPA-filtered avian isolators, and allowed to acclimate for 1 week. Nonmedicated feed and water were provided ad libitum throughout the experiment. All components of the study were performed in accordance with approved UConn IACUC protocol number A13-001.
Chicken infection.
Stocks of M. gallisepticum strain Rlow (passage 17) were grown in Hayflick's complete medium overnight at 37°C until mid-log phase was reached, as indicated by a color shift from red to orange. Bacterial concentrations were determined by the optical density at 620 nm (OD620), and 10-fold serial dilutions were conducted to confirm viable color-changing unit titers. Bacteria were pelleted by centrifugation at 10,000 × g for 10 min and resuspended at 5 × 10⁸ CFU/ml in Hayflick's complete medium. Chickens were challenged by pipetting 1 × 10⁸ CFU/200 μl (infected animals) or 200 μl of Hayflick's medium alone (control animals) into the tracheal lumen as previously described (29).
RNA extraction.
Five infected and five control chickens were humanely sacrificed each day for seven consecutive days. Tracheas were excised, and total RNA was collected by pipetting 1 ml TRIzol reagent four times through the lumen of each individual trachea (30) to minimize the changes in gene expression that may occur during the time between specimen collection and RNA purification (Invitrogen, Carlsbad, CA, USA). Total RNA was then purified using the Zymo Direct-zol RNA miniprep kit according to the manufacturer's instructions (Zymo Research Corporation, Irvine, CA, USA).
Illumina sequencing.
cDNA libraries were created from RNA isolated from individual chickens on days 1, 3, 5, and 7 postinfection using the Illumina TruSeq stranded mRNA library preparation kit (Illumina Inc., San Diego, CA, USA) according to the Illumina TruSeq RNA sample preparation v2 (HT) protocol. Briefly, poly(A) selection was performed using RNA purification beads on 0.1 to 4 μg of total RNA per sample to obtain mRNA. Ten to 400 ng of purified mRNA was fragmented and used to synthesize first-strand cDNA using reverse transcriptase and random hexamer primers. Second-strand cDNA synthesis was performed using deoxynucleoside triphosphates (dNTPs), including dUTP, DNA polymerase, and RNase. End repair was performed by adding dATP to all free 3′ ends, and adaptor ligation added unique index sequences to the fragments. The products were then amplified by PCR and purified.
The cDNA libraries were quantified using a Qubit 2.0 fluorometer (Invitrogen) and assessed for correct fragment size (∼260 bp) using the Agilent TapeStation 2200 (Agilent Technologies). Libraries were normalized to 2 nM, pooled, denatured, and sequenced on the NextSeq500 sequencing platform (Illumina Inc.) using a 75-bp paired-end approach targeting approximately 10 million reads per sample.
RNA-Seq analysis.
Fastq data from individual birds were mapped using the TopHat package (version 2.0.1) utilizing the Bowtie2 engine (version 2.2.5) to align reads to the Gallus gallus reference genome (WASHUC2), producing BAM alignment files (31). BAM files for each day were processed as experimental condition groups with Cufflinks (version 2.2.1) to assess aligned reads against reference transcripts using Cuffdiff to calculate treatment group-specific expression values and statistical significance of between-group differential expression. Within-condition normalization of data using Cuffdiff was achieved by calculating the fragments per kilobase of exon per million fragments mapped (FPKM) for each gene. The generated P value was then used to determine the significance of the differential expression based on the Benjamini-Hochberg correction with a false discovery rate (FDR) of <5% to generate the q value. Between-condition differences in expression values were considered significant at a q value of ≤0.05, thus addressing within-condition variation for all biological replicates on each day. Fold change was determined from the log2 transformation of the ratio of FPKM between conditions (31, 32). For this study, all references to DEGs implies statistical significance.
Pathway analysis.
Identification of biological pathways that significant DEGs were involved in was performed using DAVID (Database for Annotation, Visualization, and Integrated Discovery), version 6.7 (33). Pathways containing ≥2 significant DEGs were categorized and displayed.
Functional gene ontology.
DEGs with a log2 fold change of ≥2.00, as identified by Cuffdiff, were analyzed to identify enriched biological processes based on GO. This was performed using ClueGO v2.3.2, a plugin of the software platform Cytoscape v3.5.0-RC1 (34). Processes that had a P value of ≤0.05 for each time point were considered significant and are displayed.
Accession number(s).
The data discussed in this publication have been deposited in NCBI's Gene Expression Omnibus and are accessible through GEO Series accession number GSE101403.
ACKNOWLEDGMENTS
We thank Kathryn Korhonen and Kara Rogers for assistance with the animal study and Kirklyn Kerr for assistance with necropsy. We also thank the Center of Excellence for Vaccine Research and the U.S. Department of Agriculture for support.
REFERENCES
- 1.Ley DH. 2003. Mycoplasma gallisepticum infection, p 722–744. In Calnek BW, Barnes HJ, Beard CW, McDougald LR, Saif YM (ed), Diseases of poultry, 11th ed Iowa State University Press, Ames, IA. [Google Scholar]
- 2.Levisohn S, Kleven SH. 2000. Avian mycoplasmosis (Mycoplasma gallisepticum). Rev Sci Tech 19:425–444. doi: 10.20506/rst.19.2.1232. [DOI] [PubMed] [Google Scholar]
- 3.Evan JD, Leigh SA, Branton SL, Collier SD, Pharr GT, Bearson SMD. 2005. Mycoplasma gallisepticum: current and developing means to control the avian pathogen. J Appl Poult Res 14:757–763. doi: 10.1093/japr/14.4.757. [DOI] [Google Scholar]
- 4.Dhondt AA, DeCoste JC, Ley DH, Hochachk WM. 2014. Diverse wild bird host range of Mycoplasma gallisepticum in eastern North America. PLoS One 9:e103553. doi: 10.1371/journal.pone.0103553. [DOI] [PMC free article] [PubMed] [Google Scholar]
- 5.Gaunson JE, Philip CJ, Whithear KG, Browning GF. 2000. Lymphocytic infiltration in the chicken trachea in response to Mycoplasma gallisepticum infection. Microbiology 146:1223–1299. doi: 10.1099/00221287-146-5-1223. [DOI] [PubMed] [Google Scholar]
- 6.Lam KM. 2004. Mycoplasma gallisepticum-induced alterations in cytokine genes in chicken cells and embryos. Avian Dis 48:215–219. doi: 10.1637/7081. [DOI] [PubMed] [Google Scholar]
- 7.Gaunson JE, Philip CJ, Whithear KG, Browning GF. 2006. The cellular immune response in the tracheal mucosa to Mycoplasma gallisepticum in vaccinated and unvaccinated chickens in the acute and chronic stages of disease. Vaccine 24:2627–2633. doi: 10.1016/j.vaccine.2005.12.008. [DOI] [PubMed] [Google Scholar]
- 8.Gomez MI, Prince A. 2008. Airway epithelial cell signaling in response to bacterial pathogens. Pediatr Pulmonol 43:11–19. doi: 10.1002/ppul.20735. [DOI] [PubMed] [Google Scholar]
- 9.Javed MA, Frasca S Jr, Rood SD, Cecchini K, Gladd M, Geary SJ, Silbart LK. 2005. Correlates of immune protection in chickens vaccinated with Mycoplasma gallisepticum strain GT5 following challenge with pathogenic M. gallisepticum strain Rlow. Infect Immun 73:5410–5419. doi: 10.1128/IAI.73.9.5410-5419.2005. [DOI] [PMC free article] [PubMed] [Google Scholar]
- 10.Majumder S, Zappulla F, Silbart LK. 2014. Mycoplasma gallisepticum lipid associated membrane proteins up-regulate inflammatory genes in chicken tracheal epithelial cells via TLR-2 ligation through an NF-κβ dependent pathway. PLoS One 9:e112796. doi: 10.1371/journal.pone.0112796. [DOI] [PMC free article] [PubMed] [Google Scholar]
- 11.Papazisi L, Frasca S Jr, Gladd SM, Liao X, Yogev D, Geary SJ. 2002. GapA and CrmA coexpression is essential for Mycoplasma gallisepticum cytadherence and virulence. Infect Immun 70:6839–6845. doi: 10.1128/IAI.70.12.6839-6845.2002. [DOI] [PMC free article] [PubMed] [Google Scholar]
- 12.Papazisi L, Troy KE, Gorton TS, Liao X, Geary SJ. 2000. Analysis of cytadherence-deficient, GapA-negative Mycoplasma gallisepticum strain R. Infect Immun 68:6643–6649. doi: 10.1128/IAI.68.12.6643-6649.2000. [DOI] [PMC free article] [PubMed] [Google Scholar]
- 13.Mudahi-Orenstein S, Levisohn S, Geary SJ, Yogev D. 2003. Cytadherence-deficient mutants of Mycoplasma gallisepticum generated by transposon mutagenesis. Infect Immun 71:3812–3820. doi: 10.1128/IAI.71.7.3812-3820.2003. [DOI] [PMC free article] [PubMed] [Google Scholar]
- 14.Mohammed J, Frasca S Jr, Cecchini SK, Rood D, Nyaoke AC, Geary SJ, Silbart LK. 2007. Chemokine and cytokine gene expression profiles in chickens inoculated with Mycoplasma gallisepticum strains Rlow or GT5. Vaccine 25:8611–8621. doi: 10.1016/j.vaccine.2007.09.057. [DOI] [PubMed] [Google Scholar]
- 15.Majumder S, Silbart LK. 2015. Interaction of Mycoplasma gallisepticum with chicken tracheal epithelial cells contributes to macrophage chemotaxis and activation. Infect Immun 84:266–274. doi: 10.1128/IAI.01113-15. [DOI] [PMC free article] [PubMed] [Google Scholar]
- 16.Keestra AM, de Zoete MR, Bouwman LI, Vaezirad MM, van Putten J. 2013. Unique features of chicken Toll-like receptors. Dev Comp Immunol 41:316–323. doi: 10.1016/j.dci.2013.04.009. [DOI] [PubMed] [Google Scholar]
- 17.Nerren J, He H, Genovese K, Kogut M. 2010. Expression of the avian-specific Toll-like receptor 15 in chicken heterophils is mediated by gram-negative and Gram-positive bacteria, but not TLR agonists. Vet Immunol Immunopathol 136:151–156. doi: 10.1016/j.vetimm.2010.02.017. [DOI] [PubMed] [Google Scholar]
- 18.Boyd AC, Peroval MY, Hammond JA, Prickett MD, Young JR, Smith AL. 2012. TLR15 is unique to avian and reptilian lineages and recognizes a yeast-derived agonist. J Immunol 189:4930–4938. doi: 10.4049/jimmunol.1101790. [DOI] [PubMed] [Google Scholar]
- 19.Oven I, Rus KR, Dusanic D, Bencina D, Keeler CL, Narat M. 2013. Diacylated lipopeptide from Mycoplasma synoviae mediates TLR15 induced innate immune responses. Vet Res 44:99. doi: 10.1186/1297-9716-44-99. [DOI] [PMC free article] [PubMed] [Google Scholar]
- 20.Ospelt C, Gay S. 2010. TLRs and chronic inflammation. Int J Biochem Cell Biol 42:495–505. doi: 10.1016/j.biocel.2009.10.010. [DOI] [PubMed] [Google Scholar]
- 21.Erridge C. 2010. Endogenous ligands of TLR2 and TLR4: agonists or assistants? J Leukoc Biol 87:989–999. doi: 10.1189/jlb.1209775. [DOI] [PubMed] [Google Scholar]
- 22.Kelsh RM, McKeown-Longo PJ. 2013. Topographical changes in extracellular matrix: activation of TLR4 signaling and solid tumor progression. Trends Cancer Res 9:1–13. [PMC free article] [PubMed] [Google Scholar]
- 23.Smiley ST, King JA, Hancock WW. 2001. Fibrinogen stimulates macrophages chemokine secretion through Toll-like receptor 4. J Immunol 167:2887–2894. doi: 10.4049/jimmunol.167.5.2887. [DOI] [PubMed] [Google Scholar]
- 24.Gharib SA, Altermeier WA, Van Winkle LS, Plopper CG, Schlesinger SY, Buell CA, Brauer R, Lee V, Parks WC, Chen P. 2013. Matrix metalloproteinase-7 coordinates airway epithelial injury response and differentiation of ciliated cells. Am J Respir Cell Mol Biol 48:390–396. doi: 10.1165/rcmb.2012-0083OC. [DOI] [PMC free article] [PubMed] [Google Scholar]
- 25.Raulo SM, Sorsa T, Tervahartiala T, Pirila E, Maisi P. 2001. MMP-9 as a marker of inflammation in tracheal epithelial lining fluid (TELF) and in bronchoalveolar fluid (BALF) of COPD horses. Equine Vet J 33:128–136. doi: 10.1111/j.2042-3306.2001.tb05375.x. [DOI] [PubMed] [Google Scholar]
- 26.Elkington PTG, Friedland JS. 2006. Matrix metalloproteinases in destructive pulmonary pathology. Thorax 61:259–256. doi: 10.1136/thx.2005.051979. [DOI] [PMC free article] [PubMed] [Google Scholar]
- 27.Visse R, Nagase H. 2003. Matrix metalloproteinases and tissue inhibitors of metalloproteinases and tissue inhibitors of metalloproteinases. Circ Res 92:827–839. doi: 10.1161/01.RES.0000070112.80711.3D. [DOI] [PubMed] [Google Scholar]
- 28.Zhao Y, Hou Y, Zhang K, Yuan B, Peng X. 2017. Identification of differentially expressed miRNA through high-throughput sequencing in the chicken lung in response to Mycoplasma gallisepticum HS. Comp Biochem Physiol Part D Genomics Proteomics 22:146–156. doi: 10.1016/j.cbd.2017.04.004. [DOI] [PubMed] [Google Scholar]
- 29.Lin MY, Kleven SH. 1982. Cross-immunity and antigenic relationships among five strains of Mycoplasma gallisepticum in young leghorn chickens. Avian Dis 26:496–507. doi: 10.2307/1589895. [DOI] [PubMed] [Google Scholar]
- 30.Pflaum K, Tulman ER, Beaudet J, Liao X, Geary SJ. 2015. Global changes in Mycoplasma gallisepticum phase-variable lipoprotein gene (vlhA) expression during in vivo infection of the natural chicken host. Infect Immun 84:351–355. doi: 10.1128/IAI.01092-15. [DOI] [PMC free article] [PubMed] [Google Scholar]
- 31.Trapnell C, Roberts A, Goff L, Pertea G, Kim D, Kelley D, Pimentel H, Salzberg SL, Rinn JL, Pachter L. 2012. Differential gene and transcript expression analysis of RNA-seq experiments with TopHat and Cufflinks. Nat Protoc 7:562–578. doi: 10.1038/nprot.2012.016. [DOI] [PMC free article] [PubMed] [Google Scholar]
- 32.Das A, Chai JC, Kim SH, Park KS, Lee YS, Jung KH, Chai YG. 2015. Dual RNA sequencing reveals the expression of unique transcriptomic signatures in lipopolysaccharides-induced BV-2 microglial cells. PLoS One 10:e0121117. doi: 10.1371/journal.pone.0121117. [DOI] [PMC free article] [PubMed] [Google Scholar]
- 33.Huang DW, Sherman BT, Lempicki RA. 2009. Systematic and integrative analysis of large gene lists using DAVID bioinformatics resources. Nat Protoc 4:44–58. doi: 10.1038/nprot.2008.211. [DOI] [PubMed] [Google Scholar]
- 34.Bindea G, Mlecnik B, Hackl H, Charoentong P, Tosolini M, Kirilovsky A, Fridman W, Pages F, Trajanoski Z, Galon J. 2009. ClueGO: a Cytoscape plug-in to decipher functionally grouped gene ontology and pathway annotation networks. Bioinformatics 25:1091–1093. doi: 10.1093/bioinformatics/btp101. [DOI] [PMC free article] [PubMed] [Google Scholar]


