

Abstract
During non-rapid eye-movement (NREM) sleep, cortical and thalamic neurons oscillate every second or so between ON periods, characterized by membrane depolarization and wake-like tonic firing, and OFF periods, characterized by membrane hyperpolarization and neuronal silence. Cortical slow waves, the hallmark of NREM sleep, reflect near-synchronous OFF periods in cortical neurons. However, the mechanisms triggering such OFF periods are unclear, as there is little evidence for somatic inhibition. We studied cortical inhibitory interneurons that express somatostatin (SOM), because ∼70% of them are Martinotti cells that target diffusely layer I and can block excitatory transmission presynaptically, at glutamatergic terminals, and postsynaptically, at apical dendrites, without inhibiting the soma. In freely moving male mice, we show that SOM+ cells can fire immediately before slow waves and their optogenetic stimulation during ON periods of NREM sleep triggers long OFF periods. Next, we show that chemogenetic activation of SOM+ cells increases slow-wave activity (SWA), slope of individual slow waves, and NREM sleep duration; whereas their chemogenetic inhibition decreases SWA and slow-wave incidence without changing time spent in NREM sleep. By contrast, activation of parvalbumin+ (PV+) cells, the most numerous population of cortical inhibitory neurons, greatly decreases SWA and cortical firing, triggers short OFF periods in NREM sleep, and increases NREM sleep duration. Thus SOM+ cells, but not PV+ cells, are involved in the generation of sleep slow waves. Whether Martinotti cells are solely responsible for this effect, or are complemented by other classes of inhibitory neurons, remains to be investigated.
SIGNIFICANCE STATEMENT Cortical slow waves are a defining feature of non-rapid eye-movement (NREM) sleep and are thought to be important for many of its restorative benefits. Yet, the mechanism by which cortical neurons abruptly and synchronously cease firing, the neuronal basis of the slow wave, remains unknown. Using chemogenetic and optogenetic approaches, we provide the first evidence that links a specific class of inhibitory interneurons—somatostatin-positive cells—to the generation of slow waves during NREM sleep in freely moving mice.
Keywords: chemogenetic, cortex, mouse, optogenetic
Introduction
Non-rapid eye-movement (NREM) sleep is characterized by spindles and slow waves. While the mechanisms responsible for the generation of spindles are well characterized (Steriade, 2000), those underlying slow waves remain unclear (Neske et al., 2015). Slow waves are generated in the cerebral cortex even when isolated from thalamic input (Steriade, 2000), although the thalamus is important for their full expression (Crunelli et al., 2015). Every second or so during NREM sleep, when the EEG records the occurrence of slow waves, cortical cells undergo a sharp hyperpolarization of the membrane potential lasting for tens to hundreds of milliseconds (down state), during which neurons are silent (OFF period). This is followed by a return to a tonic depolarization (up state) often accompanied by neuronal firing (ON period). The near-synchronous occurrence of down states in large sectors of the cortex is detected in the EEG as the negative peak that typifies each slow wave. It was suggested that the OFF periods that characterize NREM sleep may occur, upon a background of increased potassium leak currents, through a passive “disfacilitation” associated with reduced synaptic input (Steriade, 2000). However, it is not clear what would trigger a decrease in synaptic input in the first place. Moreover, it is difficult to explain why the occurrence of OFF periods is remarkably sharp and synchronous across large populations of neurons (Volgushev et al., 2006). Finally, if reduced activity were the primary trigger of slow waves, it would be hard to explain why they can be induced reliably by electrical (Vyazovskiy et al., 2009a) or transcranial magnetic stimulation (Massimini et al., 2007). An alternative possibility is that down states may be induced by active inhibition (Craig et al., 2013; Lemieux et al., 2015). However, except for a small fraction of pyramidal neurons (Lemieux et al., 2015), intracellular recordings in the cell body of pyramidal cells are consistent with disfacilitation rather than with direct inhibition (Steriade, 2000), and there is currently no causal evidence for the involvement of specific inhibitory cell types in the generation of slow waves.
We reasoned that a prominent class of cortical inhibitory interneurons that express somatostatin (SOM)—Martinotti cells—have several features that could explain the synchronous induction of OFF periods and associated slow waves in the absence of somatic inhibition. First, Martinotti cells are found throughout the cortex and their defining anatomical feature is an extensive network of ascending axonal collaterals that especially target layer 1 (L1; Wang et al., 2004), the site of termination of many corticocortical connections, particularly back connections, and of diffusely projecting thalamocortical projections from matrix cells (Cauller, 1995; Markov et al., 2014). In L1, SOM+ cells powerfully inhibit excitatory transmission among pyramidal cells (Urban-Ciecko et al., 2015) through synaptic spillover over presynaptic GABAB receptors on glutamatergic terminals, which could explain the profound disfacilitation at the cell body despite little evidence for inhibitory currents (Steriade, 2000). Moreover, in L1, SOM+ cells inhibit distal dendrites of pyramidal cells (Silberberg and Markram, 2007) through GABAA (Chiu et al., 2013) and likely GABAB receptors (Wang et al., 2010; Craig and McBain, 2014). Martinotti cells have high density of connections and convergence onto pyramidal cells, regardless of specific subnetworks, and can thus provide indiscriminate pyramidal inhibition (Fino and Yuste, 2011; Lee and Huguenard, 2011). Furthermore, SOM+ cells are activated by strong synchronous firing of pyramidal cells (Kapfer et al., 2007; Fanselow et al., 2008) through progressively facilitating synapses (Silberberg and Markram, 2007; Fanselow and Connors, 2010). When many SOM+ cells are activated together, they act as “master regulators,” inhibiting all other cell types but themselves (Jiang et al., 2015), in line with the observations that OFF periods are found across cell types (Steriade, 2000). SOM+ cells tend to fire more strongly late during the up state, and have been implicated in the termination of the up state in computer simulations (Krishnamurthy et al., 2012) and in vitro (Fanselow and Connors, 2010), possibly by activating GABAB receptors (Wang et al., 2004; Craig and McBain, 2014). Finally, Martinotti cells have uniquely broad and complex axonal arborizations (Wang et al., 2004), which could account for the broad synchrony of sleep slow waves (Steriade, 2000), and they form an electrical syncytium through gap junctions (Ma et al., 2006; Fanselow et al., 2008), which could favor the spread of slow waves in the cortex and possibly account for their traveling nature (Massimini et al., 2004). Consistent with this hypothesis, we establish here an important role for SOM+ cells in the generation of sleep slow waves.
Materials and Methods
Animals
Adult (≥9 weeks old; body weight, 23–32 g) male mice, all from Jackson Laboratory, were used, including transgenic lines SOM-Cre [B6N.Cg-Ssttm2.1(cre)Zjh/J (Stock #018973, RRID:IMSR_JAX:018973)] and parvalbumin (PV)-Cre (B6;129P2-Pvalbtm1(cre)Arbr/J (#008069, RRID:IMSR_JAX:008069) and B6.Cg-Gt(ROSA)26Sortm14(CAG-tdTomato)Hze/J (#007914, RRID:IMSR_JAX:007914)], and C57BL/6 wild-type mice. All animal surgical procedures were performed according to the National Institutes of Health Guide for the Care and Use of Laboratory Animals. Facilities were reviewed and approved by the Institutional Animal Care and Use Committee of the University of Wisconsin–Madison, and were inspected and accredited by the Association for Assessment and Accreditation of Laboratory Animal Care. Sample size was based on past experience and pilot experiments.
Virus injection
Under isoflurane anesthesia (2% induction; 1–1.5% maintenance) SOM-Cre or PV-Cre mice were fitted to a stereotactic frame. Using sterile technique, a midline incision was made to expose the skull. After cleaning with saline and hydrogen peroxide, a small burr hole was made in the skull using a dental drill. Either one or four craniotomies were performed, depending on the injection strategy. For tracing experiments, AAV1.CAG.Flex.eGFP.WPRE.bGH (1.79 × 10¹³ GC/ml) was injected in frontal cortex (n = 3 SOM-Cre; n = 3 PV-Cre; +1.60 mm anterior to bregma, +0.70 mm lateral to midline) using iontophoresis (Harris et al., 2012). For all other injections, a cannula-based approach was used, at a rate of 0.15 μl/min, with a total of 2 μl delivered. For chemogenetic experiments, frontal (1.60 mm anterior to bregma, ±0.70 mm lateral to midline) and parietal (−2.1 mm from bregma, ±1.5 mm from midline) regions were bilaterally injected with 2 μl of AAV8-hSyn-DIO-hM3D(Gq)-mCherry, or with AAV8-hSyn-DIO-hM4D(Gi)-mCherry (University of North Carolina, UNC Vector Core, RRID:SCR_002448; based on previous work by Dr. Bryan Roth). For optogenetic experiments, mice were injected with C1V1 [AAV5-EF1a-DIO-C1V1(E122T/E162T)-TS-EYFP; UNC Vector Core; under an agreement with Dr. Karl Deisseroth] in one frontal site. Five minutes after the injection, the cannula was removed, and a custom-fashioned dental cement flap was secured above the craniotomy to protect the cortex. Then mice were sutured and anesthesia was terminated. Mice were monitored daily for 7 d following surgery to ensure normal recovery. We estimated the extent of the virus expression and the colocalization with SOM expression in six animals, four for M3 and two for M4, and we got consistent results: 69–70% of infected cells express SOM, and almost all SOM+ cells (94–95%) express either the M3 or the M4 virus. In a subset of mice, coronal sections spanning the frontal (from +1.94 to +1.18 mm anteroposterior) and parietal (from −1.34 to −2.20 mm anteroposterior) regions were taken from seven mice and the cells expressing either hM3Dq+ (four mice) or hM4Dq+ (three mice) and SOM (polyclonal rabbit anti-somatostatin; 1:250; Santa Cruz Biotechnology, RRID:AB_2195930) were counted. In each section, 512 × 512 pixel images were acquired in the left and right cortices with a confocal microscope (Olympus BX61W1; 40×) using the red and green channels. mCherry+ cells and SOM+ cells were counted independently in each channel and then compared to assess the degree of colabeling. On average ∼70% of hM3Dq+ or hM4Dq+ cells were also SOM+ (61 to 80% in different mice) and almost all (94–95%) SOM+ cells also expressed hM3Dq+ or hM4Dq+.
Electrode implant
At least 2 weeks after adeno-associated virus (AAV) injection, mice were anesthetized with isoflurane (2% induction; 1–1.5% maintenance) and implanted with electrodes to assess brain and muscular activity. The EEG was recorded by fixing gold screws in burr holes (0.7 mm) above the frontal and/or parietal cortex, with a screw above the cerebellum serving as reference (Fig. 1B). Anchor screws were also placed above the cerebellum and olfactory bulbs. Craniotomies were performed at target cortical areas, ensuring that the dura remained intact, followed by insertion of laminar silicon probes (NeuroNexus, A1x16; 50 or 100 μm site spacing) perpendicular to the target cortical regions. In areas previously injected with AAV, probes were placed slightly caudal to the injection site (but still well within the viral expression area) to avoid recording near the injection cannula track. The dorsoventral dimension was adjusted during surgery to ensure that the top contact was placed at the surface of the cortex (100 μm spaced probes) or just below the brain surface (50 μm spaced probes). In mice injected with C1V1, a custom-fabricated optrode consisting of a fiber optic ferrule (Doric Lenses) cemented to a NeuroNexus A1x16 probe was implanted in the secondary motor cortex (M2) such that the optic ferrule rested on the surface of the cortex. A second NeuroNexus probe was inserted nearby. To help us verify probe location using histological techniques later on, the back of each was covered with a thin layer of DiI fluorescent dye [DiIC18(3), Invitrogen]. Two-component silicon (QuikSil) was applied to craniotomy and probe, followed by dental acrylic (Fusio) to secure the array. To record muscle activity, a pair of custom-made electromyogram (EMG) cables was inserted bilaterally into the dorsal neck musculature and in the vibrissal musculature.
Figure 1.

Projections of cortical SOM+ cells and experimental design. A, Long-range cortical projections shown in sagittal and coronal sections from a representative SOM-Cre mouse injected with AAV1.CAG.Flex.eGFP.WPRE.bGH. Dense innervation in L1 is shown at higher magnification (bottom right). D, Dorsal; V, ventral; A, anterior; P, posterior; M, medial; L, lateral. B, Placement of the electrodes, schematic of the injection sites, and timeline. Red and green dots on the skull mark the injection site of the AAV constructs, which contained the fluorescent protein mCherry (red, chemogenetics) or EYFP (green, optogenetics); yellow screws and blue dots indicate the position of the EEG electrodes and LFP probes (M2), respectively. Continuous recordings lasted for several days and included baseline, sleep deprivation with novel objects (gray bar), and opto/chemogenetics experiments at different times of the light/dark cycle.
Chronic sleep recordings and sleep deprivation
Single implanted mice were housed in transparent Plexiglas cages (36.5 × 25 × 46 cm) for the duration of the experiment (12 h light/dark cycle; light on at 8:00 A.M.; 23 ± 1°C; food and water available ad libitum and replaced daily at 8:00 A.M.). After ≥1 week of recovery from surgery, chronic 24 h recordings started at the beginning of the light phase. Data acquisition was performed with the Multichannel Neurophysiology Recording and Stimulation System (Tucker-Davis Technologies, RRID:SCR_006495), with spike data being accumulated continuously across the 24 h cycle. local field potentials (LFPs; 256 Hz, 0.1–100 Hz), multiunit activity (MUA; 25 kHz, 300–5000 Hz), surface EEGs (256 Hz, 0.1–100 Hz), and EMGs (256, 10–100 Hz) were acquired using a PZ amplifier and RZ2 system (Tucker-Davis Technologies, RRID:SCR_006495). Voltage thresholds were determined by visual inspection. Both time stamps and waveforms (46 perithreshold crossing samples) were attained for each suprathreshold event. Sleep deprivation was performed using novel objects and bedding changes during the first 6 h of the light phase. Since the procedure can be stressful in naive animals, mice were familiarized with the method by placing a new object in the cage every day for several days before the sleep deprivation experiment. During sleep deprivation, mice were given a new object or bedding every time they were inactive and slow waves became evident on real-time EEG monitoring. Mice were never disturbed when they were spontaneously awake, feeding, or drinking.
Chemogenetic and optogenetic experiments
For chemogenetic activation experiments, mice were injected with clozapine-N-oxide (CNO; 5 mg/kg, i.p.) either at the start of the dark phase (8:00 P.M.) or 6 h after light onset (2:00 P.M.). All mice that received CNO during the day were also subjected to 6 h of sleep deprivation, to directly compare the effects of sleep loss with those of CNO stimulation. Baseline, sleep deprivation, and the CNO experiment occurred in the same order and in 3 consecutive days to increase the chance of recording from the same units. Sleep deprivation always preceded the CNO experiment because in our experience the recovery from 6 h of sleep loss is completed within the first 24 h cycle, while we could not rule out residual effect of CNO the next day. Indeed, when we compared the first 5 h of the light period during baseline with the first 5 h of the day following sleep deprivation—that is, before CNO was administered—we found no difference in percentage of wake, NREM sleep, and REM sleep, number and duration of wake and sleep bouts, and slow-wave activity (SWA) during NREM sleep. For chemogenetic inhibition experiments, mice were injected with CNO (10 mg/kg, i.p.) at the start of the light phase (8:00 A.M.), when sleep pressure and SWA reach the highest levels (Borbély et al., 2016). A high concentration of CNO (10 mg/kg) was used, in line with previous studies that used hM4Di to decrease neuronal activity (Wess et al., 2013), and specifically to inhibit SOM+ cells (Li et al., 2013; Hamm and Yuste, 2016). To control for possible sedative effects of CNO alone, due to back metabolism to clozapine (Urban and Roth, 2015), mice injected in M2 with a non-hM3Dq AAV (DIO-C1V1 or DIO-mCherry) were given CNO at the same dose (5 mg/kg, i.p.) and time of day (6 h after light onset) as the SOM-Cre hM3Dq+ mice, and mice injected in M2 with a non-hM4Di AAV (DIO-C1V1) were given CNO at the same dose (10 mg/kg, i.p.) and time of day (light onset) as the SOM-Cre hM4Di+ mice. For optogenetic experiments, yellow light pulses (594 nm, 10 mW, 20 or 50 ms on, 2980 or 2950 ms off) were delivered in M2 ≥2 h after the start of the light phase, to avoid the period of the day with the highest sleep pressure. For tagging experiments, pulses (20 ms) were delivered at the start or at the end of the light phase. Experimenters were not blinded to mouse genotype or experimental condition.
Sleep scoring
Signals were loaded with a custom Matlab script and subsequently processed into European Data Format (EDF). EEG, LFP, and EMG activity were analyzed off-line by visual inspection of 4 s epochs using a graphic interface (SleepSign, Kissei Comtec), where all signals are displayed simultaneously to determine behavioral state. Sleep/wake scoring was done according to standard criteria and vigilance state could always be determined. Wake was characterized by low-amplitude, high-frequency EEG/LFP activity and high EMG content. NREM sleep was characterized by high-amplitude, low-frequency EEG/LFP activity and low EMG activity. In REM sleep EEG/LFP activity was similar to that of wake, but accompanied by strong θ (6–9 Hz) in EEG/LFP channels and occasional high whisker EMG activity. For some analyses, wake epochs were further divided into active and quiet wake based on EMG content. We looked at EMG activity in the top 33rd percentile (active wake) or bottom 33rd percentile (quiet wake) of all wake EMG activity for the entire 24 h baseline.
Electrophysiological data analysis, slow-wave analysis, and spike sorting
Most analyses were performed using custom Matlab scripts. For experiments in which CNO was given at 2:00 P.M., the first sleep episode after 2:00 P.M. was identified and each 1 h bin was locked to this time point. The 1 h bins between “lights on” and 2:00 P.M. were locked to the first sleep episode at the start of the light period. All statistical analyses were performed using data in 1 h bins, including percentage time spent in sleep or wake, number, and duration of sleep and wake bouts. When the linear mixed effect (LME) models found a significant condition (group) by day interaction, post hoc tests were run to isolate the main effect of CNO (averaged across all hours; 7–11 for 2:00 P.M. experiments; 1–6 for 8:00 A.M. experiments), as detailed below (see description of LME models). In some cases, the CNO models identified other significant effects (e.g., a main effect of time, or an time by day interaction), which are not reported here because it is outside the main focus of the study. Spectral analysis was performed using a fast Fourier transform in 4 s epochs using FieldTrip scripts (Oostenveld et al., 2011). For all LFP spectrograms, LFPs from layer 5 were used. EEG signals contaminated by constant artifact were excluded. For analysis of spectral activity within a specific frequency band, including SWA, all data were normalized to the mean power in that band for each behavioral state during the entire baseline light period (12 h). Only consolidated bouts of wake (>1 min), NREM sleep (>1 min), and REM sleep (>40s) were used for this analysis to avoid transitional or ambiguous states.
For analysis of individual slow-wave parameters and MUA locked to slow waves, the LFP was bandpass filtered from 0.5 to 4 Hz and slow waves were defined as positive peaks between two zero crossings, as in previous studies (Vyazovskiy et al., 2007, 2009b). Only consolidated NREM-sleep episodes (>1 min) were used. In all analyses, the slow-wave amplitude for the 75th percentile of all slow waves detected during the baseline light phase was used as a cutoff for that recording and subsequent sleep deprivation or chemogenetic activation/inactivation blocks. MUA was locked to the zero crossing for each slow wave, since this closely approximates the onset of the OFF period.
For analysis of MUA locked to slow waves, MUA from −1 to +1 s, relative to the slow-wave zero crossing, was isolated. Firing rate for this period was normalized to the baseline firing rate, defined as −1 to −0.5 s before the peak of the slow wave. For optogenetic experiments, pulses delivered during each behavioral state were identified and analyzed separately. For each pulse, MUA from −1 to +1 s after the pulse was obtained on each channel. MUA activity was normalized to prepulse firing (−1 to 0 s) and averaged across channels for the M2 probe. MUAs from all channels on the M2 probe were concatenated into a single spike train, and OFF periods were defined as 100 ms of silence following the start of the pulse. For the OFF-period analysis during NREM sleep, only pulses given during an ON period (defined by the presence of firing at the onset of the pulse) were used. To calculate the latency of the first spike following the pulse, the median latency was calculated and averaged across mice.
For analysis of sleep spindles after chemogenetic stimulation, two analyses were performed. First, LFP spectral power in the spindle range was calculated as described above. Second, individual spindles were detected off-line using previously published methods (Nir et al., 2011). The LFP from layer 5 was filtered from 10 to 16 Hz and the instantaneous amplitude was calculated using the Hilbert transform. A detection threshold of 3 SD (based on baseline light period) was used to identify local maxima, and a second threshold of 1 SD was used to define the beginning and end of each event. Events occurring within a second of each other were merged, and only events lasting from 0.5 to 2 s were considered.
To test whether SOM+-cell optogenetic stimulation induced spindles, spindle events were automatically detected in the 2 s after the pulse start, using cutoff thresholds for 10–16 Hz instantaneous amplitude based on NREM sleep without pulses. Across all animals, only 0.9 ± 0.3% of pulses were followed by a spindle, indicating that the stimulation did not effectively trigger spindles in subsequent ON periods. Laser stimulation also had little, if any, effects on sleep based on statistical analysis of episode length and percentage time in each state using t tests. Specifically, no significant change in the duration of NREM-sleep episodes (laser off: 39 ± 8 s; on: 42 ± 11 s, t(6) = −1.2, p = 0.26, paired t test) or REM-sleep episodes (off: 56 ± 6 s; on: 56 ± 11 s, t(6) = 0.13, p = 0.90, paired t test) and a small decrease in wake episode length (off: 40 ± 7 s; on: 28 ± 8 s, t(6) = 5.8, p = 0.001, paired t test) occurred when the laser was on compared with when it was off. In fact, during laser stimulation, mice actually spent more time in NREM sleep (off: 45 ± 4%; on: 55 ± 5%, t(6) = −4.6, p = 0.004, paired t test) and less time in wake (off: 47 ± 5%; on: 37 ± 5%, t(6) = 4.6, p = 0.004, paired t test).
To analyze the effect of optogenetic stimulation on single units and for optogenetic tagging experiments, spike sorting was performed off-line using supraparamagnetic clustering (Quiroga et al., 2004). Visual inspection of clustered waveforms was carried out both to discriminate between single-unit (SU) activity and MUA, and to determine consistency in waveform shape. Unit stability was assessed by plotting both the firing rate in 4 s epochs and the waveform maximum amplitude. Clusters were only considered to be single units if <3% of all interspike intervals (ISIs) were <3 ms (which represent refractory violations). Other metrics inspected include an estimate of false negatives due to spikes missed based on the channel threshold and the distribution of waveform minima, and Fisher's linear discriminant, which identifies potential overlap of waveform characteristics between a pair of clusters on the same channel (Hill et al., 2011). Units with spike width at half maximum amplitude <0.25 ms were categorized as narrow, putative inhibitory neurons, and those >0.25 ms were categorized as broad, putative excitatory neurons.
To examine the effects of optogenetic SOM+-cell activation on SU firing, spikes for each unit 1 s before/after each pulse delivered in NREM sleep were detected. Firing was normalized to baseline firing from −1000 to −500 ms relative to the pulse. To examine firing of putative SOM units, ≥30 min of consolidated active wake, quiet wake, NREM sleep, and REM sleep were used. Firing rates were calculated for 4 s epochs. The correlation between firing rate and either SWA or 10–16 Hz (spindle power range) from a layer-5 LFP across all 4 s NREM-sleep epochs were calculated using the Matlab “corr” function. LFP slow waves were detected, and firing from −1 to +1 s after the zero crossing was calculated for each unit. To assess slow wave-locked firing, simulated spike trains from the same NREM episodes were generated using ISI shuffling to preserve both firing level and temporal structure. For each NREM episode, this simulation was repeated 1000 times, and a threshold for firing rate at each time point was set based on the 99th percentile. Firing rates above this threshold were taken as evidence of slow-wave-locked firing. In two mice with a putative SOM unit, sleep deprivation recordings were also performed following the baseline recording. For each unit, spikes from early NREM (first 3 h of baseline), late NREM (last 3 h of baseline), and recovery sleep (from first 3 h following sleep deprivation) were combined and sorted together. Waveforms from each condition were inspected separately to ensure unit stability. Firing locked to slow waves was calculated as described above.
Tracing and CNO-mediated Fos activation experiments
For SOM and PV tracing experiments, animals were given 26 d to express the virus before being killed. Mice were then anesthetized with isoflurane (3% volume) and perfused transcardially with a flush (∼30 s) of saline followed by 4% paraformaldehyde in phosphate buffer (PB), pH 7.4. Brains were removed, postfixed for 24 h in the same fixative, cut on a Vibratome in 50 μm sagittal and coronal sections, and collected in PB. Sections were then mounted, air-dried, and examined under a confocal microscope using a Lump Plan Fl 20× objective (numerical aperture, 0.95). Image analysis was performed in FIJI and Adobe Photoshop.
For Fos activation experiments, mice expressing hM3Dq received CNO 2 h before perfusion to detect CNO-driven Fos expression. Mice were anesthetized with isoflurane (3% volume) and perfused as described above. Brains were cut on a Vibratome in 50 μm coronal sections that were then rinsed with a 1% H2O2 solution followed by a blocking solution [3% NGS (MP Biomedicals, catalog #08642921, RRID:AB_2335031) and 0.1% Triton X-100] for 2 h, and incubated overnight in the blocking solution containing rabbit anti-Fos antibody (1:4000; Santa Cruz Biotechnology, sc-52, RRID:AB_2106783). A Tyramide Signal Amplification kit (TSA, T20922, Life Technologies) was used to amplify the Fos signal. Sections were then mounted, coverslipped, and examined under a confocal microscope using a UPlan FL N 40× objective (numerical aperture, 1.3).
Colocalization experiments
Two pilot studies [Fos/neuronal nitric oxide synthase (nNOS) and SOM/nNOS] were conducted to confirm previously published findings. For the Fos/nNOS experiment, two C57BL/6 wild-type mice were kept awake for 6 h from light onset using novel objects, then allowed to sleep for ∼90 min (Gerashchenko et al., 2008), and then perfused. The duration of recovery sleep was selected based on previous studies that identified cortical Fos+/nNOS+ cells during early recovery sleep (Kilduff et al., 2011). Brains were cut and coronal sections (two frontal, two parietal, two occipital per mouse) were rinsed with a 1% H2O2 solution followed by a blocking solution (3% NGS and 0.1% Triton X-100) for 2 h, and incubated overnight in the blocking solution containing a mixture of antibodies (rabbit anti-Fos, 1:4000, RRID:AB_2106783, and mouse anti-nNOS, 1:5000, Sigma-Aldrich, N2280, RRID:AB_260754). The next day, sections were washed and reacted with secondary antibody (Alexa Fluor 568, 1:1000; Invitrogen, RRID:AB_10563566) for nNOS, while a TSA (T20922, Life Technologies) was used to amplify the Fos signal. Sections were examined under a confocal microscope using a UPlan FL N 40× objective (numerical aperture, 1.3). Microscopic fields were selected as 512 × 512 pixel images. The entire cortex within each section was visually scanned and the number of SOM+nNOS+ cells was counted. In the second pilot experiment (SOM/nNOS), four SOM reporter mice [B6N.Cg-Ssttm2.1(cre)Zjh/J × B6.Cg-Gt(ROSA)26Sortm14(CAG-tdTomato)Hze/J] were kept awake for 6 h from light onset using novel objects. Two mice were immediately perfused (sleep deprivation), while the remaining two mice were allowed to sleep for 90 min (recovery sleep) and then perfused. Coronal sections (one frontal, one parietal per mouse) were rinsed with a blocking solution (10% NGS) for 1 h, and incubated overnight with mouse anti-nNOS (1:5000; Sigma-Aldrich, N2280, RRID:AB_260754). The next day, sections were washed and then rinsed with secondary antibody (Alexa Fluor 488, 1:1000; Invitrogen). Sections were examined under a confocal microscope using a UPlan FL N 40× objective (numerical aperture, 1.3). Microscopic fields were selected as 512 × 512 pixel images. The entire cortex within each section was visually scanned and the number of SOM+nNOS+ cells was counted. Consistent with published work (Kubota et al., 1994), in all four mice most (95% ± 0.04, mean ± SD) of nNOS+ cells were also SOM+, while only a minority (11% ± 0.02) of SOM+ cells were also nNOS+.
For Fos/SOM experiments, the brains of six SOM reporter mice (two sleep deprivation; four recovery sleep) were cut and coronal sections (two frontal, two parietal, two occipital per mouse) were rinsed with a 1% H2O2 solution followed by a blocking solution (3% NGS and 0.1% Triton X-100) for 2 h, and incubated overnight in the blocking solution containing rabbit anti-Fos antibody, followed by TSA to amplify the Fos signal. Sections were examined under a confocal microscope using a UPlan FL N 40× objective (numerical aperture, 1.3). Microscopic fields were selected as 512 × 512 pixel images of superficial (I–III, five fields) and deep (IV–VI, five fields) layers.
Experimental design and statistical analysis using LME models
For the chemogenetic experiments, statistical analysis was performed using LME models (Laird and Ware, 1982). The use of LME models offers several advantages over traditional ANOVA methods for repeated measures, including the ability to handle unbalanced designs and greater flexibility for post hoc tests. The general matrix form of the LME is as follows: y = Xβ + Zu + ε, where u ∼ N(0, Σ) and ε ∼ N(0, Iσ2).
In these models, y is the response variable (e.g., SWA), u are the random effects for each individual mouse (assumed to be independent and normally distributed, with mean zero and covariance matrix Σ), β are the fixed effects, and X and Z are design matrices that link the particular responses to β and u. The residuals ϵ are assumed to be independent and normally distributed with constant variance σ.
The set of random and fixed effects included in each model was determined using the Akaike Information Criterion (AIC). For the random effects, we looked for the minimum AIC value, but if several models had similar AIC values, we took the one that included the most random effects, as omitting random effects can introduce errors when testing the significance of fixed effects. Conversely, the fixed effects were selected by identifying the specific model that minimizes the AIC. Parameter estimation of LMEs was performed using numerical maximum-likelihood estimators, implemented in R by the lmer() function of the lme4 package (Bates et al., 2015). To test the significance of effects in the LME model, we used likelihood ratio tests. Under the hypothesis that the experiment (e.g., CNO injection) had an effect on SWA, we expected that there should be no differences between conditions (groups; e.g., hM3Dq vs non-hM3Dq mice) during the baseline day, but significant differences between groups on the CNO day. Thus, we specifically tested for a condition*day interaction effect; if the interaction was found to be significant, we then performed post hoc tests to confirm that there was in fact no difference in the baseline day and a significant difference in the CNO day. Additional LME models were also fit to test the effects of sleep deprivation. These models did not include condition as a fixed effect as there was no corresponding control group for the sleep deprivation condition. All post hoc comparisons in the LME models were z tests, performed using the glht() function of the multcomp package in R, with p values adjusted for multiple comparisons using the single-step method (Bretz et al., 2011). For all models, residual plots were used to assess the normality and constant variance assumption of the LME, and in some cases a log transformation was applied if necessary to satisfy these assumptions. Below we give the full details for the three main experimental results; however, all statistical analyses were performed using the same process, albeit with potentially different model structures.
LME models
Chemogenetic activation of SOM+ cells.
The AIC analysis selected a model for SWA that included Condition (hM3Dq vs non-hM3Dq, n = 6 male mice/group), Day (baseline vs CNO day), and Hour, as well as a Condition*Day interaction and an Hour*Day interaction. A log transformation was applied to the response variable to satisfy the modeling assumptions. Parameter estimates for the LME model of SWA are shown in Table 1. Residual plots were used to assess the model assumptions of normality and constant variance. From the scatter plot of residuals versus fitted values, we found no evidence against either of the assumptions. The LRT revealed a significant Condition*Day interaction (χ2 = 14.69, df = 1, p = 0.0001), and subsequent post hoc tests found no significant differences between groups during the baseline day (z = −0.785, p = 0.607, 2.78% decrease) and a significant increase in SWA for the hM3Dq mice compared with the control group (non-hM3Dq mice) during the CNO day (z = 4.371, p = 2.4e-5, 49.74% increase).
Table 1.
LME, chemogenetic activation of SOM+ cells [log(SWA) during NREM]
| Estimate | SE | |
|---|---|---|
| Random effects | ||
| Mouse | ||
| Intercept | 0.0394 | |
| Day–CNO (correlation with intercept: 1.0) | 0.0935 | |
| Residual | 0.0808 | |
| Fixed effects | ||
| Intercept | −0.0826 | 0.0340 |
| Condition (group) | ||
| Control (non-hM3Dq, reference) | 0 | 0 |
| hM3Dq | −0.0282 | 0.0359 |
| Day | ||
| Baseline (reference) | 0 | 0 |
| CNO | 0.2348 | 0.0586 |
| Hour | ||
| 7 (reference) | 0 | 0 |
| 8 | −0.0267 | 0.0381 |
| 9 | 0.0119 | 0.0381 |
| 10 | −0.0902 | 0.0381 |
| 11 | −0.0852 | 0.0381 |
| Condition*Day interaction | ||
| Control, baseline (reference) | 0 | 0 |
| hM3Dq, CNO | 0.4319 | 0.0715 |
| Hour*Day interaction | ||
| 7, baseline (reference) | 0 | 0 |
| 8, CNO | −0.1999 | 0.0539 |
| 9, CNO | −0.2800 | 0.0539 |
| 10, CNO | −0.2497 | 0.0539 |
| 11, CNO | −0.2380 | 0.0539 |
Chemogenetic inhibition of SOM+ cells.
The AIC analysis selected a model for SWA that included Condition (hM4Di vs non-hM4Di, n = 5 male mice/group), Day, and Hour, as well as a Condition*Day interaction and an Hour*Day interaction. A log transformation was applied to the response variable to satisfy the modeling assumptions. Parameter estimates for the LME model of SWA are shown in Table 2. Residual plots were used to assess the model assumptions of normality and constant variance. From the scatter plot of residuals versus fitted values, we found no evidence against either of the assumptions. The LRT revealed a significant Condition*Day interaction (χ2 = 15.56, df = 1, p = 8.0e-5), and subsequent post hoc tests found no significant differences between groups during the baseline day (z = 0.068, p = 0.996, 0.21% decrease) and a significant decrease in SWA for the hM4Di group compared with the control (non-hM4Di) group during the CNO day (z = −4.612, p = 7.8e-6, 18.56% decrease).
Table 2.
LME, chemogenetic inhibition of SOM+ cells [log(SWA) during NREM]
| Estimate | SE | |
|---|---|---|
| Random effects | ||
| Mouse | ||
| Intercept | 0.0386 | |
| Day–CNO (correlation with intercept: 0.71) | 0.0292 | |
| Residual | 0.0780 | |
| Fixed effects | ||
| Intercept | 0.2923 | 0.0317 |
| Condition (group) | ||
| Control (non-hM4Di, reference) | 0 | 0 |
| hM4Di | 0.0021 | 0.0316 |
| Day | ||
| Baseline (reference) | 0 | 0 |
| CNO | 0.1783 | 0.0399 |
| Hour | ||
| 1 (reference) | 0 | 0 |
| 2 | −0.1936 | 0.0349 |
| 3 | −0.2481 | 0.0349 |
| 4 | −0.3065 | 0.0349 |
| 5 | −0.3465 | 0.0349 |
| 6 | −0.4041 | 0.0349 |
| Condition*Day interaction | ||
| Control, baseline (reference) | 0 | 0 |
| hM4Di, CNO | −0.2075 | 0.0339 |
| Hour*Day interaction | ||
| 1, baseline (reference) | 0 | 0 |
| 2, CNO | −0.1028 | 0.0493 |
| 3, CNO | −0.1760 | 0.0493 |
| 4, CNO | −0.1588 | 0.0493 |
| 5, CNO | −0.1000 | 0.0493 |
| 6, CNO | −0.0998 | 0.0493 |
Chemogenetic activation of PV+ cells.
The AIC analysis selected a model for SWA that included Condition (hM3Dq vs non-hM3Dq; n = 5 and 3 male mice, respectively), Day, and Hour, as well as a Condition*Day interaction and a Condition*Hour interaction. A log transformation was applied to the response variable to satisfy the model assumptions of normality and constant variance. Parameter estimates for the LME model of SWA are shown in Table 3. Residual plots were used to assess the model assumptions of normality and constant variance. From the scatter plot of residuals versus fitted values, we found no evidence against either of the assumptions. The LRT revealed a significant Condition*Day interaction (χ2 = 12.839, df = 1, p = 0.0003), and subsequent post hoc tests found no significant differences between groups during the baseline day (z = 1.152, p = 0.424, 4.08% increase) and a significant decrease in SWA for the hM3Dq group compared with the non-hM3Dq control group during the CNO day (z = −4.817, p = 2.9e-6, 54.27% decrease).
Table 3.
LME, chemogenetic activation of PV+ cells [log(SWA) during NREM]
| Estimate | SE | |
|---|---|---|
| Random effects | ||
| Mouse | ||
| Intercept | 0.0260 | |
| Day–CNO (correlation with intercept: 0.52) | 0.2041 | |
| Residual | 0.0890 | |
| Fixed effects | ||
| Intercept | 0.0021 | 0.0425 |
| Condition (group) | ||
| Control (non-hM3Dq, reference) | 0 | 0 |
| hM3Dq | −0.2031 | 0.0538 |
| Day | ||
| Baseline (reference) | 0 | 0 |
| CNO | −0.2081 | 0.1222 |
| Hour | ||
| 7 | 0 | 0 |
| 8 | −0.1963 | 0.0514 |
| 9 | −0.2074 | 0.0514 |
| 10 | −0.2121 | 0.0514 |
| 11 | −0.2130 | 0.0514 |
| Condition*Day interaction | ||
| Control, baseline (reference) | 0 | 0 |
| hM3Dq, CNO | −0.8224 | 0.1546 |
| Condition*Hour interaction | ||
| 7, control (reference) | 0 | 0 |
| 8, hM3Dq | 0.2417 | 0.0650 |
| 9, hM3Dq | 0.2989 | 0.0650 |
| 10, hM3Dq | 0.3131 | 0.0650 |
| 11, hM3Dq | 0.3615 | 0.0650 |
Results
Characterization of SOM+ activity in natural sleep
There is currently no molecular marker to target Martinotti cells exclusively (Urban-Ciecko and Barth, 2016). Instead, we used SOM-Cre mice (Taniguchi et al., 2011), because Martinotti cells form the bulk (∼70%) of SOM-expressing cells in the cortex (Jiang et al., 2015). AAV-driven expression of Cre-dependent enhanced green fluorescent protein in SOM-Cre mice confirmed that SOM+ cells have strong projections to L1 both locally and up to several millimeters away from the injection site (Fig. 1A), consistent with the known projections of Martinotti interneurons (Wang et al., 2004). We then injected SOM-Cre mice either in one frontal site (M2) with Cre-inducible AAV expressing channelrhodopsin-2 (ChR2), or bilaterally in the frontal (M2) and parietal cortex with Cre-inducible AAV expressing the designer receptors hM3Dq or hM4Di. After ∼3 weeks to allow for viral expression, mice were implanted with frontal and parietal EEG electrodes and intracortical laminar probes in M2, and continuously recorded for several days across multiple sleep–wake cycles, during sleep deprivation and subsequent recovery sleep, as well as during and after optogenetic or chemogenetic stimulation (Fig. 1B).
First, we characterized the firing pattern of 3 SOM+ cells in M2 that were identified by optogenetic tagging in freely moving animals (Fig. 2A) and whose activity could be followed for several days during the sleep–wake cycle (Fig. 2B). All three cells exhibited state-specific firing modulation, with higher firing levels during active wake with exploration relative to quiet wake (Pinto and Dan, 2015; but see Gentet et al., 2012) and during NREM sleep relative to REM sleep (Fig. 2C). Two of these cells were also recorded during recovery sleep after sleep deprivation, when they fired more than during baseline sleep (Fig. 2D). In these cells, firing was positively correlated with SWA, both in baseline and after sleep deprivation (Fig. 2E). In all three cells, firing significantly increased between 50 and 100 ms before the onset of locally detected slow waves, consistent with a link between SOM+-cell firing and SWA in natural sleep (Fig. 2F). Although correlative and restricted to a few neurons, these results are consistent with the hypothesis that SOM+-cell firing may be linked to the occurrence of slow waves in natural sleep. By contrast, SOM+-cell firing was negatively correlated with spindle activity (Fig. 3).
Figure 2.

Firing of SOM+ cells is locked to slow waves. A, Clustering results for one well isolated unit, in green, tagged by ChR2 stimulation (putative SOM+). Yellow bars indicate the time of laser stimulation (20 ms). B, Raw LFP and activity from the same unit. C, Median firing rates (horizontal line) of the three tagged units calculated from 4 s epochs in the light period. Gray rectangles denote 25th through 75th percentiles, with outliers plotted as blue circles. AW, Active wake; QW, quiet wake. D, Median firing rates in recovery sleep (RS) after sleep deprivation (SD) compared with early (E) and late (L) NREM sleep during baseline. FR, Firing rate; NR, baseline sleep. E, Correlation between unit firing and SWA in baseline sleep (NR) and recovery sleep after sleep deprivation (RS). F, Firing is locked to local slow waves and increases significantly (above red line) before their onset (0 ms, defined by the zero crossing of each slow wave; see Materials and Methods; firing normalized for mean in NREM; red line is 99th percentile FR for simulated spike trains with shuffled ISIs).
Figure 3.

Firing of SOM+ cells during sleep spindles. A, Representative raw traces of SOM+ unit firing during spindles. B, Negative correlation between unit firing and spindle power (10–16 Hz in NREM sleep).
Optogenetic SOM+ activation induces OFF periods
To directly test whether SOM+-cell firing is sufficient to induce OFF periods in the local cortical network of freely moving animals, we used optogenetic stimulation to briefly activate SOM+ cells in M2 during the ON periods of NREM sleep, while recording MUA and SU activity from the same area. SOM+-cell activation with laser pulses (50 ms) consistently induced OFF periods in MUA that outlasted the duration of the pulse and were comparable in length to those occurring during stimulation-free NREM sleep (190 ± 32 ms vs 174 ± 10 ms; mean ± SD). Stimulation-induced OFF periods occurred in all recorded M2 channels, including a majority whose MUA decreased during the pulse and remained decreased in the subsequent OFF period, and a few channels whose MUA sharply increased during the pulse. These “responding” channels, which presumably contained ≥1 SOM+ cell, accounted for ∼ 7% of all channels, consistent with the number of cortical cells that are SOM+ (Tremblay et al., 2016; SOM+ channel; Fig. 4A). After spike sorting, 72 SUs were identified across all channels in superficial and deep layers, including 63 broad (putative excitatory) units and 9 narrow (putative inhibitory) fast-spiking neurons. All units were effectively silenced by SOM+-cell activation, in line with the ability of SOM+ cells to inhibit all other cortical cell types (Jiang et al., 2015; Fig. 4B,C). Diffuse and persistent silencing was also obtained with shorter (20 ms) laser pulses (data not shown). Thus, multiunit OFF periods induced by SOM+-cell activation appear similar to those of physiological NREM sleep and, crucially, brief optogenetic activation of SOM+ cells silences all recorded SUs for a period that outlasts the stimulation—a characteristic feature of the bistability of slow oscillations (Hill and Tononi, 2005). OFF periods could also be triggered in wake and in REM sleep, but they were significantly shorter than those triggered in NREM sleep (wake: 154 ± 20 ms, t(6) = −5.3, p = 0.002 vs NREM sleep; REM sleep: 143 ± 20 ms, t(6) = −7.5, p = 0.0003 vs NREM sleep; paired t tests).
Figure 4.

Optogenetic activation of SOM+ cells triggers OFF periods during NREM sleep. A, Left, Example of MUA changes in two responding (SOM+, green) channels and several SOM− channels after laser stimulation (yellow bar, 50 ms). Right, Mean MUA changes for all SOM+ and SOM− channels (7 mice). Inset, Expanded y-axis to show the firing of SOM+ channels after laser pulse. B, Left, Change in firing in one broad unit (putative excitatory, spike waveform shown on top). Right, Mean of all broad units. C, As in B for narrow (putative inhibitory) units.
Chemogenetic activation of SOM+ cells increases NREM sleep SWA, while their chemogenetic inhibition decreases it
Next, we tested whether selective chemogenetic activation of SOM+ interneurons over a large portion of the cortex (bilateral frontal and parietal) would promote a prolonged increase in SWA. We chose a chemogenetic approach because it allows for sustained depolarization of SOM+ cells without enforcing highly synchronous activation as in optogenetic experiments. To control for the possible sedative effects of the selective ligand CNO alone, CNO was injected in SOM+ mice expressing the excitatory receptor hM3Dq AAV, and in other mice expressing non-hM3Dq AAV (controls). The effects of SOM+-cell chemogenetic activation on behavioral state and spectral activity in specific frequency bands were assessed using LME models that included mouse as a random effect, as well as day (baseline, CNO), condition (group, e.g., hM3Dq, non-hM3Dq), and time (hour) as categorical fixed effects. Specifically, we tested for a significant condition*day interaction, since we hypothesized that there would be differences between groups on the CNO day but not on the baseline day. If a significant interaction was detected, post hoc tests (adjusted for multiple comparisons) were used to confirm whether a significant increase or decrease was only present during the CNO day. With this approach, we could isolate the specific effects of SOM+-cell activation above and beyond the effects due to CNO injection alone (controls). The same statistical approach was used for SOM+ cell-inhibition and PV+-cell activation experiments (see below).
First, we confirmed that CNO administration in SOM-Cre mice expressing hM3Dq drove activation of Fos, a marker of neuronal activity, in SOM+, hM3Dq+ neurons, indicating that the drug was able to activate its target cells in vivo (Fig. 5A). Next, SOM-Cre mice previously injected with either hM3Dq AAV or non-hM3Dq AAV (n = 6 mice/group) were administered CNO (5 mg/kg) midway through the light phase, when most sleep pressure has dissipated. After CNO injection, mice continued to cycle through sleep–wake states and NREM sleep was characterized by decreased muscle tone, slow waves in both frontal EEG and LFP signals, and OFF periods in MUA (Fig. 5B,C), suggesting that, qualitatively, physiological sleep continued following SOM+-cell activation. Quantitatively, relative to controls, SOM+-cell activation resulted in a sustained increase in NREM SWA in both the frontal EEG (z = 2.384, p = 0.033, 19.8% increase), parietal EEG (z = 3.315, p = 0.002, 15.1% increase), and M2 LFP (z = 4.371, p = 2.4e-5, 49.74% increase) that lasted for the rest of the light cycle (Fig. 5D). Further spectral analysis in M2 found a broad shift toward lower-frequency activity during NREM sleep, with a significant increase in SWA and θ (6–8 Hz, z = 6.59, p = 8.7e-11, 40.6% increase), no significant change in α (8–15 Hz, z = 1.772, p = 0.133, 4.7% increase) and β (15–30 Hz, z = −1.734, p = 0.157, 4.8% decrease), and a decrease in low-γ (30–60 Hz, z = −5.167, p = 4.7e-7, 12.4% decrease) and high-γ (60–100 Hz, z = −6.011, p = 3.7e-9, 12.6% decrease) bands (Fig. 5E). There was no difference in spindle power between groups (z = 0.200, p = 0.974, 0.5% increase) and a significant decrease in spindle incidence (z = −3.755, p = 0.0003, 44.0% decrease). Similar effects—increased SWA (z = 3.657, p = 0.0005, 60.2% increase), θ (z = 2.629, p = 0.0168, 35.8% increase), α (z = 4.996, p = 1.2e-6, 39.1% increase), and β (z = 4.207, p = 5.2e-5, 13.2% increase) power and decreased low-γ (z = −3.859, p = 0.0002, 10.8% decrease) and high-γ (z = −5.401, p = 1.3e-7, 15.7% decrease) power—were present in REM sleep (Fig. 5E). In wake, SWA increased (z = 3.576, p = 0.0006, 54.2% increase) and high γ decreased (z = −3.957, p = 0.000216.3% increase; Fig. 5E). Sleep architecture was also modulated by SOM+-cell activation, with a significant increase in NREM sleep (z = 2.722, p = 0.0127, 21.8% increase) and a significant decrease in wake (z = −2.480, p = 0.0255, 34.9% decrease) and REM sleep (z = −2.801, p = 0.0097, 40.5% decrease; Fig. 5D).
Figure 5.
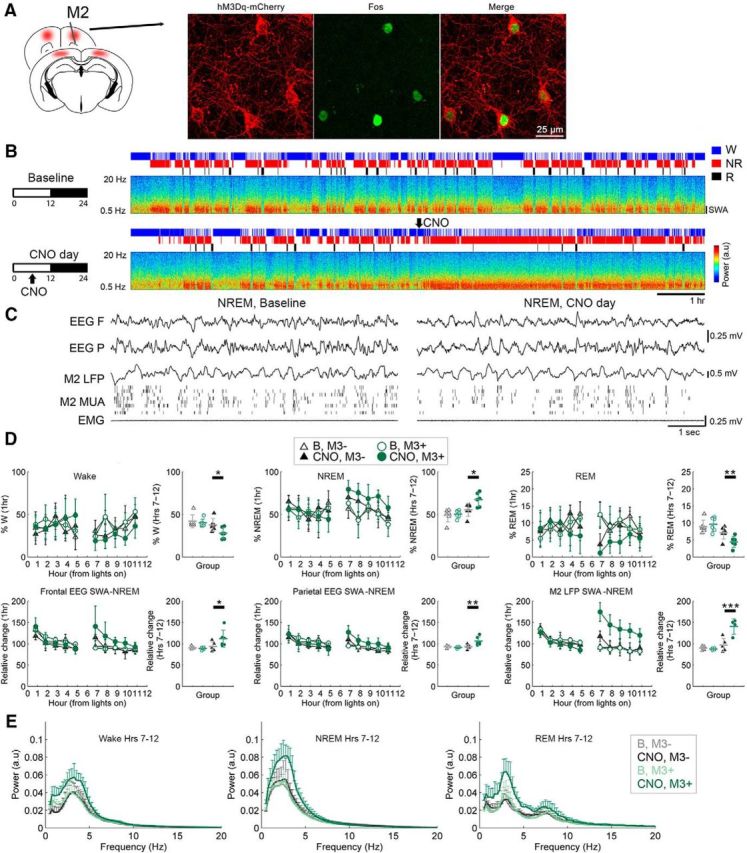
Chemogenetic SOM+-cell activation leads to a sustained increase in SWA. A, Fos induction in SOM+, hM3Dq+ neurons after CNO. B, Effects on sleep and SWA (NREM M2 LFP power, 0.5–4.5 Hz, M2) in one representative SOM-Cre hM3Dq+ mouse given CNO (5 mg/kg, i.p.) in the middle of the light phase. Hypnograms and spectra shown for entire light period (12 h). C, Raw traces from the same animal on baseline and post-CNO. D, Sleep/wake and SWA percentages in baseline (B) and after CNO in mice expressing hM3Dq AAV (M3+, 6 mice) and mice expressing non-hM3Dq AAV (controls, M3−, 6 mice). For each parameter, the left panel shows the hour-by-hour data, which were used to run the LME models, locked to first sleep bout after the start of the light period and after midpoint of the light period (when CNO was given); if a significant condition (group)*day interaction was found, post hoc tests were run to isolate the main effect of CNO (right). *p < 0.05; **p < 0.01; ***p < 0.001. E, Power spectra for the second half of the light period in each vigilance state.
To compare the effects of SOM+-cell activation to well known procedures that lead to increased sleep pressure and SWA, we subjected the same SOM-Cre/AAV-hM3Dq animals to sleep deprivation through exploration of novel objects for 6 h during the first half of the light phase, a period during which mice are normally asleep. For this analysis, we used an LME model that compared baseline, sleep deprivation, and SOM+ activation in the hM3Dq+ mice. Overall, the effects of sleep deprivation and SOM+-cell activation were similar, including increases in NREM sleep (sleep deprivation: z = 2.148, p = 0.0782, 28.2% increase; SOM+: z = 3.681, p = 0.0007, 48.3% increase), frontal EEG SWA (sleep deprivation: z = 4.896, p = 1.9e-6, 27.5% increase; SOM+: z = 2.690, p = 0.0176, 19.2% increase), and parietal EEG SWA (sleep deprivation: z = 2.227, p = 0.0663, 14.6% increase; SOM+: z = 2.362, p = 0.0475, 13.8% increase). SOM+ activation led to a greater increase in LFP SWA (sleep deprivation: z = 4.997, p = 1.4e-6, 30.1% increase; SOM+: z = 7.786, p = 2.7e-14, 57.4% increase; SOM+ vs sleep deprivation: z = 3.463, p = 0.0015, 21.0% increase), consistent with the strongest effect being present in the area of virus expression. Conversely, sleep deprivation had no effect on the duration of wake or REM sleep compared with baseline, while SOM+ activation reduced time spent in wake (z = −3.112, p = 0.0048, 14.0% decrease) and in REM sleep (z = −5.238, p = 2.6e-7, 57.8% decrease; Fig. 6A,B). Thus, the enhancement of slow frequencies after SOM+-cell activation resembles that induced by sleep deprivation.
Figure 6.
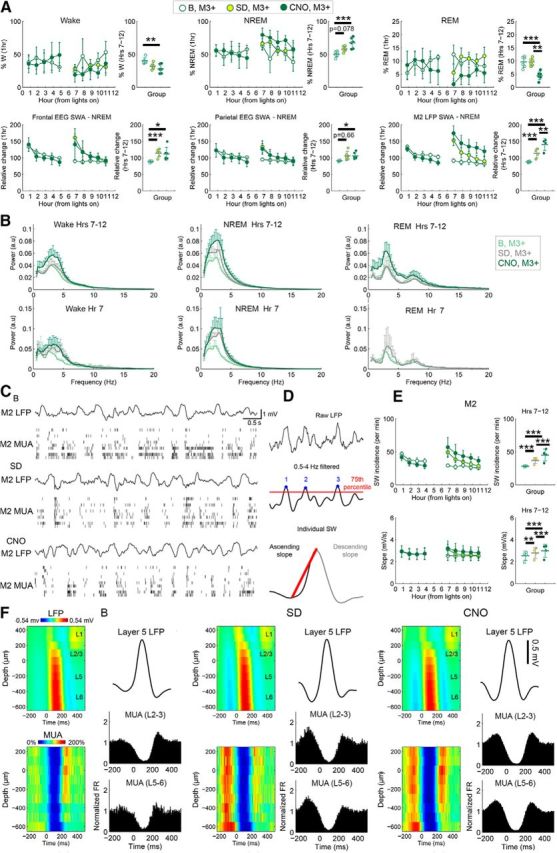
Chemogenetic SOM+ activation leads to changes in SWA and individual slow waves similar to those seen after sleep deprivation. A, Percentage time spent in sleep/wake, EEG, and M2 LFP SWA for baseline (B), recovery sleep after sleep deprivation (SD), and CNO experiments. For each sleep parameter hour-by-hour data locked to first sleep bout after the start of the light period and after 2:00 P.M. are shown; hour-by-hour data were used for the LME models, and if a significant condition*day interaction was found, post hoc tests were run to isolate the main effect of CNO (right). B, Power spectra for the second half of light period in each vigilance state. Spectra are shown for hours (Hrs) 7–12, to compare directly sleep deprivation and CNO experiments, and for the first hour after sleep deprivation (Hr 7), when the effects are most prominent. C, Raw LFP and MUA from NREM sleep for B, SD, and CNO experiments. D, Schematic of how individual slow waves were automatically identified. E, Slow-wave (SW) incidence (top) and slope (bottom), plotted as in A. F, Left, Depth profile of individual slow waves from baseline NREM sleep (top) and mean MUA locked to slow waves (bottom; blue corresponds to the OFF periods). Slow-wave onset is at 0 ms (zero crossing of each slow wave; see Materials and Methods). Middle, Right, Same for recovery sleep after SD (first hour) and sleep after CNO (last 5 h of the light period). *p < 0.05; **p < 0.01; ***p < 0.001.
The incidence and slope of the slow waves—two additional, highly sensitive measures of sleep pressure (Vyazovskiy et al., 2009b)—also increased in M2 after both sleep deprivation (slope: z = 3.425, p = 0.0017, 7.6% increase; incidence: z = 5.843, p = 5.2e-9, 29.9% increase) and SOM+-cell activation (slope: z = 5.828, p = 1.5e-8, 16.8% increase; incidence: z = 6.137, p = 8.4e-10, 59.8% increase; Fig. 6C–E). Moreover, analysis of laminar LFP recordings in baseline, recovery NREM sleep, and NREM sleep following chemogenetic activation showed that in all cases slow waves were largest in the LFP recordings from deep layers and were accompanied by OFF periods across all layers (Fig. 6F), consistent with previous reports from NREM sleep (Funk et al., 2016). Thus, like sleep deprivation, chemogenetic activation of SOM+ cells promotes the occurrence of slow waves that electrophysiologically resemble those in natural NREM sleep and also increases their slope, a sign of enhanced neuronal synchrony (Vyazovskiy et al., 2009b). Altogether, these results suggest that the stimulation of SOM+ cells may promote the same physiological mechanisms underlying sleep slow waves.
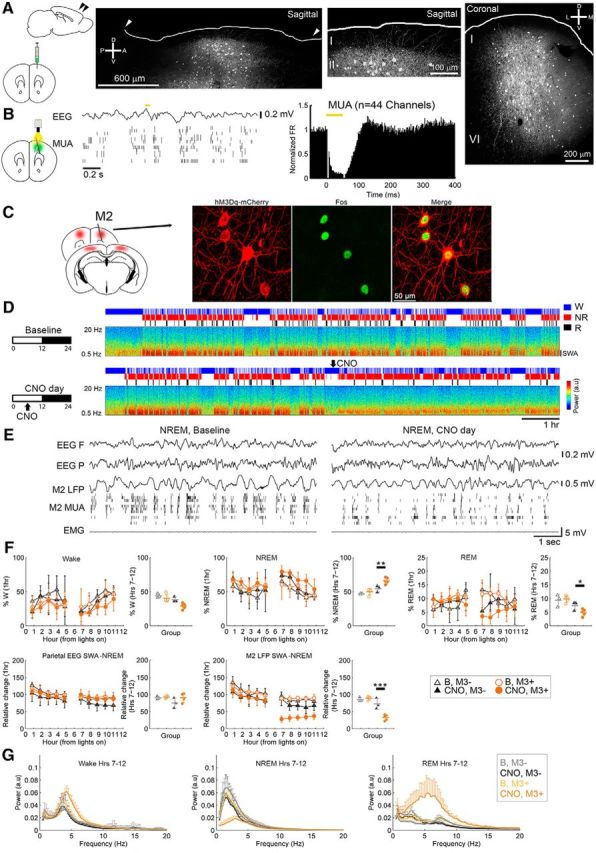
Other SOM-Cre mice were injected with the inhibitory receptor hM4Di (M4+, n = 5 mice) or non-hM4Di AAV (M4−, controls, n = 5 mice). After CNO, hM4Di+ mice spent significantly more time in REM sleep than controls (z = 3.422, p = 0.0012, 56.6% increase), but did not differ from controls in the time spent awake or in NREM sleep. By contrast they showed, during NREM sleep, a persistent decrease in SWA (z = −4.612, p = 7.9e-6, 18.6% decrease; Fig. 7A–D), associated with a decrease in the incidence of slow waves (z = −4.077, p = 8.9e-5, 23.3% decrease) as well as a decrease in SWA during REM sleep (z = −4.458, p = 1.7e-5, 20.1% decrease).
Figure 7.

Chemogenetic inactivation of SOM+ cells leads to a sustained decrease in SWA. A, B, Effects on sleep and SWA in M2 during the light period in one representative SOM-Cre hM4Di+ mouse given CNO (10 mg/kg, i.p.) at light onset, and raw traces from the same animal in the second hour after injection. C, Effects on behavioral states and SWA after CNO (M4+, 5 mice; controls, M4− 5 mice). For each parameter, the left panel shows hour-by-hour data locked to the first sleep bout after the start of the light period (when CNO was given), while the right panel shows the mean values from the first half of the light period. LME models were run on hour-by-hour data; if a significant condition (group)*day interaction was found, post hoc tests were run to isolate the main effect of CNO (right). **p < 0.01; ***p < 0.001. D, Power spectra for the first half of the light period in each vigilance state.
Characterization of SOM+ c-fos expression in natural sleep
Previous work has described a group of cortical neurons containing high levels of nNOS—type-I nNOS+ cells—that expresses Fos during early recovery sleep, when SWA is high (Gerashchenko et al., 2008). We first confirmed this finding in two mice, in which we found that after 90 min of recovery sleep following 6 h of sleep deprivation most nNOS+ cells were also Fos+ (61%), and were mainly located in deep layers, as previously reported (Kilduff et al., 2011; data not shown). Since all type-I nNOS+ cells are also SOM+ cells but not vice versa (Kilduff et al., 2011), we assessed in other mice (n = 6) Fos expression in SOM+ cells and found that only a small subset of SOM+ neurons were Fos+ during recovery sleep. Conversely, many Fos+ cells during recovery sleep were not SOM+ cells, and Fos+ cells were found in all cortical layers (Fig. 8). It should be noted that the mean firing rates of most cortical cells are only slightly decreased throughout sleep relative to wake and the relationship between spontaneous neuronal activity and Fos expression is not straightforward (Kawashima et al., 2014).
Figure 8.

SOM+-cell Fos expression in natural sleep. A, Left, Experimental design for Fos experiments: mice were sleep deprived by exposure to novel objects for 6 h and then either killed immediately (SD, n = 2) or allowed to recover sleep for 90 min (RS, n = 4). Right, Schematic of the six coronal sections used in each mouse, with the red rectangles showing the cortical areas used for cell counting. B, Representative examples of the expression of SOM, Fos, and their colocalization in the frontal cortex of one SD and one RS mouse. C, Mean number of double-labeled cells (SOM+Fos+) expressed as percentage relative to all SOM+ cells (gray) or relative to all Fos+ cells (black) across all layers. Average cell counts across all cortical areas in SD: SOM+, 1060 ± 74; Fos+, 1970 ± 77; SOM+Fos+, 19 ± 2. Cell counts in RS: SOM+, 1014 ± 259; Fos+, 274 ± 131; SOM+Fos+, 27 ± 7. D, E, As in C, for superficial layers (1–3) and deep layers (4–6) separately.
Activation of PV+ cells decreases SWA in NREM sleep
Is the induction of physiological slow waves and NREM sleep specific to SOM+ neurons? The most numerous population of cortical inhibitory cells are PV+ (Tremblay et al., 2016). Using a PV-Cre line, we first confirmed that unlike SOM+ cells, PV+ neurons have local projections and their axons mostly avoid L1 (Jiang et al., 2015; Fig. 9A). Optogenetic stimulation of PV+ cells produced a more transient silencing in response to laser pulses than did optogenetic activation of SOM+ cells (Fig. 9B; latency to first post-pulse spike, mean ± SD: SOM+, 128 ± 48 ms; PV+, 59 ± 19 ms, t(10) = 3, p = 0.01, unpaired t test; 7 SOM+ mice and 5 PV+ mice). Next, we confirmed that CNO induces Fos expression in PV+, hM3Dq+ neurons (Fig. 9C), as it does in SOM+, hM3Dq+ cells. Relative to controls injected with non-hM3Dq+ AAV, chemogenetic activation of PV+ cells led to a marked decrease in M2 SWA during NREM sleep (z = −4.817, p = 2.9e-6, 54.3% decrease; Fig. 9D–F; n = 5 mice), as well as in all other major frequency bands (θ: z = −2.054, p = 0.0784, 23.5% decrease; α: z = −2.523, p = 0.0231, 27.5% decrease; β: z = −3.057, p = 0.0045, 31.9% decrease; low γ: z = −4.603, p = 8.4e-6, 49.4% decrease; high γ: z = −4.308, p = 3.3e-5, 56.0% decrease; Fig. 9G). PV+-cell activation also increased the duration of behaviorally and polygraphically defined NREM sleep (z = 3.070, p = 0.0043, 17.6% increase) and decreased the duration of REM sleep (z = −2.362, p = 0.036, 35.8% decrease; Fig. 9F). Consistent with this broad power decline, during chemogenetic activation of PV+ cells cortical firing was profoundly suppressed during NREM sleep (hours 7–12 post-CNO vs hours 1–6 pre-CNO), much more than after activation of SOM+ cells (z = −5.262, p = 1.4e-7, 53.6% decrease). In contrast, PV+-cell activation led to a broad increase in LFP power during REM sleep (SWA: z = 9.476, p < 2e-16, 160% increase; θ: z = 6.608, p = 7.8e-11, 256% increase, α: z = 6.153, p = 1.5e-9, 112% increase; β: z = 3.841, p = 0.0002, 61.6% increase; Fig. 9G) and during wake (SWA: z = 3.27, p = 0.0021, 42.9% increase; θ: z = 3.651, p = 0.0005, 56.3% increase; α: z = 2.389, p = 0.0335, 50.9% increase; Fig. 9G).
Figure 9.
PV activation decreases SWA in NREM sleep. A, Cortical projections shown in sagittal and coronal sections from a representative PV-Cre mouse injected with AAV1.CAG.Flex.eGFP.WPRE.bGH, with sparse innervation in L1. B, Optogenetic stimulation of PV+ cells leads to transient suppression of MUA (5 mice). C, Fos induction after CNO. D, E, Increase in NREM sleep percentage but decrease in M2 SWA following CNO in one representative mouse given CNO (5 mg/kg, i.p.) in the middle of the day, and raw traces from the same animal during the second hour after injection. F, Effects on behavioral states and SWA (M3+, 5 mice; controls, M3−, 3 mice). For each parameter, the left panel shows hour-by-hour data, which were used to run the LME models, locked to the first sleep bout after the start of the light period and after midpoint of the light period (when CNO was given); if a significant condition (group)*day interaction was found, post hoc tests were run to isolate the main effect of CNO (right). *p < 0.05; **p < 0.01; ***p < 0.001. G, Power spectra for the second half of the light period in each vigilance state.
Discussion
These findings show that slow waves—the hallmark of NREM sleep—are positively regulated by a population of SOM+ cortical inhibitory interneurons. SOM+ cells fire just before the occurrence of slow waves and their acute optogenetic activation produces a sustained neuronal OFF period across putative excitatory and inhibitory neurons, consistent with the broad connectivity of SOM+ cells. Sustained chemogenetic activation of SOM+ cells enhances SWA and the slope of individual slow waves, while their chemogenetic inhibition decreases SWA and slow-wave incidence. In contrast, PV+-cell activation profoundly suppresses SWA and cortical activity in general, demonstrating that the positive role SOM+ cells in the generation of sleep slow waves is not shared by all GABAergic cortical interneurons.
A hallmark of NREM SWA is its homeostatic regulation (Borbély and Achermann, 2005; Borbély et al., 2016). Chemogenetic activation of SOM+ cells produced an increase in SWA, slow-wave slope, and incidence that resembled the changes seen with sleep deprivation in the same animals. Moreover, SOM+ firing levels correlated with SWA in recovery sleep, consistent with a possible link between SOM+ activity and increased SWA in natural recovery sleep. Thus, not only is the cortical SOM+-cell network, with its dense local L1 projections, long-distance cortical projections (Wang et al., 2004), and gap junctions (Ma et al., 2006; Fanselow et al., 2008) effectively able to induce SWA, but the overall level of activity in this network may also contribute to the homeostatic regulation of SWA.
Slow waves can change globally or locally in response to wake-induced changes in cortical activity and plasticity, often without any effect on NREM sleep duration (Borbély and Achermann, 2005; Davis et al., 2011; Krueger and Tononi, 2011; Borbély et al., 2016). Whether local variations in SOM+ activity lead to local up-regulation in SWA remains unknown. Previous research shows that at the population level, firing rate of cortical excitatory neurons in NREM sleep is elevated when sleep pressure is increased (Vyazovskiy et al., 2009b). Given that excitatory synapses on SOM+ cells are facilitating (Silberberg and Markram, 2007; Fanselow and Connors, 2010), the increased firing of excitatory cells could in turn drive increases in SOM+ activity. Thus, we speculate that SOM+ cells could be effectively poised to transduce increased excitatory-cell firing into increased SWA, and, given their extensive axonal projections, could do so at the global level, as well as locally.
Although the chemogenetic activation of SOM+ cells and PV+ cells had opposite effects on SWA, it led in both cases to an increase in time spent in NREM sleep. SOM+ inactivation instead decreased SWA but had no effect on NREM sleep duration. Altogether, these results suggest that at least partially different mechanisms regulate SWA and NREM sleep amount, in line with previous studies showing that changes in the “intensity” of NREM sleep, as reflected by SWA, can be dissociated from changes in its duration (Borbély and Achermann, 2005; Davis et al., 2011; Krueger and Tononi, 2011). For instance, several drugs and different regimes of sleep deprivation can affect either NREM sleep or slow waves, or change both but in opposite directions (Borbély and Achermann, 2005; Davis et al., 2011). Here, we employed large-volume virus injections in bilateral frontal and parietal regions. It is possible that increasing GABAergic tone in multiple cortical areas promoted the increase in NREM sleep, though this remains highly speculative. The effect of SOM+-cell and PV+-cell activation may have further been augmented by spread of activation through gap junctions (Ma et al., 2006; Fanselow et al., 2008), which could be tested in the future by combining chemogenetic activation with pharmacological manipulation of gap junctions. Finally, SOM+ cells have long-distance cortical (Wang et al., 2004) and subcortical (Melzer et al., 2017) projections, which could contribute to the regulation of behavioral states. A recent study characterized two types of corticostriatal neurons, SOM+ cells and PV+ cells, and found that they differentially regulate locomotion (Melzer et al., 2017). The same study also identified occasional projections from corticostriatal SOM+ cells to basal forebrain and thalamic nuclei involved in arousal circuitry (Melzer et al., 2017), and future studies focusing on these projections may lead to identification of “top-down” circuits for regulation of behavioral state.
We found that activation of PV+ cells led to decreased SWA, indicating that not all interneuron subtypes induce slow waves. Nonetheless, it is possible that in addition to SOM+ cells, other inhibitory cell types play a role in the generation of slow waves. Indeed, analysis of neuronal Fos expression in recovery sleep revealed numerous Fos+ SOM− cells. We do not know whether these cells belong to a specific subtype, or are a heterogeneous population. One candidate group are neurogliaform cells. These cells can induce indiscriminate GABAB-mediated hyperpolarization through volume transmission (Oláh et al., 2009; Tremblay et al., 2016), although their effects on synaptic strength are less powerful than those of SOM+ cells (Urban-Ciecko et al., 2015). Moreover, neurogliaform cells are prominent in L1, where we observed only sparse Fos+ cells during recovery sleep. Other interneuron subtypes may negatively regulate slow waves through their effects on the activity and excitability of SOM+ cells. SOM+ cells are inhibited by cortical vasoactive intestinal polypeptide interneurons (Pfeffer et al., 2013) that fire during locomotion and are themselves under the control of arousal systems (Stryker, 2014) and by PV+ interneurons in the basal forebrain, which are wake-on and promote wake (Xu et al., 2015). Finally, the activity of other interneuron subtypes in NREM sleep may have functions unrelated to SWA per se. For instance, PV+ activation increased NREM sleep, suggesting a possible role for these cells in NREM sleep independent of SWA. Future research on state-specific activity of cortical interneuron subtypes is likely to reveal rich heterogeneity in the contribution of these cell types to sleep rhythms and function.
Another open question is whether SOM+ cells in other parts of the brain regulate behavioral or electrophysiological properties of NREM sleep. In the CA1 region of the hippocampus, bistratified SOM+ cells exhibit increased firing during sharp-wave ripples, while oriens lacunosum-moleculare SOM+ cells exhibit little modulation or, in some cases, decreased firing (Katona et al., 2014). In contrast with the differential regulation of SWA by cortical SOM+ and PV+ cells, optogenetic activation of PV+ and SOM+ cells in CA1 produced similar disruption of sharp-wave ripples (Stark et al., 2014). In the basal forebrain, SOM+ cells inhibit all types of neighboring wake-promoting neurons and their optogenetic activation slightly increases NREM sleep, consistent with the finding that a minority of these cells is more active during NREM sleep (Xu et al., 2015). Also, subcortical wake-promoting and sleep-promoting systems also directly regulate SOM+ activity. For instance, noradrenaline, a neuromodulator released at high levels in wake and at low levels in sleep, reduces the effectiveness of synapses between SOM+ and pyramidal cells (Koyanagi et al., 2010) and the conductivity of gap junctions (Zsiros and Maccaferri, 2008), possibly preventing the induction and synchronization of sleep slow waves.
We used a SOM-Cre line that broadly labels both Martinotti and non-Martinotti SOM+ cells. The widespread L1 projections of Martinotti cells, which comprise ∼70% of SOM+ cells, makes them the primary candidate for mediating the induction of sleep slow waves reported here, but definitive evidence will require repeating these experiments in Martinotti-specific Cre lines. To our knowledge, no Martinotti-specific Cre line is currently available, although a recent study demonstrated that the Chrna2-Cre line labels Martinotti interneurons in layer 5 of the cortex (Hilscher et al., 2017). However, only a small percentage of layer-2/3 Martinotti cells were labeled by this line, meaning that the SOM-Cre line remains the best tool for labeling all Martinotti cells across layers. Future experiments should establish the contribution of other cortical subpopulations of SOM+ cells (McGarry et al., 2010), such as non-Martinotti cells in layer 4 (Xu et al., 2013) and nNOS cells (Kilduff et al., 2011). The latter are of particular interest, as nNOS cells exhibit increased Fos expression after recovery sleep (Kilduff et al., 2011) and NREM SWA is decreased in nNOS knock-out mice (Morairty et al., 2013). Another limitation of this study was the use of laminar probes implanted in a fixed position, which led to a small yield of well-isolated optogenetically tagged SOM+ units. Finally, the unit data were recorded in M2, raising the question of whether SOM+ cells in other cortical areas exhibit similar properties.
Footnotes
This work was supported by the National Institute of Mental Health (Grant R01MH099231 to C.C. and G.T.), the National Institute of Neurological Disorders and Stroke (Grant P01NS083514 to C.C. and G.T.; Grant R01GM116916 to G.T.), a Wisconsin Distinguished Rath Graduate Fellowship (to C.M.F.), and the National Institute of General Medical Sciences (Grant T32 GM008962 to C.M.F.). CNO was obtained from National Institute of Neurological Disorders and Stroke as part of the Rapid Access to Investigative Drug Program.
G.T. is involved in a research study in humans supported by Philips Respironics. That study is not related to the work presented in this manuscript. The authors declare no other competing financial interests.
References
- Bates D, Maechler M, Bolker B, Walker S (2015) Fitting linear mixed-effects models using lme4. J Stat Software 67:1–48. 10.18637/jss.v067.i01 [DOI] [Google Scholar]
- Borbély AA, Achermann P (2005) Sleep homeostasis and models of sleep regulation. In: Principles and practice of sleep medicine (Kryer MH, Roth T, Dement WC, eds.), pp 405–417. Philadelphia: Elsevier Saunders. [Google Scholar]
- Borbély AA, Daan S, Wirz-Justice A, Deboer T (2016) The two-process model of sleep regulation: a reappraisal. J Sleep Res 25:131–143. 10.1111/jsr.12371 [DOI] [PubMed] [Google Scholar]
- Bretz F, Hothorn T, Westfall P (2011) Multiple comparisons using R. Boca Raton, FL: CRC. [Google Scholar]
- Cauller L. (1995) Layer I of primary sensory neocortex: where top-down converges upon bottom-up. Behav Brain Res 71:163–170. 10.1016/0166-4328(95)00032-1 [DOI] [PubMed] [Google Scholar]
- Chiu CQ, Lur G, Morse TM, Carnevale NT, Ellis-Davies GC, Higley MJ (2013) Compartmentalization of GABAergic inhibition by dendritic spines. Science 340:759–762. 10.1126/science.1234274 [DOI] [PMC free article] [PubMed] [Google Scholar]
- Craig MT, McBain CJ (2014) The emerging role of GABAB receptors as regulators of network dynamics: fast actions from a ‘slow’ receptor? Curr Opin Neurobiol 26:15–21. 10.1016/j.conb.2013.10.002 [DOI] [PMC free article] [PubMed] [Google Scholar]
- Craig MT, Mayne EW, Bettler B, Paulsen O, McBain CJ (2013) Distinct roles of GABAB1a- and GABAB1b-containing GABAB receptors in spontaneous and evoked termination of persistent cortical activity. J Physiol 591:835–843. 10.1113/jphysiol.2012.248088 [DOI] [PMC free article] [PubMed] [Google Scholar]
- Crunelli V, David F, Lőrincz ML, Hughes SW (2015) The thalamocortical network as a single slow wave-generating unit. Curr Opin Neurobiol 31:72–80. 10.1016/j.conb.2014.09.001 [DOI] [PubMed] [Google Scholar]
- Davis CJ, Clinton JM, Jewett KA, Zielinski MR, Krueger JM (2011) Delta wave power: an independent sleep phenotype or epiphenomenon? J Clin Sleep Med 7:S16–S18. 10.5664/JCSM.1346 [DOI] [PMC free article] [PubMed] [Google Scholar]
- Fanselow EE, Connors BW (2010) The roles of somatostatin-expressing (GIN) and fast-spiking inhibitory interneurons in UP-DOWN states of mouse neocortex. J Neurophysiol 104:596–606. 10.1152/jn.00206.2010 [DOI] [PMC free article] [PubMed] [Google Scholar]
- Fanselow EE, Richardson KA, Connors BW (2008) Selective, state-dependent activation of somatostatin-expressing inhibitory interneurons in mouse neocortex. J Neurophysiol 100:2640–2652. 10.1152/jn.90691.2008 [DOI] [PMC free article] [PubMed] [Google Scholar]
- Fino E, Yuste R (2011) Dense inhibitory connectivity in neocortex. Neuron 69:1188–1203. 10.1016/j.neuron.2011.02.025 [DOI] [PMC free article] [PubMed] [Google Scholar]
- Funk CM, Honjoh S, Rodriguez AV, Cirelli C, Tononi G (2016) Local slow waves in superficial layers of primary cortical areas during REM sleep. Curr Biol 26:396–403. 10.1016/j.cub.2015.11.062 [DOI] [PMC free article] [PubMed] [Google Scholar]
- Gentet LJ, Kremer Y, Taniguchi H, Huang ZJ, Staiger JF, Petersen CC (2012) Unique functional properties of somatostatin-expressing GABAergic neurons in mouse barrel cortex. Nat Neurosci 15:607–612. 10.1038/nn.3051 [DOI] [PubMed] [Google Scholar]
- Gerashchenko D, Wisor JP, Burns D, Reh RK, Shiromani PJ, Sakurai T, de la Iglesia HO, Kilduff TS (2008) Identification of a population of sleep-active cerebral cortex neurons. Proc Natl Acad Sci U S A 105:10227–10232. 10.1073/pnas.0803125105 [DOI] [PMC free article] [PubMed] [Google Scholar]
- Hamm JP, Yuste R (2016) Somatostatin interneurons control a key component of mismatch negativity in mouse visual cortex. Cell Rep 16:597–604. 10.1016/j.celrep.2016.06.037 [DOI] [PMC free article] [PubMed] [Google Scholar]
- Harris JA, Oh SW, Zeng H (2012) Adeno-associated viral vectors for anterograde axonal tracing with fluorescent proteins in nontransgenic and cre driver mice. Curr Protoc Neurosci Chapter 1: Unit 1.20.1–18. 10.1002/0471142301.ns0120s59 [DOI] [PubMed] [Google Scholar]
- Hill DN, Mehta SB, Kleinfeld D (2011) Quality metrics to accompany spike sorting of extracellular signals. J Neurosci 31:8699–8705. 10.1523/JNEUROSCI.0971-11.2011 [DOI] [PMC free article] [PubMed] [Google Scholar]
- Hill S, Tononi G (2005) Modeling sleep and wakefulness in the thalamocortical system. J Neurophysiol 93:1671–1698. 10.1152/jn.00915.2004 [DOI] [PubMed] [Google Scholar]
- Jiang X, Shen S, Cadwell CR, Berens P, Sinz F, Ecker AS, Patel S, Tolias AS (2015) Principles of connectivity among morphologically defined cell types in adult neocortex. Science 350:aac9462. 10.1126/science.aac9462 [DOI] [PMC free article] [PubMed] [Google Scholar]
- Kapfer C, Glickfeld LL, Atallah BV, Scanziani M (2007) Supralinear increase of recurrent inhibition during sparse activity in the somatosensory cortex. Nat Neurosci 10:743–753. 10.1038/nn1909 [DOI] [PMC free article] [PubMed] [Google Scholar]
- Katona L, Lapray D, Viney TJ, Oulhaj A, Borhegyi Z, Micklem BR, Klausberger T, Somogyi P (2014) Sleep and movement differentiates actions of two types of somatostatin-expressing GABAergic interneuron in rat hippocampus. Neuron 82:872–886. 10.1016/j.neuron.2014.04.007 [DOI] [PMC free article] [PubMed] [Google Scholar]
- Kawashima T, Okuno H, Bito H (2014) A new era for functional labeling of neurons: activity-dependent promoters have come of age. Front Neural Circuits 8:37. 10.3389/fncir.2014.00037 [DOI] [PMC free article] [PubMed] [Google Scholar]
- Kilduff TS, Cauli B, Gerashchenko D (2011) Activation of cortical interneurons during sleep: an anatomical link to homeostatic sleep regulation? Trends Neurosci 34:10–19. 10.1016/j.tins.2010.09.005 [DOI] [PMC free article] [PubMed] [Google Scholar]
- Koyanagi Y, Yamamoto K, Oi Y, Koshikawa N, Kobayashi M (2010) Presynaptic interneuron subtype- and age-dependent modulation of GABAergic synaptic transmission by beta-adrenoceptors in rat insular cortex. J Neurophysiol 103:2876–2888. 10.1152/jn.00972.2009 [DOI] [PubMed] [Google Scholar]
- Krishnamurthy P, Silberberg G, Lansner A (2012) A cortical attractor network with Martinotti cells driven by facilitating synapses. PloS One 7:e30752. 10.1371/journal.pone.0030752 [DOI] [PMC free article] [PubMed] [Google Scholar]
- Krueger JM, Tononi G (2011) Local use-dependent sleep; synthesis of the new paradigm. Curr Top Med Chem 11:2490–2492. 10.2174/156802611797470330 [DOI] [PMC free article] [PubMed] [Google Scholar]
- Kubota Y, Hattori R, Yui Y (1994) Three distinct subpopulations of GABAergic neurons in rat frontal agranular cortex. Brain Res 649:159–173. 10.1016/0006-8993(94)91060-X [DOI] [PubMed] [Google Scholar]
- Laird NM, Ware JH (1982) Random effects models for longitudinal data. Biometrics 38:963–974. 10.2307/2529876 [DOI] [PubMed] [Google Scholar]
- Lee CK, Huguenard JR (2011) Martinotti cells: community organizers. Neuron 69:1042–1045. 10.1016/j.neuron.2011.03.003 [DOI] [PMC free article] [PubMed] [Google Scholar]
- Lemieux M, Chauvette S, Timofeev I (2015) Neocortical inhibitory activities and long-range afferents contribute to the synchronous onset of silent states of the neocortical slow oscillation. J Neurophysiol 113:768–779. 10.1152/jn.00858.2013 [DOI] [PMC free article] [PubMed] [Google Scholar]
- Li H, Penzo MA, Taniguchi H, Kopec CD, Huang ZJ, Li B (2013) Experience-dependent modification of a central amygdala fear circuit. Nat Neurosci 16:332–339. 10.1038/nn.3322 [DOI] [PMC free article] [PubMed] [Google Scholar]
- Ma Y, Hu H, Berrebi AS, Mathers PH, Agmon A (2006) Distinct subtypes of somatostatin-containing neocortical interneurons revealed in transgenic mice. J Neurosci 26:5069–5082. 10.1523/JNEUROSCI.0661-06.2006 [DOI] [PMC free article] [PubMed] [Google Scholar]
- Markov NT, Vezoli J, Chameau P, Falchier A, Quilodran R, Huissoud C, Lamy C, Misery P, Giroud P, Ullman S, Barone P, Dehay C, Knoblauch K, Kennedy H (2014) Anatomy of hierarchy: feedforward and feedback pathways in macaque visual cortex. J Comp Neurol 522:225–259. 10.1002/cne.23458 [DOI] [PMC free article] [PubMed] [Google Scholar]
- Massimini M, Huber R, Ferrarelli F, Hill S, Tononi G (2004) The sleep slow oscillation as a traveling wave. J Neurosci 24:6862–6870. 10.1523/JNEUROSCI.1318-04.2004 [DOI] [PMC free article] [PubMed] [Google Scholar]
- Massimini M, Ferrarelli F, Esser SK, Riedner BA, Huber R, Murphy M, Peterson MJ, Tononi G (2007) Triggering sleep slow waves by transcranial magnetic stimulation. Proc Natl Acad Sci U S A 104:8496–8501. 10.1073/pnas.0702495104 [DOI] [PMC free article] [PubMed] [Google Scholar]
- McGarry LM, Packer AM, Fino E, Nikolenko V, Sippy T, Yuste R (2010) Quantitative classification of somatostatin-positive neocortical interneurons identifies three interneuron subtypes. Front Neural Circuits 4:12. 10.3389/fncir.2010.00012 [DOI] [PMC free article] [PubMed] [Google Scholar]
- Melzer S, Gil M, Koser DE, Michael M, Huang KW, Monyer H (2017) Distinct corticostriatal GABAergic neurons modulate striatal output neurons and motor activity. Cell Rep 19:1045–1055. 10.1016/j.celrep.2017.04.024 [DOI] [PMC free article] [PubMed] [Google Scholar]
- Morairty SR, Dittrich L, Pasumarthi RK, Valladao D, Heiss JE, Gerashchenko D, Kilduff TS (2013) A role for cortical nNOS/NK1 neurons in coupling homeostatic sleep drive to EEG slow wave activity. Proc Natl Acad Sci U S A 110:20272–20277. 10.1073/pnas.1314762110 [DOI] [PMC free article] [PubMed] [Google Scholar]
- Neske GT, Patrick SL, Connors BW (2015) Contributions of diverse excitatory and inhibitory neurons to recurrent network activity in cerebral cortex. J Neurosci 35:1089–1105. 10.1523/JNEUROSCI.2279-14.2015 [DOI] [PMC free article] [PubMed] [Google Scholar]
- Nir Y, Staba RJ, Andrillon T, Vyazovskiy VV, Cirelli C, Fried I, Tononi G (2011) Regional slow waves and spindles in human sleep. Neuron 70:153–169. 10.1016/j.neuron.2011.02.043 [DOI] [PMC free article] [PubMed] [Google Scholar]
- Oláh S, Füle M, Komlósi G, Varga C, Báldi R, Barzó P, Tamás G (2009) Regulation of cortical microcircuits by unitary GABA-mediated volume transmission. Nature 461:1278–1281. 10.1038/nature08503 [DOI] [PMC free article] [PubMed] [Google Scholar]
- Oostenveld R, Fries P, Maris E, Schoffelen JM (2011) FieldTrip: open source software for advanced analysis of MEG, EEG, and invasive electrophysiological data. Comput Intell Neurosci 2011:156869. 10.1155/2011/156869 [DOI] [PMC free article] [PubMed] [Google Scholar]
- Pfeffer CK, Xue M, He M, Huang ZJ, Scanziani M (2013) Inhibition of inhibition in visual cortex: the logic of connections between molecularly distinct interneurons. Nat Neurosci 16:1068–1076. 10.1038/nn.3446 [DOI] [PMC free article] [PubMed] [Google Scholar]
- Pinto L, Dan Y (2015) Cell-type-specific activity in prefrontal cortex during goal-directed behavior. Neuron 87:437–450. 10.1016/j.neuron.2015.06.021 [DOI] [PMC free article] [PubMed] [Google Scholar]
- Quiroga RQ, Nadasdy Z, Ben-Shaul Y (2004) Unsupervised spike detection and sorting with wavelets and superparamagnetic clustering. Neural Comput 16:1661–1687. 10.1162/089976604774201631 [DOI] [PubMed] [Google Scholar]
- Silberberg G, Markram H (2007) Disynaptic inhibition between neocortical pyramidal cells mediated by Martinotti cells. Neuron 53:735–746. 10.1016/j.neuron.2007.02.012 [DOI] [PubMed] [Google Scholar]
- Stark E, Roux L, Eichler R, Senzai Y, Royer S, Buzsáki G (2014) Pyramidal cell-interneuron interactions underlie hippocampal ripple oscillations. Neuron 83:467–480. 10.1016/j.neuron.2014.06.023 [DOI] [PMC free article] [PubMed] [Google Scholar]
- Steriade M. (2000) Corticothalamic resonance, states of vigilance and mentation. Neuroscience 101:243–276. 10.1016/S0306-4522(00)00353-5 [DOI] [PubMed] [Google Scholar]
- Stryker MP. (2014) A neural circuit that controls cortical state, plasticity, and the gain of sensory responses in mouse. Cold Spring Harb Symp Quant Biol 79:1–9. 10.1101/sqb.2014.79.024927 [DOI] [PMC free article] [PubMed] [Google Scholar]
- Taniguchi H, He M, Wu P, Kim S, Paik R, Sugino K, Kvitsani D, Fu Y, Lu J, Lin Y, Miyoshi G, Shima Y, Fishell G, Nelson SB, Huang ZJ (2011) A resource of Cre driver lines for genetic targeting of GABAergic neurons in cerebral cortex. Neuron 71:995–1013. 10.1016/j.neuron.2011.07.026 [DOI] [PMC free article] [PubMed] [Google Scholar]
- Tremblay R, Lee S, Rudy B (2016) GABAergic Interneurons in the neocortex: from cellular properties to circuits. Neuron 91:260–292. 10.1016/j.neuron.2016.06.033 [DOI] [PMC free article] [PubMed] [Google Scholar]
- Urban DJ, Roth BL (2015) DREADDs (designer receptors exclusively activated by designer drugs): chemogenetic tools with therapeutic utility. Annu Rev Pharmacol Toxicol 55:399–417. 10.1146/annurev-pharmtox-010814-124803 [DOI] [PubMed] [Google Scholar]
- Urban-Ciecko J, Barth AL (2016) Somatostatin-expressing neurons in cortical networks. Nat Rev Neurosci 17:401–409. 10.1038/nrn.2016.53 [DOI] [PMC free article] [PubMed] [Google Scholar]
- Urban-Ciecko J, Fanselow EE, Barth AL (2015) Neocortical somatostatin neurons reversibly silence excitatory transmission via GABAb receptors. Curr Biol 25:722–731. 10.1016/j.cub.2015.01.035 [DOI] [PMC free article] [PubMed] [Google Scholar]
- Volgushev M, Chauvette S, Mukovski M, Timofeev I (2006) Precise long-range synchronization of activity and silence in neocortical neurons during slow-wave oscillations [corrected]. J Neurosci 26:5665–5672. 10.1523/JNEUROSCI.0279-06.2006 [DOI] [PMC free article] [PubMed] [Google Scholar]
- Vyazovskiy VV, Riedner BA, Cirelli C, Tononi G (2007) Sleep homeostasis and cortical synchronization: II. A local field potential study of sleep slow waves in the rat. Sleep 30:1631–1642. 10.1093/sleep/30.12.1631 [DOI] [PMC free article] [PubMed] [Google Scholar]
- Vyazovskiy VV, Faraguna U, Cirelli C, Tononi G (2009a) Triggering slow waves during NREM sleep in the rat by intracortical electrical stimulation: effects of sleep/wake history and background activity. J Neurophysiol 101:1921–1931. 10.1152/jn.91157.2008 [DOI] [PMC free article] [PubMed] [Google Scholar]
- Vyazovskiy VV, Olcese U, Lazimy YM, Faraguna U, Esser SK, Williams JC, Cirelli C, Tononi G (2009b) Cortical firing and sleep homeostasis. Neuron 63:865–878. 10.1016/j.neuron.2009.08.024 [DOI] [PMC free article] [PubMed] [Google Scholar]
- Wang Y, Toledo-Rodriguez M, Gupta A, Wu C, Silberberg G, Luo J, Markram H (2004) Anatomical, physiological and molecular properties of Martinotti cells in the somatosensory cortex of the juvenile rat. J Physiol 561:65–90. 10.1113/jphysiol.2004.073353 [DOI] [PMC free article] [PubMed] [Google Scholar]
- Wang Y, Neubauer FB, Lüscher HR, Thurley K (2010) GABAB receptor-dependent modulation of network activity in the rat prefrontal cortex in vitro. Eur J Neurosci 31:1582–1594. 10.1111/j.1460-9568.2010.07191.x [DOI] [PubMed] [Google Scholar]
- Wess J, Nakajima K, Jain S (2013) Novel designer receptors to probe GPCR signaling and physiology. Trends Pharmacol Sci 34:385–392. 10.1016/j.tips.2013.04.006 [DOI] [PMC free article] [PubMed] [Google Scholar]
- Xu H, Jeong HY, Tremblay R, Rudy B (2013) Neocortical somatostatin-expressing GABAergic interneurons disinhibit the thalamorecipient layer 4. Neuron 77:155–167. 10.1016/j.neuron.2012.11.004 [DOI] [PMC free article] [PubMed] [Google Scholar]
- Xu M, Chung S, Zhang S, Zhong P, Ma C, Chang WC, Weissbourd B, Sakai N, Luo L, Nishino S, Dan Y (2015) Basal forebrain circuit for sleep–wake control. Nat neuroscience 18:1641–1647. 10.1038/nn.4143 [DOI] [PMC free article] [PubMed] [Google Scholar]
- Zsiros V, Maccaferri G (2008) Noradrenergic modulation of electrical coupling in GABAergic networks of the hippocampus. J Neurosci 28:1804–1815. 10.1523/JNEUROSCI.4616-07.2008 [DOI] [PMC free article] [PubMed] [Google Scholar]