Abstract
Species as evolutionary lineages are expected to show greater evolutionary independence from one another than are populations within species. Two measures of evolutionary independence that stem from the study of isolation-with-migration models, one reflecting the amount of gene exchange and one reflecting the time of separation, were drawn from the literature for a large number of pairs of closely related species and pairs of populations within species. Both measures, for gene flow and time, showed broadly overlapping distributions for pairs of species and for pairs of populations within species. Species on average show more time and less gene flow than populations, but the similarity of the distributions argues against there being a qualitative difference associated with species status, as compared to populations. The two measures of evolutionary independence were similarly correlated with FST estimates, which in turn also showed similar distributions for species comparisons relative to population comparisons. The measures of gene flow and separation time were examined for the capacity to discriminate intraspecific differences from interspecific differences. If used together the two measures could be used to develop an objective (in the sense of being repeatable) measure for species diagnosis.
Keywords: divergence, gene flow, species diagnosis, species problem, isolation with migration, FST
Introduction
Let us take as given, at least for the sake of the argument, that biological diversity is structured hierarchically, and that near or at the bottom of the hierarchy there are real boundaries between groups of similar and genetically related organisms - groups that we may call species. How might we identify these real boundaries and thereby objectively delimit species? For this paper we approach this apparently eternal question by asking: what is it that species have that populations within species do not have? To phrase it differently, is there a way in which two populations of the same species are disjunct, that is less than or different from the way that two sister species are disjunct? If we could identify that difference, in theory and in application, then we could lay some claim to objectivity when we engage in species diagnosis.
On the theoretical side the traditional answer is that two species are on separate evolutionary trajectories, whereas populations within species, while they may show a little divergence, are not evolving independently of each other. Species are thought to be genetically separate enough that the processes of mutation, natural selection and genetic drift that affect one species are not shared by other species. This evolutionary independence of separate species can also be described as the presence of some sort of barrier to reproduction between the members of different species. If two populations belong to the same species then they do not have an impediment to reproduction and together they share in the larger evolutionary process of the single species of which both are a part.
This introduction refers to objectivity as if it is a desirable property, as does much of the literature on species delimitation (e.g. Mayr 1942; Simpson 1961; Hennig 1966; Stuessy 1990; Winston 1999). But over the years objectivity has been called for with at least two meanings that differ in important ways (Simpson 1961; Sokal and Camin 1965; Ghiselin 1966; Darlington 1971). The differences between the two kinds of objectivity depend on the way that species differences are not the same as population differences. The first kind of objectivity arises if species differences are qualitatively distinct from the differences between populations. To be clear, the discrepancy that is being addressed is not that which occurs between two species or between two populations, but rather it is the way that species differences are dissimilar from population differences. If this distinction is qualitative, then a truly objective process of delimiting species would be effective for discovering instances of this species-specific type of discontinuity. The second kind of objectivity arises if the distinction (i.e. between species differences and population differences) is not a qualitative one but is instead a quantitative one. This would be the case if the differences between sister species are just more of the same kind of discontinuity as occurs between populations within species, in which case nature cannot tell us just where to draw the line. Darwin famously wrote of just this kind of quantitative spectrum, of how in his view the differences between species lie on the same continuum as the differences between varieties (Darwin 1859, p. 48). Many others have also expressed skepticism that the boundaries between species are different in kind from discontinuities found on a finer scale (e.g. Levin 1979; Mishler 1999; Hendry et al. 2000; Pleijel and Rouse 2000; Baum 2009). In this view of Darwin and others, a claim of objectivity for a particular protocol for species delimitation tends to mean, not that it identifies the true joints in nature, but just that it is repeatable. A protocol for species diagnosis could in principle be repeatable, in the sense that different investigators would be expected to reach the same conclusions, if the specifics of that protocol were clearly defined in terms of assumptions, sampling methods and criteria.
If we suppose that we can, at least in principle, achieve the first kind of objectivity (i.e. if species differences are qualitatively distinct from the differences between populations) then we are effectively supposing that a taxonomic rank of species has some true grounding in the way that biological diversity is structured. However if the separation between species is not different in kind than what occurs for populations, then nature does not justify for us the special, basal rank of species. We might still use the species rank for many purposes, and we might even do so with high repeatability if we somehow came to consistently follow a common set of rules, but we would do so for pragmatic, human reasons.
The first purpose of this paper is to ask whether there is evidence that the evolutionary discontinuity between closely related species is different from the discontinuity found between populations within species. The basic approach is very simple. For a given measure of evolutionary independence, we plot the distribution of scores generated for pairs of populations and compare it to the same distribution generated from pairs of closely related species. The second goal of this paper is to consider the utility of population genetic-based measures of evolutionary independence for species diagnosis.
ASSESSING EVOLUTIONARY INDEPENDENCE
In practice most species are identified on the basis of a finding of divergence: typically morphological differentiation; although increasingly genetic divergence alone may be used for diagnosing species. An observation that divergence has occurred by evolution (e.g. in genes or in traits that can be assumed to have a heritable basis) represents prima facie evidence of evolutionary independence. However divergence in some traits or genes can occur in the absence of evolutionary independence, for example due to natural selection acting differently in two populations that are exchanging genes. In general it is quite difficult to decide just how much divergence, and in what kinds of traits or genes, one must observe in order to have an objective criterion for species diagnosis. Here we address the matter of evolutionary independence, as a basis for species diagnosis, using a population genetic approach.
If the individuals of two populations sometimes reproduce together then they will share genetic variation and to some degree share in the processes of genetic drift and fixation of beneficial mutations. Wright (1931) showed how the allele frequency distribution of a population can be strongly shaped by gene exchange with other populations. Whether or not genetic drift, or the immigration of genes, plays a greater factor in shaping local allele frequencies depends upon the population migration rate, or 2NM, where N is the effective size of a diploid population and M is the migration rate per gene copy per generation. When 2NM < 1 (i.e. the rate of influx of genes from another population is low relative to the rate of genetic drift) then allele frequencies within the population can vary from those of the source population, but when 2NM > 1 the allele frequencies of the receiving population are more likely to track those of the source population (Felsenstein 1976; Slatkin 1985). In other words, population genetic theory suggests a threshold for the population migration rate below which populations are evolutionarily independent. In fact a migration-based criterion based on this idea has been suggested for species delimitation (Porter 1990). The major difficulty in using a migration rate-based measure of evolutionary independence is that it is difficult to estimate 2NM in a way that separates it from other factors associated with divergence (e.g. Whitlock and McCauley 1999).
A key factor that arises when trying to estimate gene exchange, or indeed any measure of evolutionary independence, is the time span under consideration. To see this consider the question: would we count as being independent two populations that have been completely separated from each other for just one generation? Perhaps yes, but the difficulty is that over such a short time scale the very meaning of “population” may become questionable. Unless there is true panmixia within a species, then over a short time frame a single species may resemble a very large number of very local demes that intermittently exchange genes. Even at the microevolution level within populations, evolution is usually thought of as a slow process, with natural selection, genetic drift, and gene exchange having cumulative impacts on allele frequencies rather than instantaneous ones. The slow pace of evolution invokes for us the need to consider some kind of time frame for assessing evolutionary independence.
If two populations are separated for some time with low or zero gene exchange then divergence begins to happen, first in terms of shifting allele frequencies and the arrival of population-specific mutations, and then later in terms of the fixation of different alleles by genetic drift and natural selection. If some divergence is observed, then it probably arose in the presence of evolutionary independence that persisted for some time. Something like this argument seems to have been the motivation for a fairly large number of methods for species diagnosis that are based upon the discovery of divergence in some form or another (Sites and Marshall 2004). More recently sophisticated methods, that rely on population genetic theory and likelihood calculations, take this general approach for species delimitation to a new level (Knowles and Carstens 2007; Ence and Carstens 2010; Hausdorf and Hennig 2010; Yang and Rannala 2010).
Divergence is certainly expected to be a salient indicator of evolutionary independence, but by itself divergence is expected to be misleading in some situations. Consider that two populations that exchange genes at a low level for a long period of time will reach some steady state level of divergence (Wright 1931, 1943), while two populations that have been completely separated from each other for a lesser period of time may show the same amount of divergence. In the latter case, evolutionary independence is complete and divergence will continue, whereas in the former case with gene exchange, it will not. Yet a single indicator of divergence might lead to the same species diagnosis in both cases.
The Isolation with Migration (IM) model offers a means to assess jointly two different components of evolutionary independence: time of separation; and the degree of gene exchange (Wakeley and Hey 1998; Nielsen and Wakeley 2001). As shown in Figure 1, the units of the six parameters of the IM model are all expressed in mutations (4N1u, 4N2u, 4NAu and tu) or per mutation (M1/u and M2/u). To estimate the population migration rate for a population we use the estimated population mutation rate for that population as well as the estimated rate of gene flow into that population, i.e. 2N1M1 = M1/u × 4N1u/2 and 2N2M2 = M2/u × 4N2u/2. To estimate the time of population separation on a scale that reflects the amount of genetic drift that has occurred since separation, we estimate time in units of 2N generations, i.e. τ1 = tu/4N1u/2 and τ2 = tu/4N2u/2 (note that although there is only 1 estimate of tu, there are two values of τ because there are two values of 4Nu, one for each of the two sampled populations). Both 2NM and τ are functions of the effective number of gene copies at a locus, 2N, assuming diploidy.
Figure 1.
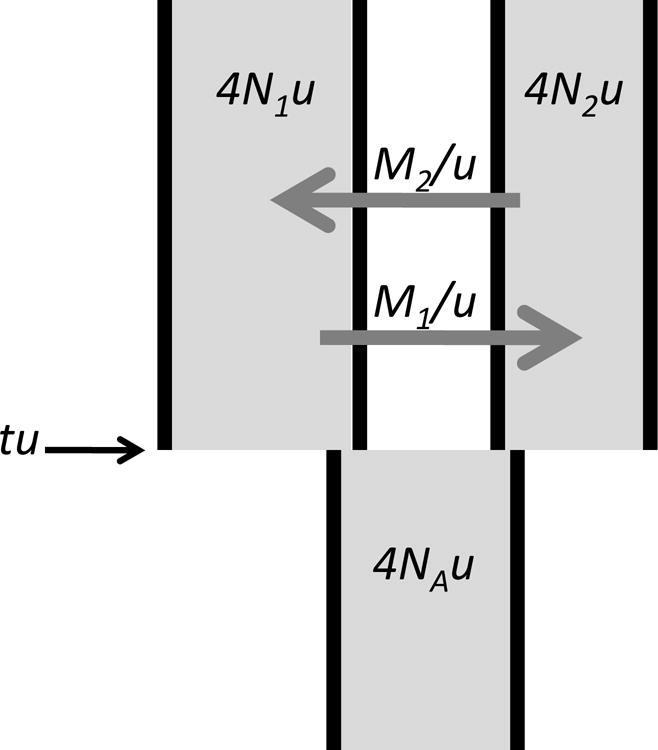
The Isolation with Migration Model, as parameterized by Hey and Nielsen (2004). N is an effective population size, shown for both sampled populations and the ancestor. M is the migration rate per gene copy per generation. t is the time in generations since the ancestor split into two populations. u is the neutral mutation rate. The directionality of migration is shown in the traditional coalescent direction (i.e. as if time is increasing back into the past).
Data and Methods
A literature review was undertaken to identify studies that estimated the parameters of the IM model for closely related species or populations. These studies were selected based on a search of the Web of Science database for papers that appeared before January 1, 2011, for articles citing at least one of the various implementations that estimate the parameters of the IM model. Reports were included if they involved analyses of populations within a species or of two or more species that were very closely related. Reports were not included in the present study if (1) populations were identified using only the same data that was used in the IM analysis; (2) there were additional, more complete studies involving the same taxa; (3) the authors failed to report at least one of the five IM model parameter values other than that for the ancestral population size; and (4) parameter values were expressed in units from which it was not possible to calculate values for 2NM and τ. Details on the values used from each study are provided in Supplementary Table 1. A total of 97 reports met these criteria and were included in this study. Several tools have been developed for estimating the parameters of the IM model (Nielsen and Wakeley 2001; Hey and Nielsen 2004; Becquet and Przeworski 2007; Hey and Nielsen 2007; Gutenkunst et al. 2009; Lopes et al. 2009; Wang and Hey 2010), and reports were eligible for inclusion in this study regardless of the method used for estimating the parameters of the IM model. The large majority of the studies used the IM (Hey and Nielsen 2004) or IMa (Hey and Nielsen 2007) computer programs. Table 1 lists the number of reports and the number of measurements used for this study.
Table 1.
Sample Sizes
| Number of entities in IM analyses (two for each analysis) | |||||
|---|---|---|---|---|---|
| Taxonomic Group | Number of Reports | Number of IM analyses | Species | Populations | Subspecies |
| ALL | 97 | 178 | 100 | 240 | 16 |
| Birds | 16 | 23 | 16 | 28 | 2 |
| Insects | 17 | 22 | 26 | 16 | 2 |
| Mammals | 18 | 31 | 18 | 36 | 8 |
| Plants | 13 | 21 | 16 | 24 | 2 |
| others | 33 | 81 | 24 | 136 | 2 |
Because the focus of this paper is on the distinction that is associated with a basal taxonomic rank, populations were taken to be any grouping within a species that was not described with some formal taxonomic status. Thus host races within species were treated as populations, as were populations identified simply on the basis of geography. In many cases there was clear evidence prior to the study that some divergence had taken place between populations, such as mtDNA divergence or morphological differentiation. In other cases the presence of geographic barriers provided indirect evidence that some divergence may have occurred. One concern is that the studies included here vary widely in the degree to which there was previous evidence that population designations were merited. The heterogeneity in how investigators use the “population” label will contribute some variance to the comparison with other studies conducted under the “species” label that has a more formal meaning. A related but different concern applies to the species designations. Ideally this study would be conducted using only sister species comparisons because it is these cases that are closest to whatever threshold distinguishes the differences between populations from those that distinguish species. However when there are multiple closely related species it is quite difficult to identify sister species, particularly in those cases where gene exchange might be ongoing. Here we have included studies using populations, regardless of the prior evidence in support of those designations, and we have included studies using closely related species pairs, even when there is the possibility that the two species are not sisters. Presumably both kinds of inclusivity will add to the variance of measures of evolutionary independence, and both are expected to contribute to the appearance of a greater difference, between the species and the populations, than would be observed without such inclusion.
NON-INDEPENDENCE OF OBSERVATIONS
There are several kinds of non-independence among the 2NM and τ observations used here. Many studies report analyses of multiple pairs of closely related populations or species, and the results may not be independent of each other for two reasons. First there may be correlations across the different IM analyses done on a group of populations or species, due to underlying variation in degrees of divergence (i.e. akin to non-independence due to underlying phylogeny). Second, correlations will be present because some populations or species are used in multiple pairwise IM analyses. For these reasons, in cases involving studies with k species or populations, we randomly selected a subset of k-1 pairwise analyses.
Yet another kind of non-independence arises between the estimates of 2NM and τ. Both of these quantities are estimated for each sampled population or species in an IM analysis, and so each analysis contributes two values for each quantity to the overall picture. However the values for one population or species in an IM analysis are not independent of the values for the second. The rank correlation between 2N1M1 and 2N2M2, across all the IM analysis included in this study, was 0.393. For τ1 and τ2 the rank correlation is quite high at 0.651 at least partly because each pair of values depends on a single estimate of tu. There is also a negative correlation between the 2NM and τ values for a population or species (−0.323), possibly for biological reasons but certainly also because both include in their calculation the estimated population mutation rate 4Nu.
Because of the several kinds of non-independence it is difficult to make quantitative statistical statements and we do not attempt to do so in this study. Our approach is to draw from a large sample of analyses in the literature and then to show results and discuss apparent patterns for those comparisons that have a large number of observations.
Another important factor shaping the qualitative nature of our results is that methods for estimating confidence intervals or credibility intervals in the parameters of the IM model generally do not yet provide means to estimate intervals for ratios or products of pairs of parameters. For this reason we do not make use of the confidence intervals or credible intervals that typically accompanied the parameter estimates reported in the studies used here.
ESTIMATES OF FST
The most widely used summary measure of population divergence is the fixation index FST. Sewall Wright (1951) defined fixation indices, including FST, as inbreeding coefficients, meaning they are direct functions of the actual heterozygosity and the heterozygosity that is expected on the basis of random mating. FST in particular was defined as the loss of heterozygosity within a subpopulation, relative to the entire population, due to allele frequency differences between subpopulations. Wright originally described the fixation indices as if they were parameters in a simple model of structured populations. In the decades following Wright’s definition of fixation indices, three different kinds of developments have necessarily, and considerably, complicated their use. (1) Investigators have derived expected values of FST and other indices under models that differ from Wright’s original model. For example FST has been described as a function of steady gene exchange (Wright 1931, 1951) or as a function of the time of population separation with no gene exchange (Takahata 1993). (2) Because Wright’s original formulation was only accurate if heterozygosities and allele frequencies were known without error, it has been necessary to develop estimators of FST (Weir and Cockerham 1984), and these can vary depending on the assumed model of differentiation. And finally (3) other hierarchical measures of population structure have been developed that share many of the features of Wright’s fixation indices but that have other interpretations. Among the latter, it is particularly common to use measures that partition the amount of gene divergence (e.g. coalescent time, or estimated mutations since coalescent time) into a series of hierarchical statistics (Excoffier et al. 1992; Hudson et al. 1992; Slatkin 1995) that are closely analogous to Wright’s fixation indices.
Many of the studies that conducted IM analyses and that are included here also reported an estimated value for FST, or an FST analog. Among the estimators most commonly used were those of Hudson, Slatkin and Maddison (1992), Weir and Cockerham (1984), and the AMOVA-based estimator of Excoffier, Smouse and Quattro (1992). Details on the calculations and the specific estimator used in each paper are provided in a supplementary table. Regardless of the particular measure used, care was taken to make sure that the estimated proportion of variation (i.e. the divergence value) pertained to the differentiation between the specific pair of populations or species in the reported IM analysis. For studies with multiple loci, and in which an FST measure was reported for each locus, we used the mean of the reported values. If different measures of FST were provided we used that measure that was based on the most complete model, both in terms of levels of hierarchical structure and divergence between gene copies. For many of the studies that did not report values, FST values were provided by the authors upon request.
Results
From the 97 studies, a total of 178 IM analyses were selected based on the criteria described in the methods. Figure 2 shows histograms for 2NM and τ for all of these analyses. Both measures varied over very similar scales, with close to half the values for both measures falling in the lowest bin of the histograms. For this reason, in Figure 2 as well as other histograms for 2NM and τ, we have plotted counts in bins over two ranges, below a value of 0.5 and above the value of 0.5, and all values are shown as a percentage of the total (with sample sizes given in the legend of the figure). Also shown in Figure 2 are histograms for just those studies that met specific criteria, including those based on having at least 5 or 10 loci. Studies with more loci are expected to have better estimates of the parameters in the IM model. Also plotted in the upper part of Figure 2 are values for 2NM for just those studies in which the τ estimate was greater than 0.2. In our experience of IM analyses, a migration rate estimate typically has a large variance when the splitting time is very low, unless a large amount of data has been used. As expected the histograms for all of the values (n=356) generally had the highest variance, as shown by the presence of high values in the lowest and highest bins, however the effect of reducing the sample size based on the number of loci or, in the case of 2NM, on the basis of τ values was modest.
Figure 2.
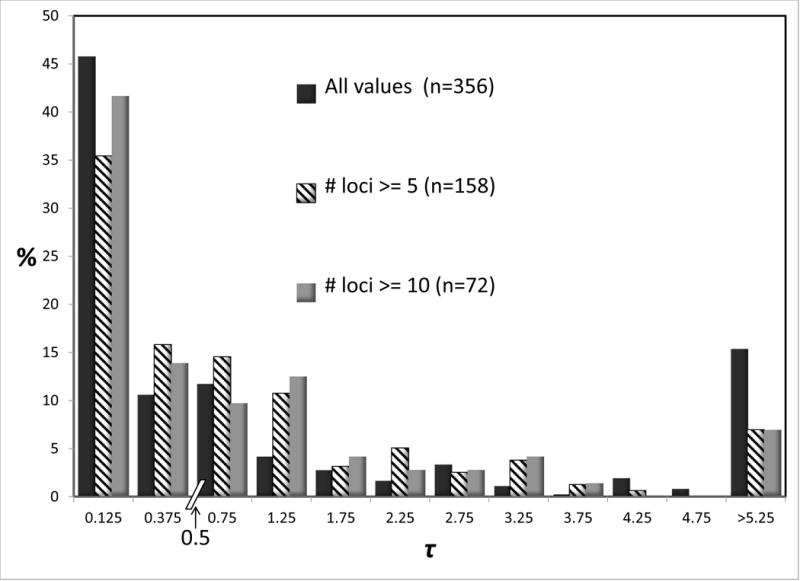
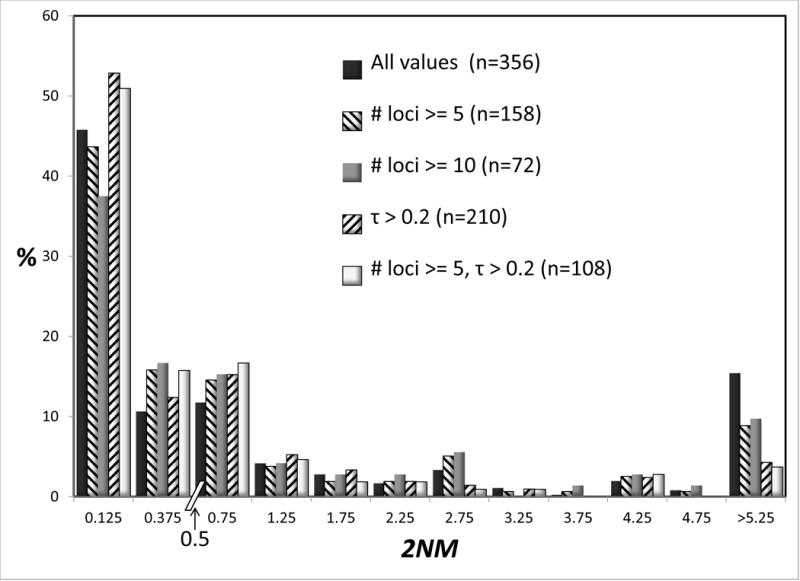
Percentages of observations for 2NM (top) and τ (bottom). Because of varying sample sizes, percentages rather than actual counts are used to make comparisons easier. Sample sizes are given in parentheses. Each chart has two bins, each of width 0.25, for values below 0.5. Above 0.5 bins have a width of 0.5. Values are shown for all of the data, and when only a subset of studies are included, as described in the legend.
Figure 3 shows histograms for 2NM and τ for species, subspecies, and populations. Both quantities vary over similar scales, with modes at the lowest values in both charts for all three groups. For 2NM the distribution for species is shifted to the left, relative to the distribution for populations. For τ the distribution for species is shifted to the right, relative to that for populations. Both patterns are consistent with populations being less evolutionarily independent of one another, compared to species. Focusing on the threshold value of 1.0 for 2NM, the total percentage of values that are less than 1.0 is 82.0 for species, and 61.6 for populations. Many studies relied exclusively on mitochondrial DNA, and we wondered if such studies show a qualitatively different kind of frequency distribution for 2NM and of τ. However the patterns found in Figure 3 are very similar to those found if we limit summaries to just studies that used only a single mtDNA locus (Supplementary Figure 1).
Figure 3.
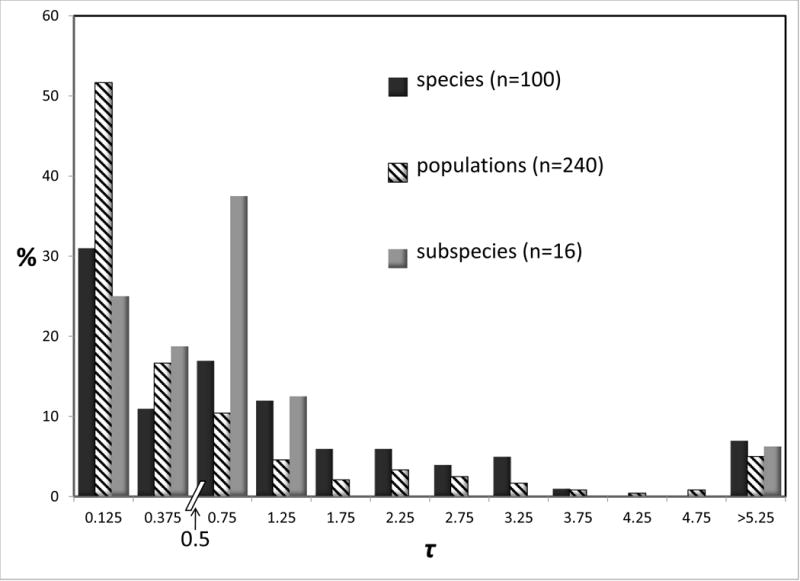
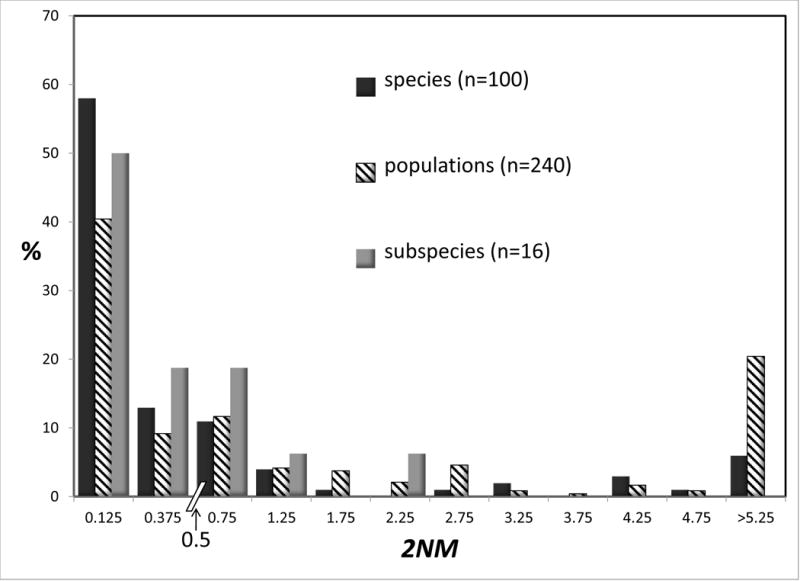
Percentages of observations for 2NM (top) and τ (bottom) by rank (species, population, or subspecies). See legend to Figure 2 for additional explanation.
There were a total of 16 subspecies in the data set (8 IM analyses involving pairs of subspecies). The distributions for subspecies, for both 2NM and τ, resemble those for species more than they resemble the distributions for populations (Figure 3). The subspecies rank, unlike the species rank, has no theoretical justification, and the utility of the rank of subspecies has often been questioned (Mayr 1982; Ryder 1986; O’Brien and Mayr 1991; Zink 2004; Phillimore and Owens 2006). Notwithstanding the lack of theoretical justification, subspecies are formally recognized basal taxa, and so as with the species rank we would like to see how they compare with populations. For the remainder of the analyses in this study we elected to pool the subspecies with the species.
Some large taxonomic groups were represented numerous times in the data set, and for these it is possible to compare the distributions for 2NM and τ, for species and populations. Figures 4 and 5 shows these distributions for all groups that are represented by 15 or more values. Given the modest sample sizes in some cases and the non-independence issues, we draw attention to just the few most striking differences between taxonomic groups. At the species level the 2NM distributions are roughly similar across Insects, Birds, Mammals, and Plants; although several of the 16 bird analyses returned high values. The τ distributions for species vary considerably, although again the bird species returned an abundance of high values. At the population level there is rough similarity for τ across the groups. However for 2NM the population histograms varied considerably across, with the Mammal and especially the Bird populations having a 2NM distribution with fewer low values, and more intermediate or high values, than the other groups.
Figure 4.
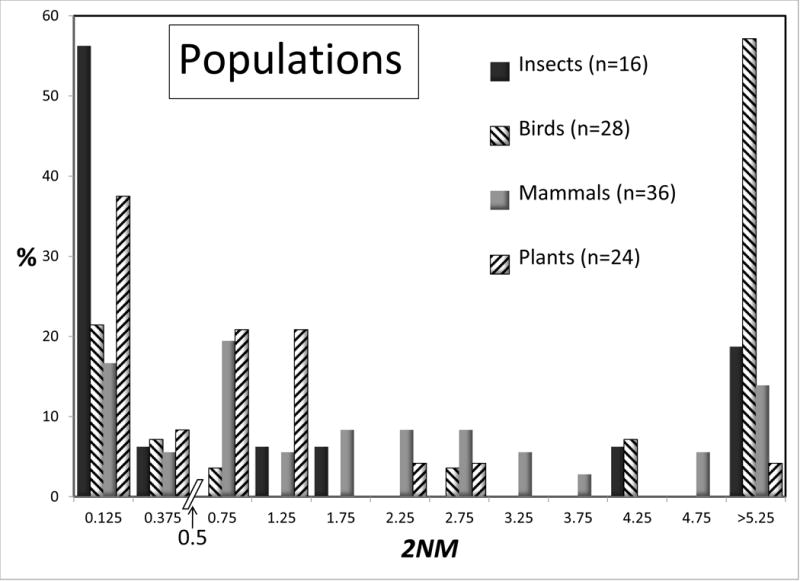
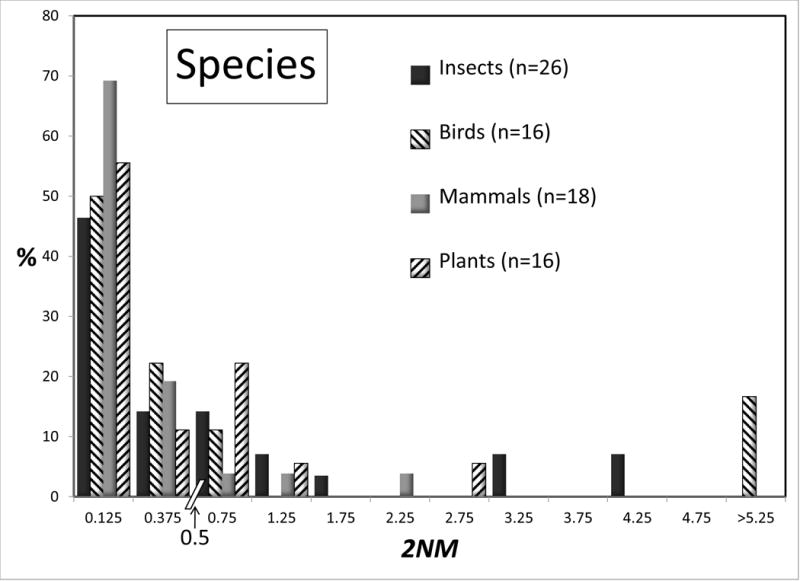
Percentages of observations for 2NM for species (top) and populations (bottom) for different groups of organisms. All groups with 15 or more observations are shown. See legend to Figure 2 for additional explanation.
Figure 5.
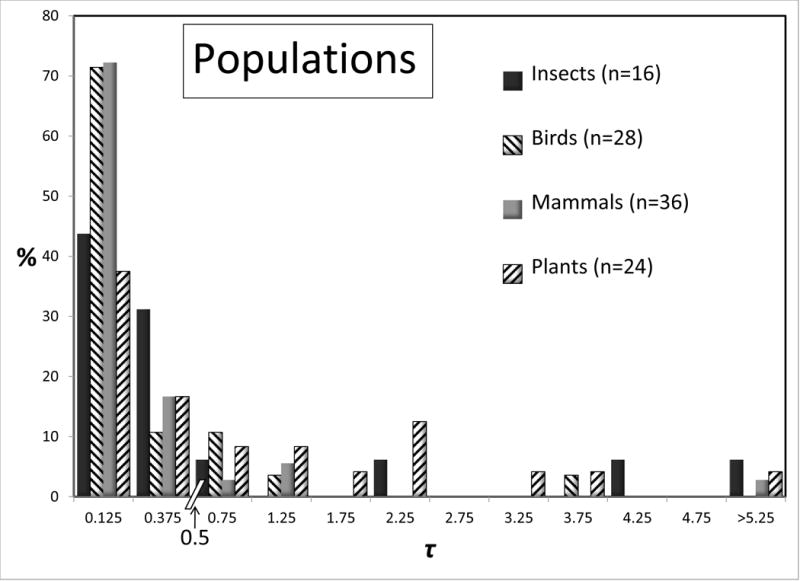
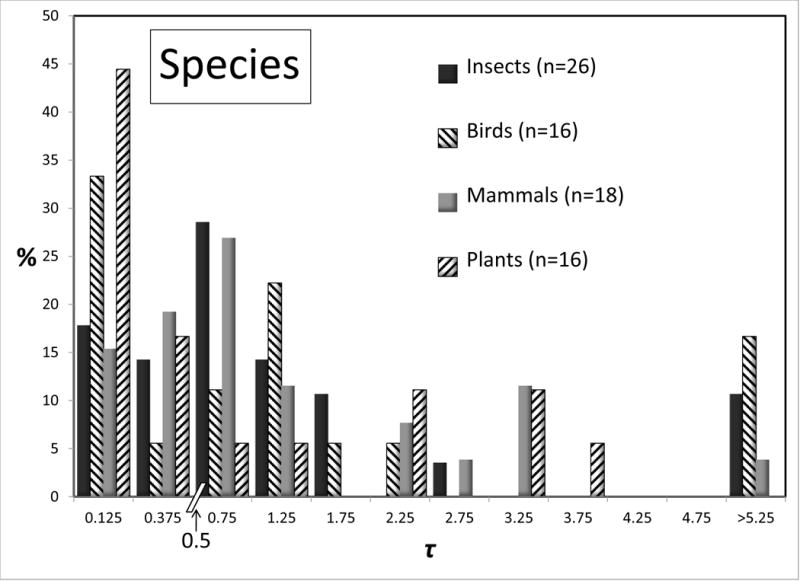
Percentages of observations for τ for species (top) and populations (bottom) for different groups of organisms. All groups with 15 or more observations are shown. See legend to Figure 2 for additional explanation.
An estimate of FST or a close analog (Nei 1973; Excoffier et al. 1992; Hudson et al. 1992; Slatkin 1995) was obtained for a majority of the studies (either from the original report or via a request to the authors), specifically for those pairs of units that were subjected to IM analysis. A histogram of values for both the populations and species groups (Figure 6 top) shows broad overlap, with the distribution for species shifted to the right, relative to that for populations. The correlation between 2NM and FST was - 0.097 and between τ and FST it was 0.044. However because of the differing distributions, with FST constrained to be between 0 and 1, it may be more useful to consider the rank correlations which are considerably stronger at −0.486 and 0.479 (and quite similar), for 2NM and τ respectively. In calculating these correlations, each FST value appears twice because each IM analysis generates a pair of 2NM and τ values.
Figure 6.
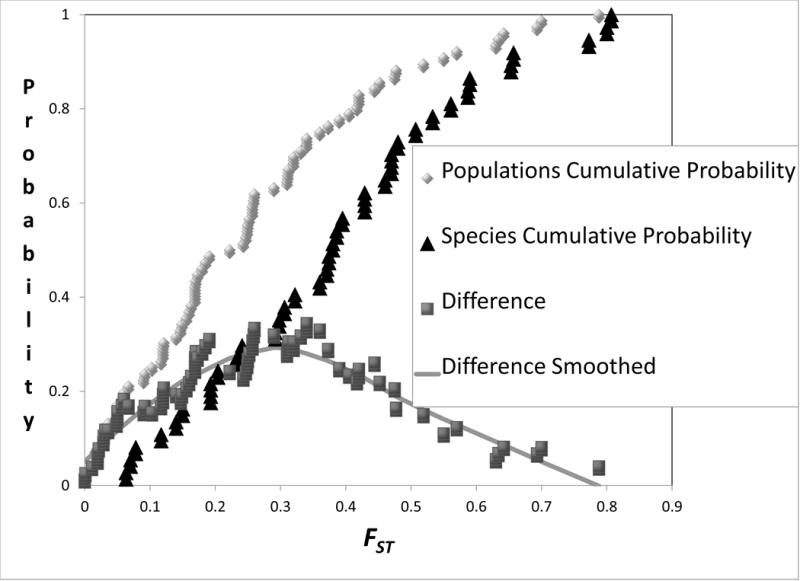
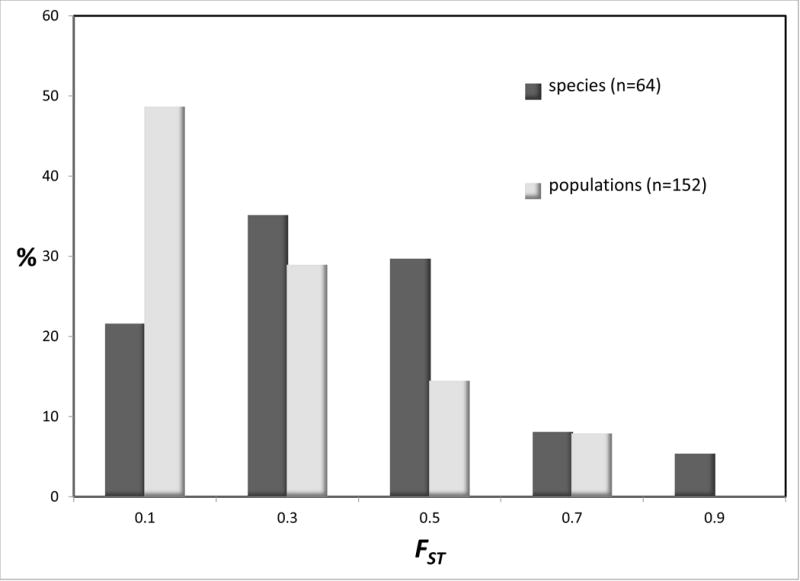
Histograms (top) and cumulative distributions (bottom) for FST. For the histograms (top) values shown are the percentages of observations for FST for species and populations. For the cumulative distributions (bottom) values are shown together with the difference between the two. To determine the difference, each point in the cumulative distribution for populations was paired with the value from the cumulative difference in species that has the closest corresponding FST value. A smoothed curve was added for the difference using locally weighted scatterplot smoothing (Cleveland and Devlin 1988).
Discussion
An important tradition of discussion on the nature of species holds that different species are evolutionarily independent of one another (e.g. Simpson 1951; Wiley 1978; Templeton 1989; Zink and McKitrick 1995; Mayden 1997; de Queiroz 1998; Rieseberg et al. 2006). Another tradition, neither distinct from nor as large as that regarding evolutionarily independence of species, holds that the rank of species is unique among taxonomic ranks because species are less inclusive than are instances of any other taxonomic ranks (Cracraft 1989; Kluge 1990; Nixon and Wheeler 1990; Mishler 1999). And yet another tradition, larger than either of these, has species as the fundamental units of biological diversity (although the context and ontogenetic claims for such units vary widely). Then, if the idea of evolutionary independence does indeed capture the essence of the species rank, it should be possible to observe some substantive differences for measures of evolutionary independence, when pairs of closely related species are compared to pairs of intraspecific populations.
Based on 2NM and τ the differences between closely related species do not appear to be qualitatively distinct relative to those observed between populations within species. In particular there are no differences in modal values, nor strong differences in the shapes of distributions. The overall picture is one of modest quantitative differences, in which the distribution of the time measure is shifted to the right, and the distribution of the migration measure is shifted to the left, for species relative to populations (Figure 3). In terms of seeking objectivity in species delimitation, we find no evidence using 2NM and τ that the species rank is associated with a distinctive feature of evolutionary independence. To put it another way, the evidence presented here does not support the idea that a basal taxonomic rank is justifiable on the basis of a distinctive feature of the way genetic variation is structured in nature. In the past related arguments have been used to say that species are not real, with the specific meaning that the rank of species does not denote a particular feature in nature, and that species diagnosis must be done based on pragmatic considerations (Darwin 1859; Ehrlich and Raven 1969; Levin 1979; Nelson 1989; Bachmann 1998; Baum 2009). It is the species rank that is called into question by this argument, not the reality of individual species. Even in the absence of an objective criterion for the species rank, it can be argued that an individual species may be real by virtue of the evolutionary processes occurring within, and the degree of evolutionary independence from other such units.
The results shown in Figure 2, restricting results to studies with larger sample sizes and for 2NM values in cases of higher estimates of τ, suggest that the broad overlap of distributions is not caused by a high variance in the estimates making up each distribution. Although we do not have access to individual confidence intervals or credible intervals for individual values of 2NM and τ, the lack of change in the overall distributions of these parameters as a function of sample sizes (Figure 2) argues against a high variance for individual estimates being the root cause for why the distributions, for species and populations, broadly overlap.
The broad similarity between 2NM and τ for species and for populations is surprising in light of previous studies that have done similar analyses using a single measure of divergence. Thorpe (1982; 1983) plotted the distribution of a measure of genetic identify (Nei 1972), for a large number of allozyme studies, and reported nearly disjunct distributions for intraspecific comparisons and interspecific comparisons. Thorpe’s distributions may have been shaped to some extent by the exclusion of some comparisons (Harrison 1991; van der Bank et al. 2001) ; for example, Thorpe excluded studies on birds on the basis that they showed anomalous genetic identify values. A later study, similar to Thorpe’s, but focusing exclusively on plants found much more overlap (though not as much as found here for 2NM and τ) in the distributions for species pairs and population pairs (van der Bank et al. 2001).
The question of differences, between species pairs and population pairs, also arises in the literature on DNA barcoding. A growing database of sequences of specific portions of the mitochondrial or plastid genomes (for animals and higher plants, respectively) can be used for rapid DNA sequence-based taxonomic identification of samples. Hebert et al., (2004) reported markedly disjunct distributions for a portion of the mitochondrial cytochrome c oxidase I (COI) gene for comparisons within species and comparisons between species, similar to the distributions found by Thorpe (1982; 1983). However much of the “barcoding gap” has been revealed as a byproduct of how species pairs are sampled. When only sister species comparisons are used to compare with intraspecific differences, the overlap in the distribution of DNA sequence differences is extensive (Moritz and Cicero 2004; Meyer and Paulay 2005).
The interspecific IM analyses surveyed here concerned species for which investigators were interested in questions of ongoing gene exchange. Under these circumstances it is quite difficult to identify sister species with confidence, and we did not attempt to do so. But given investigators’ focus on the possibility of ongoing or recent gene exchange, it seems likely that the sample of species comparisons represented here come primarily from the most recently diverged part of the spectrum. Were it possible to include studies for any congeneric pairs, regardless of the time since divergence began, and not just those species that are very closely related, then we would expect much less overlap between the intraspecific and the interspecific comparisons. However IM analyses are rarely done on species thought to be long diverged. When they are, analyses tend to be relatively uninformative unless a very large number of loci have been sampled, because of the lack of information in the data that bears on several of the parameters in the model (Wang and Hey 2010).
THE SUITABILITY OF 2NM AND T
The focus on two different measures of evolutionary independence is motivated by the argument that divergence per se, as measured by a single value, cannot distinguish between two scenarios: (1) an absence of gene flow, in which divergence will continue to accumulate; and (2) gene flow is ongoing, in which case the observed divergence may not increase. With only a single metric of divergence, e.g. FST, it is possible for two different comparisons to have the same value for that measure and yet differ substantially in how much gene exchange is occurring. Notwithstanding this rational, it can be difficult to estimate gene flow together with other parameters of divergence. In this light, one kind of explanation for the overlapping distributions of 2NM and τ is that the tools used for estimating these measures do not work very well for some or many data sets. If so, then the results presented here could be misleading and it would remain possible that some other, better measures would estimate evolutionary independence in a way that reveals a sharper line between species differences and population differences. Both 2NM and τ have the desirable features that they do not depend on either mutation rate or generation time and so they can be used for comparisons across studies of different organisms and different genes. However the two measures are correlated with each other because the calculation of both depends on a population mutation rate parameter and estimates of them can have large variances when data sets are small.
The different studies brought together here vary widely in their sample sizes, and it is possible that the varying uncertainty in the individual estimates of 2NM and τ obscures an underlying pattern. Each number that emerges from an IM analysis is an estimate, and in many cases the confidence interval on the estimate is quite wide. This is particularly true for migration parameters, which often have quite flat posterior probability densities, particularly when the time of separation has been short (Won et al. 2005; Hey 2010). We can get some traction on this issue by plotting values for just those studies that used a larger number of loci. Figure 2 shows the distributions for studies with 5 or more, or 10 or more loci, and for 2NM values from studies where the estimate of τ was greater than 0.2. However these reductions in the data set had little effect on the overall distributions, and nor did they substantially alter the distributions for interspecific and intraspecific comparisons (not shown).
The 2NM and τ measures certainly do not account for any phenotypic variation, particularly differential adaptation, between the units under study. The theory behind these measures, and most of the tools for estimating them, assume selective neutrality. Perhaps in the not-too-distant future, with more widespread use of high-throughput resequencing technologies it will be possible to regularly identify population specific or species specific sites of recent adaptation (e.g. Hohenlohe et al. 2010; Turner et al. 2010). However without large samples across the genome it is difficult to see how adaptive differences could be included in a quantitative assessment of evolutionary independence without introducing a large amount of subjectivity.
Another set of questions stem from the simplicity of the IM model, which typically contains six demographic parameters, unless additional parameters for population size change are included (Hey 2005; Gutenkunst et al. 2009). Of course any model would be a vast oversimplification of the true divergence process - but if we are to study divergence using model-based methods, where do we draw the line in terms of the complexity needed to capture the major dynamics for most cases of divergence? A decision to use an IM analysis, or any model-based approach, obviously represents a tradeoff between issues of model complexity, data requirements, and how easy results are to interpret. Certainly an IM analysis involves estimating more quantities than do other quantitative methods that has been proposed for species delimitation (Sites and Marshall 2003). This point includes the recent coalescentbased methods of Ence and Carstens (2010), Hausdorf and Hennig (2010), Knowles and Carstens (2007), and Yang and Rannala (2010); all of which assume that there has been no gene exchange.
The most widely used tools for IM analyses implement a Bayesian Markov chain Monte Carlo method (Nielsen and Wakeley 2001; Hey and Nielsen 2004; Hey and Nielsen 2007). This approach can present significant challenges for some data sets, particularly with regard to ensuring that the Markov chain has mixed sufficiently. It is also true that it is possible to simulate data under a history that differs significantly from an IM model and that, when analyzed under an IM model, lead to misleading parameter estimates (Becquet and Przeworski 2009). However independent testing of the method has shown it to be reliable, with small to moderate biases, under a variety of histories that fit the basic IM model, as well as to be robust to some kinds of model violations regarding gene flow, recombination, and population structure within sampled units (Becquet and Przeworski 2009; Strasburg and Rieseberg 2010, 2011).
SPECIES DIAGNOSIS USING MEASURES OF EVOLUTIONARY INDEPENDENCE
A major problem with many quantitative methods for species diagnosis is that they depend strictly on a finding that a measure of evolutionary divergence is non-zero. For those methods that equate zero divergence with the null model, and non-zero divergence with the alternative model, species diagnosis becomes partly a function of the investigator’s sample size (Hey 2009). In other words, if the reality is that there is at least some divergence then a method based on a finding that divergence (or some indicator of divergence) is greater than zero will necessarily return a conclusion of an additional species when the sample size is large enough. To cite just a few examples of species diagnosis methods that face this issue, consider: Good and Wake’s (1992) test based on the regression of genetic distance on geographic distance, which is expected to have a statistically non-zero intercept even with very low amounts of divergence, if sample sizes are large enough (1992); Puorto et al.’s, (2001) Mantel test-based assessment of association between morphological and mtDNA distances, which will become significant if there is any underlying association, as soon as samples are big enough; population aggregation analysis (Davis and Nixon 1992), which assesses the presence of fixed character-states, becomes more likely to diagnose a species the more characters that are used (Wiens 1999; Yoder et al. 2000); and Templeton’s test for cohesion (2001), which begins with the basic test of a nested clade analysis under which larger samples are more likely to provide a statistically significant finding than small samples, so long as there is some divergence. Notwithstanding the sensible evolutionary arguments that underlie these methods, because they equate species diagnosis with a finding that a measure, or criterion, of divergence is non-zero, they introduce an awkward kind of subjectivity that is expected to cause more species to be found as sample sizes grow larger (Hey 2009).
One way to avoid this difficulty is to use non-zero threshold values for indicators of divergence (Highton 1990; Porter 1990; Wiens and Servedio 2000; Tobias et al. 2010). Here we consider using specific threshold values for 2NM and τ for species diagnosis. To discern values for 2NM and τ that provide the most resolution for the current taxonomic status we ranked each set of values from low to high and then plotted the cumulative distribution of each measure for both species and populations. Each resulting distribution can be envisioned as an estimate of a cumulative probability density. The value that is associated with the greatest difference between the two curves (i.e. the curves for species and for populations) is an estimate of the value that offers the greatest resolution for the current taxonomic status and can serve as a candidate for a threshold value for species diagnosis. From Figure 7 the value for 2NM is very near 1, and for τ it is approximately 0.4. Table 2 compares actual taxonomic status with that based on several criteria using 2NM and τ, as well as FST (see Figure 6). None of the criteria listed in Table 2 provide a strong correlation with existing taxonomic status, which is not surprising given the broad distributions for both 2NM and τ for both species and populations (Figure 2). For simplicity we suggest a threshold criterion of 2NM< 1 and τ >1 (Hey 2009). Table 2 shows the correspondence for different taxonomic groups between this criterion and the current taxonomic status. That correspondence is lower for Plants and Insects than it is for Birds and Mammals.
Figure 7.
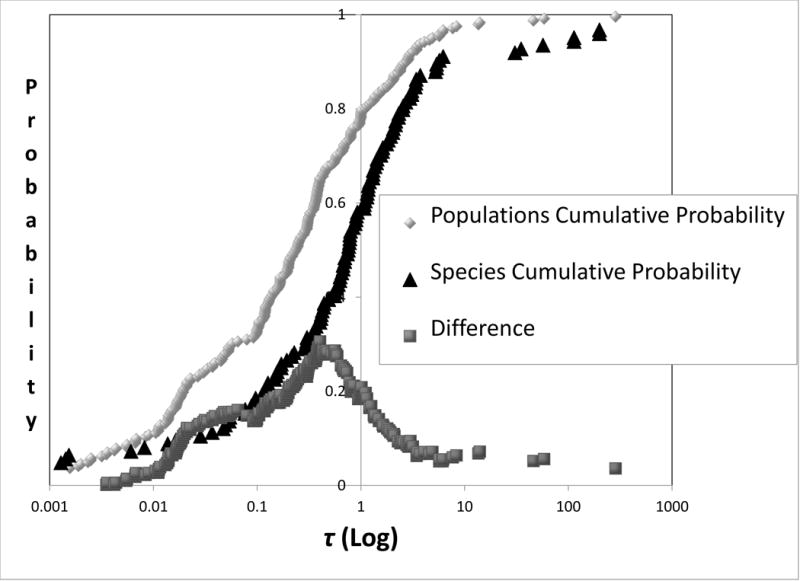
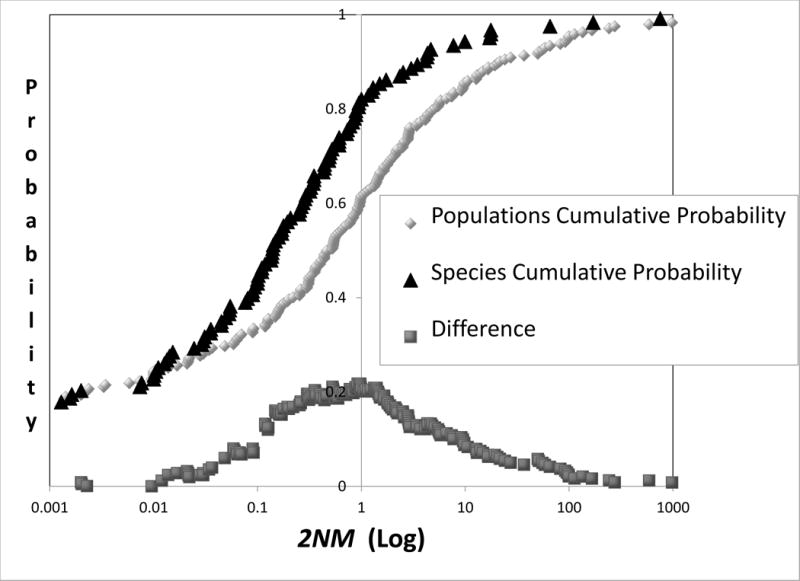
Cumulative distributions for 2NM (top) and τ (bottom). Curves are shown for both populations and species and for the vertical distance between the two. The difference points were obtained by as described in the legend for Figure 6.
Table 2.
Correspondence between actual taxonomic status and proposed status based on 2NM and τ.
| Threshold Criteria | Counts (A = current status, B= status based on threshold) | ||||||||
|---|---|---|---|---|---|---|---|---|---|
| 2NM | τ | Group | A=populations, B= populations | A=populations, B= species | A=species, B= populations | A=species, B=species | # Agree | # Disagree | Correlation |
| < 1 | > 1 | ALL | 211 | 45 | 62 | 38 | 249 | 107 | 0.217 |
| < 1 | > 0.4 | ALL | 176 | 80 | 45 | 55 | 231 | 125 | 0.220 |
| – | > 1 | ALL | 204 | 52 | 59 | 41 | 245 | 111 | 0.212 |
| < 1 | – | ALL | 198 | 42 | 62 | 38 | 236 | 104 | 0.220 |
| < 1 | > 1 | Bird | 27 | 3 | 10 | 6 | 33 | 13 | 0.330 |
| < 1 | > 1 | Insect | 15 | 3 | 15 | 11 | 26 | 18 | 0.271 |
| < 1 | > 1 | Mammal | 40 | 4 | 9 | 9 | 49 | 13 | 0.456 |
| < 1 | > 1 | Plant | 23 | 3 | 10 | 6 | 29 | 13 | 0.307 |
| FST > 0.35 | ALL | 120 | 42 | 22 | 42 | 162 | 64 | 0.370 | |
If such a criterion were to be put into practice one of the first question that arises, and that is not addressed here, is the degree of statistical support for particular values of 2NM and τ. First, one could frame taxonomic status as a statistical test, and ask whether 2NM is significantly less than 1 and whether τ is significantly greater than 1. To do so would make it more likely that larger samples would identify more species, but because there are non-zero threshold values the problem is not nearly as bad as without threshold values (Hey 2009). A second possible route, that places weight on biological significance while setting aside the issue of statistical significance, would be for investigators to agree on some consensus of minimum sample size (in terms of numbers of individuals and loci), and then to apply the criterion to estimated values of 2NM and τ without a statistical test. Such an approach would avoid having the diagnosis of new species be an increasing function of sample size. However it would also cause some decisions to be based on 2NM and τ estimates that have wide confidence intervals.
DIAGNOSIS USING FST
As a single quantity, a dimensionless proportion, FST is a widely used measure of divergence, even though different kinds of histories can lead to the same value, including histories with gene flow and without. Examining how well FST estimates correspond to measures of evolutionary independence obtained from IM analyses, we find that the association is moderate and similar for both 2NM and τ. The correlations of ranked values of FST with 2NM and τ were at −0.486 and 0.479, respectively. To the question of whether FST tends to reflect mostly gene flow or time of population separation, the studies compiled here suggest a fairly even balance between the two. Marko and Hart (2011) conducted a similar examination of the association of isolation-with-migration model parameters with an FST measure, using previously published results on 15 reef fish species (Lessios and Robertson 2006), and found a fairly strong and statistically significant association with divergence time, but not with gene flow.
Like 2NM and τ, FST shows a shifted distribution for pairs of closely related species, compared to pairs of populations within a species (Figure 6). The bottom part of Figure 6 shows the cumulative distribution of FST values for both populations and species, as well as the difference between them. As we did for different values of 2NM and τ, we also examined how FST might work has a threshold measure for taxon diagnosis. We found that a threshold value of FST = 0.35, above which entities are identified as species and below which as populations, produced the highest correlation with the actual taxonomic status (correlation = 0.37, Table 2). If investigators wished to use a single, population genetic-based measure of divergence for taxon diagnosis, then it seems that this FST value would maintain the most consistency with the divergence that we currently find between closely related species.
APPARENT PARADOXES WHEN USING 2NM AND T
Some interesting side effects arise when considering using 2NM and τ for taxon diagnosis. One important issue that has already been mentioned is that small populations are especially likely to reveal both low values of 2NM and high values of τ. This is because the population mutation rate (4Nu) is used in the calculation of both measures and so if the effective population size is small then 2NM tends to be small and τ tends to be large. This is not a problem with the measures of evolutionary independence, but the point does serve to highlight the difficulty of making taxonomic decisions for small populations. Small populations really are expected to diverge more quickly by genetic drift than are large populations; and if the gene flow rate, per gene copy, is the same for a large and a small population, then the small population will experience a lower population migration rate.
Another interesting implication of using 2NM and τ is that it becomes possible to assess evolutionary independence for each of the populations in an IM analysis, and it is possible to conclude that one is independent while the other is not. Whether or not this seems sensible depends on how one thinks of independence. For example, if gene flow is going in just one direction then the population contributing genes is unaffected by that gene flow and might be considered to be independent of the recipient populations, whereas the reverse would not be true. Also if one population is experiencing a faster rate of genetic drift, then the divergence that is accumulating between the two populations is actually mostly occurring in that smaller population. However a conclusion that one population in an IM analysis merits species status, while the other does not, would lead to taxonomic non-equivalence that might be seen as problematic. For example it could lead to some species being nested within others. To avoid this, investigators might choose to assign species status to both populations only if both meet the specified criteria, and to otherwise not designate either as species, even if one of them does meet the criteria. However, in some cases investigators may wish to focus on the question of whether a single individual population merits additional taxonomic status. An example of this would be if a population is being considered for designation as a Distinct Population Segment (DPS), a conservation unit designation under the U.S. Endangered Species Act.
Supplementary Material
Acknowledgments
We are thankful to Vitor Sousa, Mike Ford, Robin Waples and Rus Hoelzel for comments on this paper. This research was supported by grants to J. H. from NIH (GM078204) and NSF (DEB-0949561) and by a grant (PTDC/BIA-BDE/66210/2006) and fellowship (SFRH/BPD/28869/2006) from the Fundação para a Ciencia e a Tecnologia, to C. P.
LITERATURE CITED
- Bachmann K. Species as units of diversity: an outdated concept. Theory in Biosciences. 1998;117:213–230. [Google Scholar]
- Baum DA. Species as Ranked Taxa. Syst Biol. 2009;58:74–86. doi: 10.1093/sysbio/syp011. [DOI] [PubMed] [Google Scholar]
- Becquet C, Przeworski M. A new approach to estimate parameters of speciation models with application to apes. Genome Res. 2007;17:1505–1519. doi: 10.1101/gr.6409707. [DOI] [PMC free article] [PubMed] [Google Scholar]
- Becquet C, Przeworski M. Learning about modes of speciation by computational approaches. Evolution. 2009;63:2547–2562. doi: 10.1111/j.1558-5646.2009.00662.x. [DOI] [PubMed] [Google Scholar]
- Cleveland WS, Devlin SJ. Locally Weighted Regression: An Approach to Regression Analysis by Local Fitting. Journal of the American Statistical Association. 1988;83:596–610. [Google Scholar]
- Cracraft J. Speciation and its ontology: the empirical consequences of alternative species concepts for understanding patterns and processes of differentiation. In: Otte D, Endler JA, editors. Speciation and its consequences. Sinauer Associates; Sunderland, Mass: 1989. pp. 28–59. [Google Scholar]
- Darlington PJ., Jr Modern Taxonomy, Reality, and Usefulness. Syst Zool. 1971;20:341–365. [Google Scholar]
- Darwin C. On the Origin of Species by Means of Natural Selection. Murray; London: 1859. [Google Scholar]
- Davis JI, Nixon KC. Populations, genetic variation, and the delimitation of phylogenetic species. Syst Biol. 1992;41:421–435. [Google Scholar]
- de Queiroz K. The general lineage concept of species: species criteria and the process of speciation. In: Howard DJ, Berlocher SH, editors. Endless Forms: Species and Speciation. Oxford University Press; New York: 1998. pp. 57–75. [Google Scholar]
- Ehrlich PR, Raven PH. Differentiation of populations. Science. 1969;165:1228–1232. doi: 10.1126/science.165.3899.1228. [DOI] [PubMed] [Google Scholar]
- Ence DD, Carstens BC. SpedeSTEM: a rapid and accurate method for species delimitation. Molecular Ecology Resources. 2010:473–480. doi: 10.1111/j.1755-0998.2010.02947.x. [DOI] [PubMed] [Google Scholar]
- Excoffier L, Smouse PE, Quattro JM. Analysis of molecular variance inferred from metric distances among DNA haplotypes: applications to human mitochondiral DNA restriction data. Genetics. 1992;131:479–491. doi: 10.1093/genetics/131.2.479. [DOI] [PMC free article] [PubMed] [Google Scholar]
- Felsenstein J. The theoretical population genetics of variable selection and migration. Annu Rev Genet. 1976;10:253–280. doi: 10.1146/annurev.ge.10.120176.001345. [DOI] [PubMed] [Google Scholar]
- Ghiselin MT. On psychologism in the logic of taxonomic controversies. Syst Zool. 1966;15:207–215. [Google Scholar]
- Good DA, Wake DB. Geographic variation and speciation in the torrent salamanders of the genus Rhyacotriton (Caudata: Rhyacotritonidae) University of California Publications in Zoology. 1992;126:1–91. [Google Scholar]
- Gutenkunst RN, Hernandez RD, Williamson SH, Bustamante CD. Inferring the joint demographic history of multiple populations from multidimensional SNP frequency data. PLoS Genet. 2009;5:e1000695. doi: 10.1371/journal.pgen.1000695. [DOI] [PMC free article] [PubMed] [Google Scholar]
- Harrison RG. Molecular Changes at Speciation. Annu Rev Ecol Syst. 1991;22:281–308. [Google Scholar]
- Hausdorf B, Hennig C. Species Delimitation Using Dominant and Codominant Multilocus Markers. Syst Biol. 2010;59:491–503. doi: 10.1093/sysbio/syq039. [DOI] [PubMed] [Google Scholar]
- Hebert PDN, Stoeckle MY, Zemlak TS, Francis CM. Identification of Birds through DNA Barcodes. PLoS Biology. 2004;2:e312. doi: 10.1371/journal.pbio.0020312. [DOI] [PMC free article] [PubMed] [Google Scholar]
- Hendry AP, Vamosi SM, Latham SJ, Heilbuth JC, Day T. Questioning species realities. Conservation Genetics. 2000;1:67–76. [Google Scholar]
- Hennig W. Phylogenetic Systematics. University of Illinois Press; Urbana, IL: 1966. [Google Scholar]
- Hey J. On the Number of New World Founders: A Population Genetic Portrait of the Peopling of the Americas. PLoS Biol. 2005;3:0965–0975. doi: 10.1371/journal.pbio.0030193. [DOI] [PMC free article] [PubMed] [Google Scholar]
- Hey J. On the arbitrary identification of real species. In: Butlin RK, Bridle J, Schluter D, editors. Speciation and Patterns of Diversity. Cambridge University Press; Cambridge: 2009. pp. 15–28. [Google Scholar]
- Hey J. Isolation with Migration Models for More Than Two Populations. Mol Biol Evol. 2010;27:905–920. doi: 10.1093/molbev/msp296. [DOI] [PMC free article] [PubMed] [Google Scholar]
- Hey J, Nielsen R. Multilocus methods for estimating population sizes, migration rates and divergence time, with applications to the divergence of Drosophila pseudoobscura and D. persimilis. Genetics. 2004;167:747–760. doi: 10.1534/genetics.103.024182. [DOI] [PMC free article] [PubMed] [Google Scholar]
- Hey J, Nielsen R. Integration within the Felsenstein equation for improved Markov chain Monte Carlo methods in population genetics. Proceedings of the National Academy of Sciences of the United States of America. 2007;104:2785–2790. doi: 10.1073/pnas.0611164104. [DOI] [PMC free article] [PubMed] [Google Scholar]
- Highton R. Taxonomic treatment of genetically differentiated populations. Herpetologica. 1990;46:114–121. [Google Scholar]
- Hohenlohe PA, Bassham S, Etter PD, Stiffler N, Johnson EA, Cresko WA. Population genomics of parallel adaptation in threespine stickleback using sequenced RAD tags. PLoS Genetics. 2010;6:e1000862. doi: 10.1371/journal.pgen.1000862. [DOI] [PMC free article] [PubMed] [Google Scholar]
- Hudson RR, Slatkin M, Maddison WP. Estimation of levels of gene flow from DNA sequence data. Genetics. 1992;132:583–589. doi: 10.1093/genetics/132.2.583. [DOI] [PMC free article] [PubMed] [Google Scholar]
- Kluge AG. Species as historical individuals. Biol Philos. 1990;5:417–431. [Google Scholar]
- Knowles LL, Carstens BC. Delimiting Species without Monophyletic Gene Trees. Syst Biol. 2007;56:887–895. doi: 10.1080/10635150701701091. [DOI] [PubMed] [Google Scholar]
- Lessios HA, Robertson DR. Crossing the impassable: genetic connections in 20 reef fishes across the eastern Pacific barrier. Proc Biol Sci. 2006;273:2201–2208. doi: 10.1098/rspb.2006.3543. [DOI] [PMC free article] [PubMed] [Google Scholar]
- Levin DA. The nature of plant species. Science. 1979;204:381–384. doi: 10.1126/science.204.4391.381. [DOI] [PubMed] [Google Scholar]
- Lopes JS, Balding D, Beaumont MA. PopABC: a program to infer historical demographic parameters. Bioinformatics. 2009;25:2747–2749. doi: 10.1093/bioinformatics/btp487. [DOI] [PubMed] [Google Scholar]
- Marko P, Hart M. Retrospective coalescent methods and the reconstruction of metapopulation histories in the sea. Evolutionary Ecology. 2011:1–25. [Google Scholar]
- Mayden RL. A hierarchy of species concepts: the denouement in the saga of the species problem. In: Claridge MF, Dawah HA, Wilson MR, editors. Species: the units of biodiversity. Chapman and Hall; London: 1997. pp. 381–424. [Google Scholar]
- Mayr E. Systematics and the Origin of Species. Columbia University Press; New York: 1942. [Google Scholar]
- Mayr E. Of what use are subspecies? The Auk. 1982;99:593–595. [Google Scholar]
- Meyer CP, Paulay G. DNA Barcoding: Error Rates Based on Comprehensive Sampling. PLoS Biol. 2005;3:e422. doi: 10.1371/journal.pbio.0030422. [DOI] [PMC free article] [PubMed] [Google Scholar]
- Mishler B. Getting rid of species? In: Wilson R, editor. Species: New Interdisciplinary Essays. MIT Press; Cambridge, MA: 1999. pp. 307–315. [Google Scholar]
- Moritz C, Cicero C. DNA Barcoding: Promise and Pitfalls. PLoS Biol. 2004;2:e354. doi: 10.1371/journal.pbio.0020354. [DOI] [PMC free article] [PubMed] [Google Scholar]
- Nei M. Genetic distance between populations. Amer Nat. 1972;106:283–292. [Google Scholar]
- Nei M. Analysis of Gene Diversity in Subdivided Populations. Proceedings of the National Academy of Sciences. 1973;70:3321–3323. doi: 10.1073/pnas.70.12.3321. [DOI] [PMC free article] [PubMed] [Google Scholar]
- Nelson G. Species and taxa: systematics and evolution. In: Otte D, Endler JA, editors. Speciation and its consequences. Sinauer Associates; Sunderland, Mass: 1989. pp. 60–81. [Google Scholar]
- Nielsen R, Wakeley J. Distinguishing migration from isolation. A Markov chain Monte Carlo approach. Genetics. 2001;158:885–896. doi: 10.1093/genetics/158.2.885. [DOI] [PMC free article] [PubMed] [Google Scholar]
- Nixon KC, Wheeler QD. An amplification of the phylogenetic species concept. Cladistics. 1990;6:211–223. [Google Scholar]
- O’Brien SJ, Mayr E. Bureaucratic mischief: recognizing endangered species and subspecies. Science. 1991;251:1187–1187. doi: 10.1126/science.251.4998.1187. [DOI] [PubMed] [Google Scholar]
- Phillimore AB, Owens IPF. Are subspecies useful in evolutionary and conservation biology? Proc R Soc B. 2006;273:1049–1053. doi: 10.1098/rspb.2005.3425. [DOI] [PMC free article] [PubMed] [Google Scholar]
- Pleijel F, Rouse GW. Least-inclusive taxonomic unit: a new taxonomic concept for biology. Proc R Soc Lond B Biol Sci. 2000;267:627–630. doi: 10.1098/rspb.2000.1048. [DOI] [PMC free article] [PubMed] [Google Scholar]
- Porter AH. Testing Nominal Species Boundaries Using Gene Flow Statistics: The Taxonomy of Two Hybridizing Admiral Butterflies (Limenitis: Nymphalidae) Syst Zool. 1990;39:131–147. [Google Scholar]
- Puorto G, da Graça Salomão M, Theakston RDG, Thorpe RS, Warrell DA, Wüster W. Combining mitochondrial DNA sequences and morphological data to infer species boundaries: phylogeography of lanceheaded pitvipers in the Brazilian Atlantic forest, and the status of Bothrops pradoi (Squamata: Serpentes: Viperidae) J Evol Biol. 2001;14:527–538. [Google Scholar]
- Rieseberg LH, Wood TE, Baack EJ. The nature of plant species. Nature. 2006;440:524–527. doi: 10.1038/nature04402. [DOI] [PMC free article] [PubMed] [Google Scholar]
- Ryder OA. Species conservation and systematics: The dilemma of subspecies. Tr Ecol Evol. 1986;1:910. [Google Scholar]
- Simpson GG. The Species Concept. Evolution. 1951;5:285–298. [Google Scholar]
- Simpson GG. Principles of Animal Taxonomy. Columbia University Press; New York: 1961. [DOI] [PubMed] [Google Scholar]
- Sites JW, Marshall JC. Delimiting species: a Renaissance issue in systematic biology. Trends Ecol Evol. 2003;18:462–470. [Google Scholar]
- Sites JW, Marshall JC. Operational criteria for delimiting species. Annual Review of Ecology Evolution and Systematics. 2004;35:199–227. [Google Scholar]
- Slatkin M. Gene flow in natural populations. Annu Rev Ecol Syst. 1985;16:393–430. [Google Scholar]
- Slatkin M. A measure of population subdivision based on microsatellite allele frequencies. Genetics. 1995;139:457–462. doi: 10.1093/genetics/139.1.457. [DOI] [PMC free article] [PubMed] [Google Scholar]
- Sokal RR, Camin JH. The Two Taxonomies: Areas of Agreement and Conflict. Syst Zool. 1965;14:176–195. [Google Scholar]
- Strasburg JL, Rieseberg LH. How Robust Are “Isolation with Migration” Analyses to Violations of the IM Model? A Simulation Study. Mol Biol Evol. 2010;27:297–310. doi: 10.1093/molbev/msp233. [DOI] [PMC free article] [PubMed] [Google Scholar]
- Strasburg JL, Rieseberg LH. Interpreting the estimated timing of migration events between hybridizing species. Mol Ecol. 2011;20:2353–2366. doi: 10.1111/j.1365-294X.2011.05048.x. [DOI] [PubMed] [Google Scholar]
- Stuessy TF. Plant taxonomy: the systematic evaluation of comparative data. Columbia University Press; New York: 1990. [Google Scholar]
- Takahata N. Allelic Genealogy and Human Evolution. Mol Biol Evol. 1993;10:2–22. doi: 10.1093/oxfordjournals.molbev.a039995. [DOI] [PubMed] [Google Scholar]
- Templeton AR. The meaning of species and speciation: a genetic perspective. In: Otte D, Endler JA, editors. Speciation and its consequences. Sinauer Associates; Sunderland, Mass: 1989. pp. 3–27. [Google Scholar]
- Templeton AR. Using phylogeographic analyses of gene trees to test species status and processes. Mol Ecol. 2001;10:779–791. doi: 10.1046/j.1365-294x.2001.01199.x. [DOI] [PubMed] [Google Scholar]
- Thorpe JP. The Molecular Clock Hypothesis: Biochemical Evolution, Genetic Differentiation and Systematics. Annu Rev Ecol Syst. 1982;13:139–168. [Google Scholar]
- Thorpe JP. Enzyme variation, genetic distance and evolutionary divergence in relation to levels of taxonomic separation. In: Oxford GS, Rollison D, editors. Protein polymorphism: adaptive and taxonomic significance/edited by GS Oxford and D Rollinson. Academic Press; London: 1983. pp. 131–152. [Google Scholar]
- Tobias JA, Seddon N, Spottiswoode CN, Pilgrim JD, Fishpool LDC, Collar NJ. Quantitative criteria for species delimitation. Ibis. 2010;152:724–746. [Google Scholar]
- Turner TL, Bourne EC, Von Wettberg EJ, Hu TT, Nuzhdin SV. Population resequencing reveals local adaptation of Arabidopsis lyrata to serpentine soils. Nat Genet advance online publication. 2010 doi: 10.1038/ng.515. [DOI] [PubMed] [Google Scholar]
- van der Bank H, van der Bank M, van Wyk BE. A review of the use of allozyme electrophoresis in plant systematics. Biochem Syst Ecol. 2001;29:469–483. doi: 10.1016/s0305-1978(00)00086-7. [DOI] [PubMed] [Google Scholar]
- Wakeley J, Hey J. Testing speciation models with DNA sequence data. In: DeSalle R, Schierwater B, editors. Molecular Approaches to Ecology and Evolution. Birkhäuser Verlag; Basel: 1998. pp. 157–175. [Google Scholar]
- Wang Y, Hey J. Estimating Divergence Parameters With Small Samples From a Large Number of Loci. Genetics. 2010;184:363–379. doi: 10.1534/genetics.109.110528. [DOI] [PMC free article] [PubMed] [Google Scholar]
- Weir BS, Cockerham CC. Estimating F-statistics for the analysis of population structure. Evolution. 1984;38:1358–1370. doi: 10.1111/j.1558-5646.1984.tb05657.x. [DOI] [PubMed] [Google Scholar]
- Whitlock MC, McCauley DE. Indirect measures of gene flow and migration: FST not equal to 1/(4Nm + 1) Heredity. 1999;82(Pt 2):117–125. doi: 10.1038/sj.hdy.6884960. [DOI] [PubMed] [Google Scholar]
- Wiens JJ. Polymorphism in systematics and comparative biology. Annu Rev Ecol Syst. 1999;30:327–362. [Google Scholar]
- Wiens JJ, Servedio MR. Species delimitation in systematics: inferring diagnostic differences between species. Proc R Soc Lond Ser B-Biol Sci. 2000;267:631–636. doi: 10.1098/rspb.2000.1049. [DOI] [PMC free article] [PubMed] [Google Scholar]
- Wiley EO. The evolutionary species concept reconsidered. Syst Zool. 1978;27:17–26. [Google Scholar]
- Winston J. Describing Species. Columbia University Press; New York, NY: 1999. [Google Scholar]
- Won YJ, Sivasundar A, Wang Y, Hey J. On the origin of Lake Malawi cichlid species: a population genetic analysis of divergence. Proc Natl Acad Sci U S A. 2005;102:6581–6586. doi: 10.1073/pnas.0502127102. [DOI] [PMC free article] [PubMed] [Google Scholar]
- Wright S. Evolution in Mendelian populations. Genetics. 1931;16:97–159. doi: 10.1093/genetics/16.2.97. [DOI] [PMC free article] [PubMed] [Google Scholar]
- Wright S. Isolation by distance. Genetics. 1943;28:114–138. doi: 10.1093/genetics/28.2.114. [DOI] [PMC free article] [PubMed] [Google Scholar]
- Wright S. The genetical structure of populations. Annals of Eugenics. 1951;15:323–354. doi: 10.1111/j.1469-1809.1949.tb02451.x. [DOI] [PubMed] [Google Scholar]
- Yang Z, Rannala B. Bayesian species delimitation using multilocus sequence data. Proceedings of the National Academy of Sciences. 2010;107:9264–9269. doi: 10.1073/pnas.0913022107. [DOI] [PMC free article] [PubMed] [Google Scholar]
- Yoder AD, Irwin JA, Goodman SM, Rakotoarisoa SV. Genetic tests of the taxonomic status of the ring-tailed lemur (Lemur catta) from the high mountain zone of the Andringitra Massif, Madagascar. Journal of Zoology. 2000;252:1–9. [Google Scholar]
- Zink RM. The role of subspecies in obscuring avian biological diversity and misleading conservation policy. Proc R Soc Lond Ser B-Biol Sci. 2004;271:561–564. doi: 10.1098/rspb.2003.2617. [DOI] [PMC free article] [PubMed] [Google Scholar]
- Zink RM, McKitrick MC. The debate over species concepts and its implications for ornithology. Auk. 1995;112:701–719. [Google Scholar]
Associated Data
This section collects any data citations, data availability statements, or supplementary materials included in this article.


