Abstract
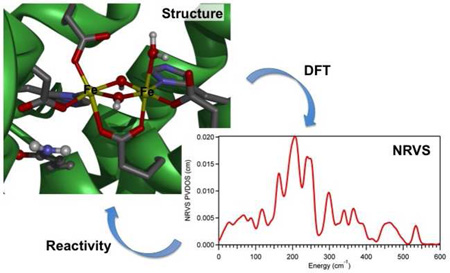
Nuclear resonance vibrational spectroscopy (NRVS) is a powerful technique that can provide geometric structural information on key reaction intermediates of Fe-containing systems when utilized in combination with density functional theory (DFT). However, in the case of binuclear non-heme iron enzymes, DFT-predicted NRVS spectra have been found to be sensitive to truncation method used to model the active sites of the enzymes. Therefore, in this study various-level truncation schemes have been tested to predict the NRVS spectrum of a binuclear non-heme iron enzyme, and a reasonably sized DFT model that is suitable for employing the NRVS/DFT combined methodology to characterize binuclear non-heme iron enzymes has been developed.
Keywords: binuclear non-heme iron enzymes, nuclear resonance vibrational spectroscopy, and density functional theory
Graphical Abstract
Introduction
Nuclear resonance vibrational spectroscopy (NRVS) is a third-generation synchrotron-based technique that probes vibrational side bands of a Mössbauer transition.1 Using this technique, essentially all the vibrations that involve a displacement of the Mössbauer-active element are observable, and thus a complete set of vibrational information can be obtained. This technique, in combination with density functional theory (DFT) computations, has proven to be powerful in determining the geometric structures of 57Fe-containing species and especially useful in defining key transient intermediates of Fe enzymes.2–5
The goal of this study is to develop a computational methodology that models the NRVS data of binuclear non-heme Fe enzymes properly and thus can be utilized for the characterization of their reaction intermediates and subsequent reaction coordinate calculations. To validate the DFT methodology, we focus here on a crystallographically-characterized structure - the resting state of soluble methane monooxygenase (MMO) from Methylosinus trichosporium OB3b.6 MMO converts methane to methanol, employing a diiron cofactor that activates O2.7 This O2 activation process involves multiple intermediates including the key high-valent Fe(IV)2 intermediate, Q, which we anticipate characterizing by NRVS.7
Many spectroscopic properties of metalloenzymes, including their electronic absorption spectra and their Mössbauer and electron paramagnetic resonance parameters, can be predicted using quantum computations that are often performed on a truncated enzyme model. This generally encompasses the active site and the ligating residues that are capped with hydrogen atoms which are given position constraints reflecting their covalent linkage to the protein polymer.8–13 However, the effects of this truncation on the prediction of NRVS data of binuclear non-heme Fe enzymes have not been tested. The DFT-predicted NRVS data of small synthetic Fe complexes and mononuclear Fe enzyme sites have shown great consistency with experimental data. However, depending on the localization of the normal modes of 2Fe active sites, a truncated enzyme active-site model may not be sufficient for NRVS analysis. Therefore, in this study various levels of truncation schemes have been tested to simulate the NRVS data of the resting state of MMO, and a reasonably sized DFT model has been developed to predict its spectrum for comparison to future data and reaction coordinate studies.
Methods
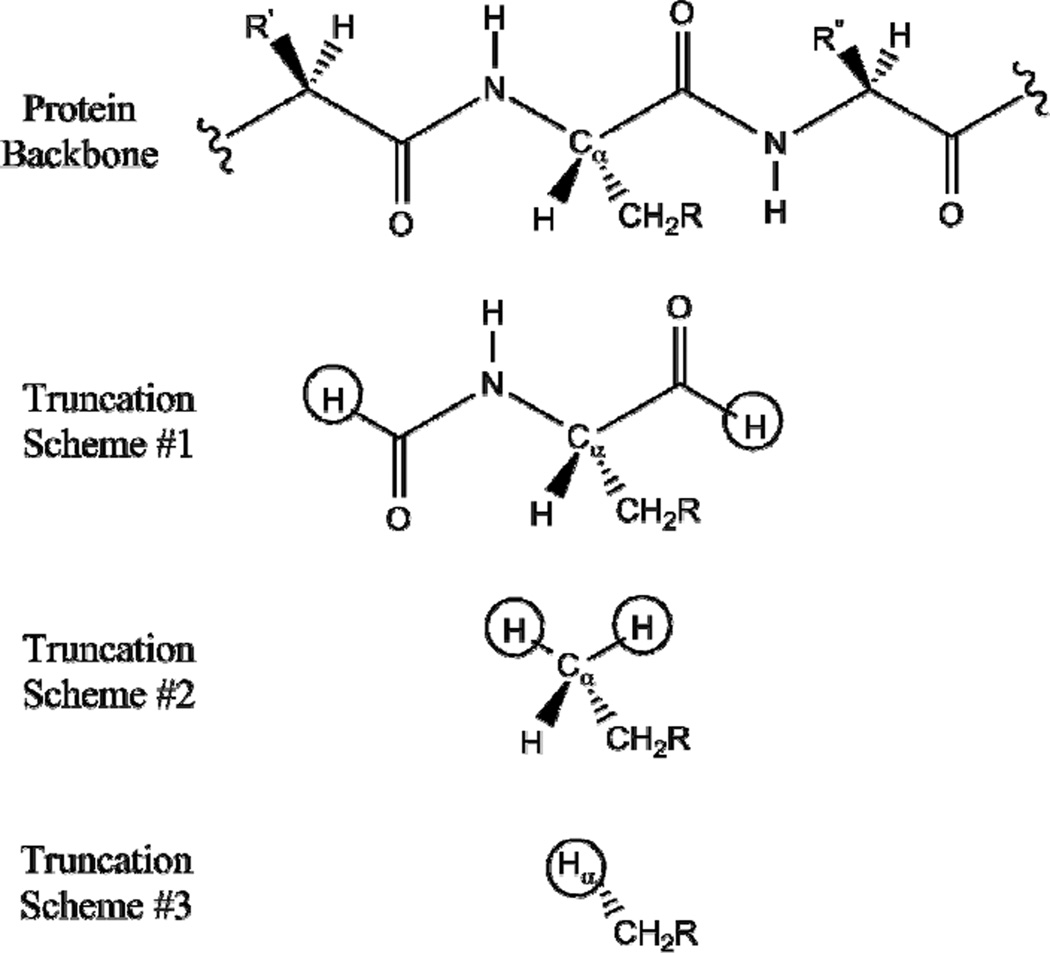
The initial geometry for the active site of MMO in the resting state was obtained from its X-ray crystal structure from OB3b (PDB: 1MHY).6 Amino acids and water molecules participating in the ligation of the Fe centers (including 114E, 144E, 147H, 209E, 243E, and 246H) and H bonding interactions with the ligands (including Q140 and Q 205) were included in the DFT computations, while the protein backbone was truncated and constrained during geometry optimization. Three different truncation schemes were used as presented in Figure 1, and the atoms that mimic the constraints of the frozen protein backbone are circled. In scheme #1, two backbone carbonyl groups adjacent to the alpha carbon (Cα) of the side chain were included and capped with hydrogen atoms. In scheme #2, the Cα’s of the side chains were capped with hydrogen atoms, while in scheme #3 they were replaced with hydrogen atoms. Note that using Cα atoms as constraints led to results equivalent to those described for scheme #3. All capping hydrogen atoms were placed at a distance of 1.1 Å from the neighboring carbon atoms, and these C-H bond lengths were optimized to 1.11 ± 0.01 Å when their positions were fixed during geometry optimization using the broken symmetry spin-unrestricted DFT formalism with the 90% BP/10% HF hybrid functional and the 6–31G* basis set in the Gaussian 09 package.14–30 DFT frequency calculations were performed using the same functional and basis set except for the largest model prepared using truncation scheme #1. Its large size (157 atoms) limited the force field calculation and thus carbon and hydrogen atoms that do not participate in bonding with the Fe center were treated with the 3–21G basis set. The energies and Fe displacements of the normal modes obtained were used to predict NRVS data using the GenNRVS program.31
Figure 1.
Truncation schemes used for modeling the active site of MMO resting state. The positions of the circled atoms were constrained during geometry optimization.
Results and analysis
1. Optimized geometries for the active site of MMO in the resting state
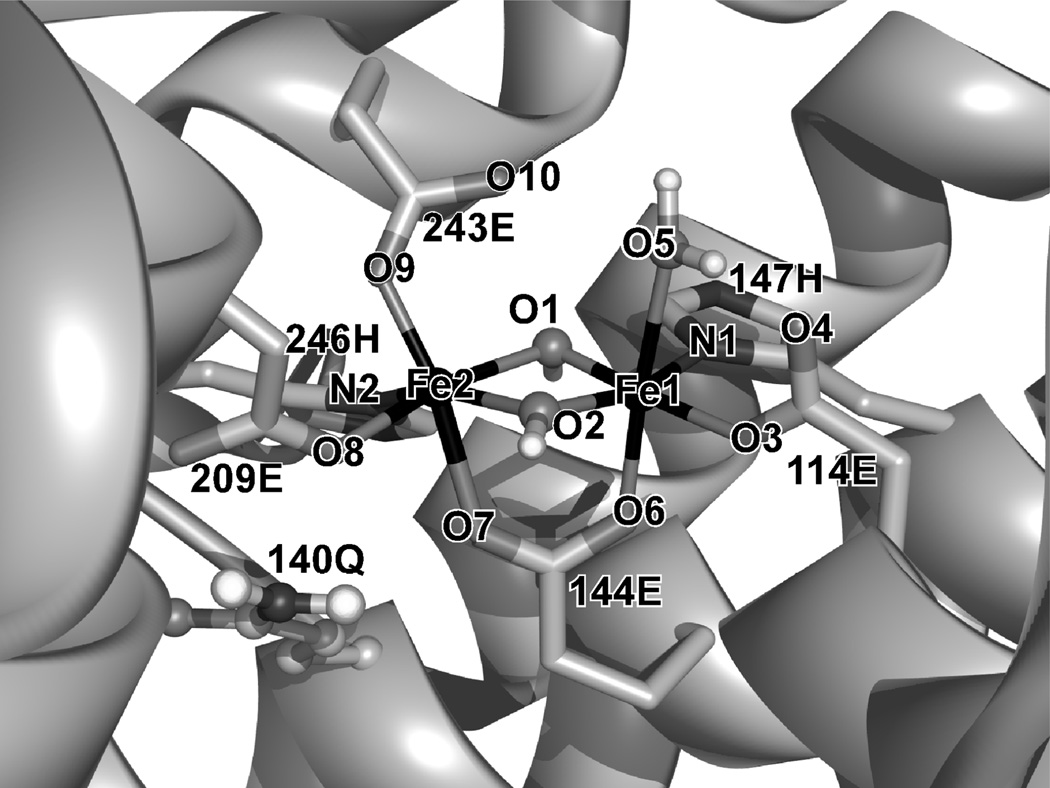
In the X-ray crystal structure of MMO in the resting state, two ferric centers are bridged by the carboxylate side chain of glutamic acid 144 and two water-derived ligands, O1 and O2. Based on Fe-O bond lengths and their inequivalency, O1 and O2 have been proposed to be either bis(µ-OH) or (µ-OH)(µ-OH2) bridges.6, 32, 33 Both cases were considered in these computations, but when the (µ-OH)(µ-OH2) structure was optimized, the water bridge became a terminal ligand and the Fe centers became mono-(µ-OH) bridged with an Fe-Fe separation of 3.5 Å, which is an overestimate by 0.5 Å (Figure S1). Therefore, only results from the bis(µ-OH)-bridged structures are presented here (Tables 1 S1 and Figure S2).
Table 1.
Geometries of the Fe2(µ-OH)2 core obtained from X-ray crystal structure and DFT optimized structures
| /Å | Fe1-O1 | Fe1-O2 | Fe2-O1 | Fe2-O2 | Fe1-O5 | Fe1-Fe2 | O1-O2 | O4-O5 |
|---|---|---|---|---|---|---|---|---|
| Xtal | 1.712 | 2.154 | 2.036 | 2.166 | 2.234 | 2.988 | 2.640 | 2.664 |
| model #1 | 1.965 | 1.988 | 2.011 | 1.996 | 2.102 | 3.037 | 2.508 | 2.596 |
| model #2 | 1.968 | 2.006 | 2.039 | 1.980 | 2.122 | 3.057 | 2.481 | 2.642 |
| model #3 | 1.975 | 1.996 | 2.014 | 1.981 | 2.116 | 3.051 | 2.477 | 2.605 |
The structures optimized using the three different truncation schemes #1~#3 in Figure 1 (models #1~#3) display a similar geometry for the Fe2(µ-OH)2 core (Table 1), while the conformations of the terminal His and Glu ligands were variable (Figure S2). All three bis(µ-OH)-bridged structures reasonably reproduced the Fe-Fe distance and the trend that the µ OH bridges interact more strongly with the water-bound Fe1 center than with the Fe2 center that has an anionic carboxylate ligand in an axial position (Figure 2, E243). Alternatively, the Fe-O2, O1-O2, and Fe1-O5(water) distances are underestimated in all three structures.
Figure 2.
Structure of MMO resting state (PDB: 1MHY)
2. DFT-predicted NRVS spectra of MMO in the resting state
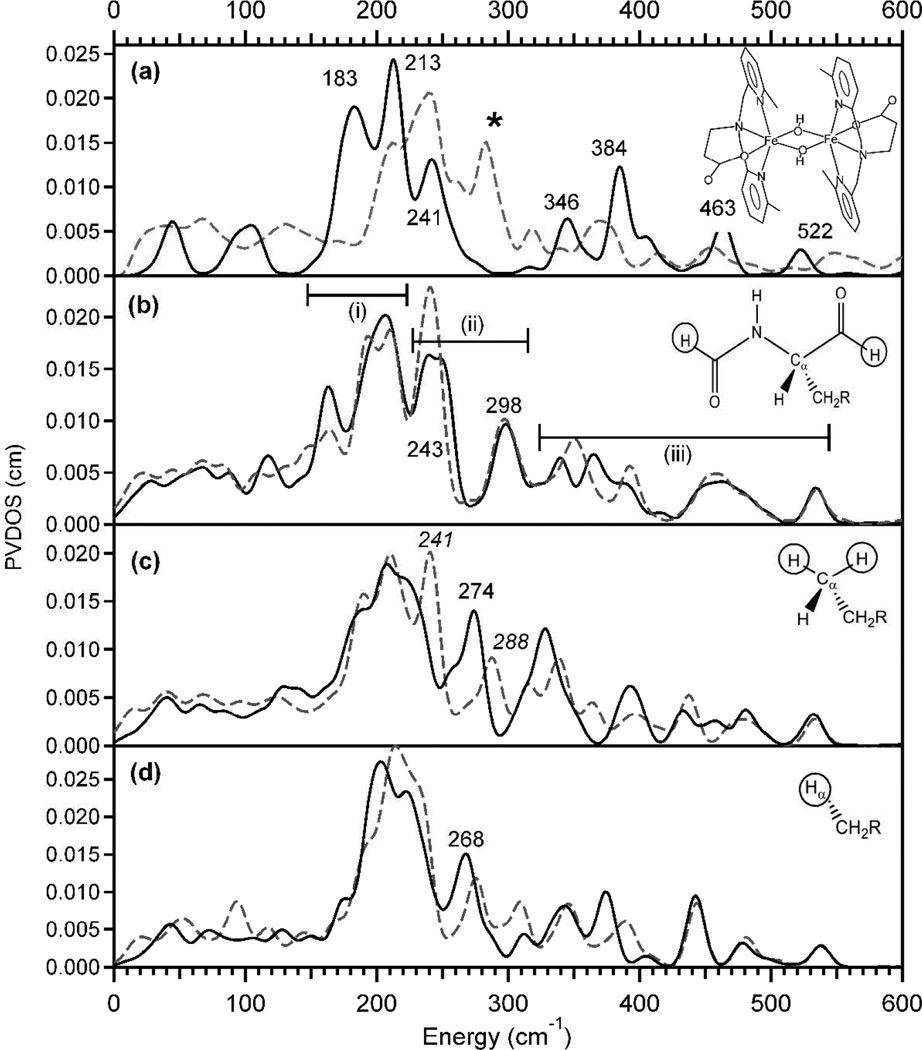
Previously, we reported the NRVS data of a bis(µ-OH)-bridged biferric complex [Fe2(µ-OH)2(6Me2-BPP)2]2+ (6Me2-BPP = N,N-bis(6-methyl-2-pyridylmethyl)-3-aminopropionate),34 which can be used as a representative structural model for the active site of MMO in the resting state. Its experimental NRVS spectrum (Figure 3a, gray dashed) and DFT simulation (Figure 3a, solid black), obtained using the same functional and 6–31G* basis set as described above for the MMO models, are presented. This overlay shows that DFT can reproduce the pattern of the NRVS spectrum well, while the energies of the major features in the energy range below 300 cm−1 are underestimated by ~30 cm−1.
Figure 3.
NRVS spectra of (a) [Fe2(µ-OH)2(6Me2-BPP)2]2+ (structure depicted) obtained from experiment (dashed gray) and DFT computation (solid black), and the MMO models #1 (b), #2 (c) and #3 (d). Solid black and dashed gray spectra in (b)~(d) are simulated using constraints with a mass of 1 and 100, respectively.
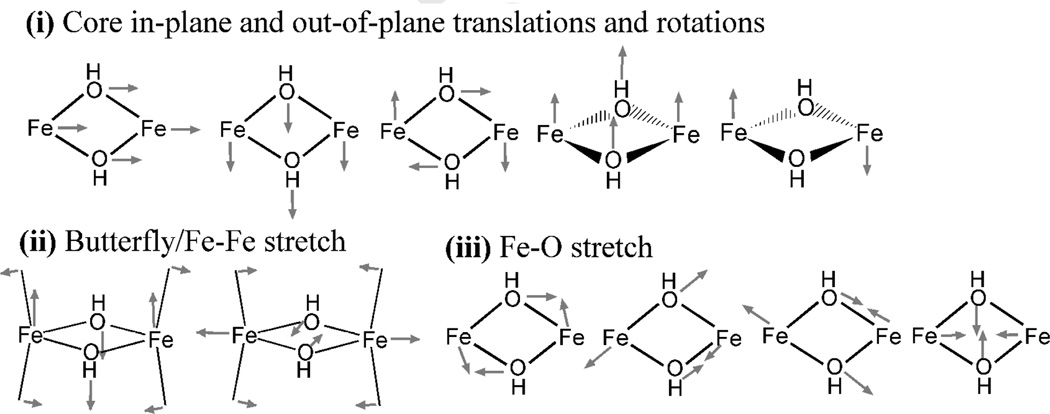
The DFT-calculated NRVS spectra obtained for the three MMO models #1~#3 are shown as solid curves at Figure 3b~d. The calculated NRVS spectrum of the largest structural MMO model #1 (Figure 3b, solid black) displays major features in a similar energy region to the NRVS spectrum of the [Fe2(µ-OH)2(6Me2-BPP)2]2+ complex (Figure 3a, solid black). Considering that, for the latter, the DFT calculation underestimated the energies of the major features by ~30 cm−1 compared to its experimental data (Figure 3a, dashed gray), the experimental data on MMO will likely appear at ~30 cm−1 higher energy than the DFT-predicted spectrum in Figure 3b, solid black. The NRVS features of this MMO model #1 can be divided into three regions (Figure 3b). Region (i) is composed of core translational and rotational motions (Figure 4i), which are consistent with the features at 183 and 213 cm−1 in Figure 3a. Region (ii) contains normal modes associated with axial ligand-Fe-µO bends, the combination of which result in the butterfly and Fe-Fe stretch motions of the core (Figure 4ii). In this region, while the [Fe2(µ-OH)2(6Me2-BPP)2]2+ model complex shows one band at 241 cm−1 (Figure 3a, solid black), the MMO model #1 (Figure 3b, solid black) shows two bands at 243 and 298 cm−1. This is due to the presence of two inequivalent Fe-axial bonds; the band at 298 cm−1 involves the motion of the water ligand on Fe1, while the band at 243 cm−1 involves the motion of the carboxylate ligand on Fe2 (Figure 2). Region (iii) involves the four Fe-µO stretches shown in Figure 4iii, which are consistent with the features at 346, 384, 463, and 522 cm−1 of the [Fe2(µ-OH)2(6Me2-BPP)2]2+ model complex (Figure 3a, solid black).
Figure 4.
DFT-calculated normal modes of the Fe2(µ-OH)2 core.
Alternatively, the DFT-predicted NRVS spectrum of the smaller structural model #2 (Figure 3c, solid black) shows a less split peak pattern than the calculated NRVS spectrum of model #1 (Figure 3b, solid black). Specifically, the solid curve in Figure 3c displays one feature at ~270 cm−1 rather than two seen in region (ii) of Figure 3b. Corresponding normal modes of this feature display significant contributions from the motions of the capping hydrogen atoms, which certainly result from the truncation modeling. Therefore, these motions were restrained by assigning artificial heavy masses to the capping atoms, and the resulting calculated NRVS spectrum is presented as a dashed line in Figure 3c. This corrected NRVS spectrum of model #2 now exhibits two bands in region (ii) at 241 and 288 cm−1 (Figure 3c, dashed gray), which are consistent with the two bands at 243 and 298 cm−1 in the DFT-calculated NRVS spectrum of model #1 (Figure 3b, solid black) that was obtained without attempting to eliminate the motions of the capping atoms. This demonstrates the importance of choosing a proper truncation scheme for the DFT prediction of NRVS data of binuclear non-heme Fe enzymes, because the motions of capping atoms can significantly (but artificially) contribute to the normal modes of 2Fe centers. Since model #1 also involved capping hydrogen atoms, their possible contributions to the DFT-predicted NRVS spectrum were also tested; the assignment of heavy masses on the capping atoms of model #1 displayed negligible changes in the calculated NRVS spectra (Figure 3b, solid black vs. dashed gray), confirming that model #1 that contains a part of protein backbone is large enough to reproduce NRVS data without limiting the motion of the capping atoms by assigning heavy masses. In the case of the smallest structural model of MMO, model #3, its DFT-calculated NRVS spectrum, regardless of whether the capping atoms are restrained by heavy masses or not, still shows a less split peak pattern than those of model #1 (Figure 3b).
3. Effects of assigning artificial heavy masses on the capping hydrogen atoms
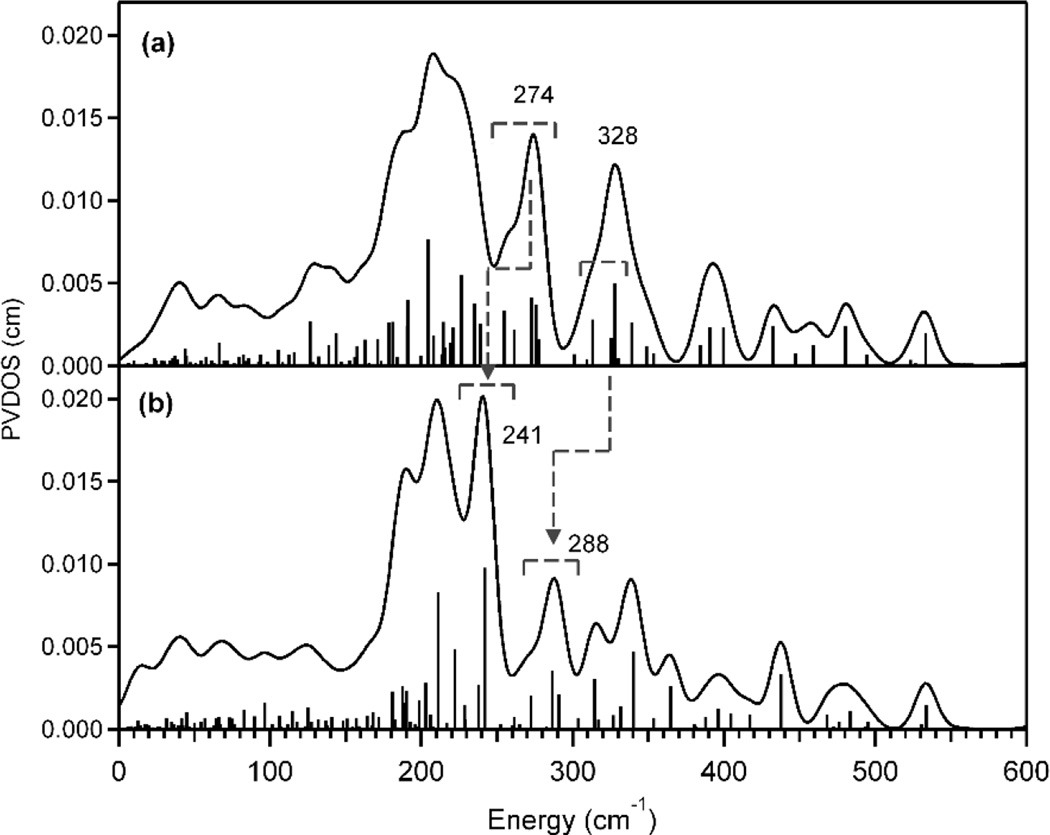
In the truncated models, the capping atoms were used to replace the protein backbone, which in reality should be more rigid thus effectively heavier than the capping hydrogen atoms. Figures 3b and 3c show that, in the frequency calculations of the truncated models, the motions of the capping hydrogen atoms, which do not exist in reality, can mix into the Fe motions, when they are not located far enough from the Fe centers. The extent of this artificial mixing was estimated by assigning heavy masses to the capping hydrogen atoms; Figure 3b shows that this artificial effect is minor in truncation scheme #1 (i.e., where a part of protein backbone is included), while Figure 3c shows that for the scheme #2 restraining the motions of the capping hydrogen atoms with increased effective masses limits their mixing with Fe motion and gives good agreement with the larger structural model #1. This improvement is reproduced in Figure 5, showing that, upon assigning heavy masses to the capping atoms, two bands appear in region (ii) and the calculated spectrum of model #2 becomes more consistent with that of model #1 in Figure 3b. The band at 241 cm−1 in Figure 5b originated from the band at 274 cm−1 in Figure 5a, which involves the Cα-C-C bend motions that shift down in energy as the heavy capping hydrogen atoms restrain the motions of the Cα. The band at 288 cm−1 in Figure 5b corresponds to the feature in the lower energy side of the band at 328 cm−1 in Figure 5a that is shifted down in energy with inclusion of mass constraints on the Hcap-Cα-C-C and Hcap-Cα-C-H torsional vibrations. Alternatively, Figure 3d shows that the corresponding artificial motions in model #3, the Cβ-C-C bend and Hα-Cβ-C-C torsional vibrations, were not effectively restrained by the assignment of heavy masses on Hα’s in Figure 1, because each amino acid of model #3 has only one capping atom while that of model #2 has two.
Figure 5.
DFT-predicted NRVS spectra of the MMO model #2 simulated with a constraint mass of 1 (a) and 100 (b).
Discussion
The electronic structural and spectral properties of metalloenzymes have been successfully analyzed with the aid of DFT calculations performed on small, truncated active-site models.8–13 Indeed, for the active site of MMO in the resting state, the calculated geometry of the Fe2(µ-OH)2 core was invariant upon changes in truncation scheme (Table 1), confirming that a small active-site model is sufficient to reproduce the geometric structure and electronic spectra10, 35 of binuclear non-heme Fe systems.
However, for the simulation of NRVS data, a proper truncation scheme is necessary, because capping atoms used for truncation can have artificial motions that mix into the motions of the 2Fe center, when these capping atoms are not far enough away from the 2Fe core. Contributions from these artificial motions are especially prominent for the coupled motions of the binuclear Fe core, i.e., the butterfly and Fe-Fe stretch modes in the energy region of 240~330 cm−1, where the bending and torsional vibrations of the capping atoms contribute. These artificial motions can be effectively eliminated by including a significant part of the protein backbone as seen in the largest model #1 (Figure 3b; where introduction of heavy capping atoms had no effect) or by having two constraints on the backbone and assigning heavy masses to these as in model #2. These DFT predicted NRVS spectra agree well with preliminary NRVS data obtained on the resting state of MMO, which will be published elsewhere.
This proper calibration of DFT methodology will be important in applying the NRVS technique to determine the geometric structure of unknown binuclear non-heme Fe enzyme intermediates. Moreover, once the appropriate DFT model that reproduces the NRVS data of an intermediate is available, it can be further used to evaluate the reaction coordinate of catalysis. Considering that the construction of a reaction coordinate is often multidimensional and requires numerous computations, a truncation scheme extended only up to Cα’s but with heavy capping atoms will provide a reasonably sized model for the determination of the active-site structure based on NRVS data that can then be applied for insight into reactivity.
Supplementary Material
Acknowledgments
Financial support for this research was provided by National Science Foundation (MCB-0919027) and National Institutes of Health (GM-40392).
References
- 1.Sturhahn W. J. Phys. Condens Matter. 2004;16:S497–S530. [Google Scholar]
- 2.Tinberg CE, Tonzetich ZJ, Wang H, Do LH, Yoda Y, Cramer SP, Lippard SJ. J. Am. Chem. Soc. 2010;132:18168–18176. doi: 10.1021/ja106290p. [DOI] [PMC free article] [PubMed] [Google Scholar]
- 3.Wong SD, Srnec M, Matthews ML, Liu LV, Kwak Y, Park K, Bell CB, Alp EE, Zhao J, Yoda Y, Kitao S, Seto M, Krebs C, Bollinger M, Jr, Solomon EI. Nature. 2013;499:320–323. doi: 10.1038/nature12304. [DOI] [PMC free article] [PubMed] [Google Scholar]
- 4.Zeng W, Barabanschikov A, Zhang Y, Zhao J, Sturhahn W, Alp EE, Sage JT. J. Am. Chem. Soc. 2008;130:1816–1817. doi: 10.1021/ja077823+. [DOI] [PubMed] [Google Scholar]
- 5.Zeng W, Silvernail N, Wharton D, Georgiev G, Leu B, Scheidt W, Zhao J, Sturhahn W, Alp EE, Sage JT. J. Am. Chem. Soc. 2005;127:11200–11201. doi: 10.1021/ja051052x. [DOI] [PMC free article] [PubMed] [Google Scholar]
- 6.Elango N, Radhakrishnan R, Froland WA, Wallar BJ, Earhart CA, Lipscomb JD, Ohlendorf DH. Protein Sci. 1997;6:556–568. doi: 10.1002/pro.5560060305. [DOI] [PMC free article] [PubMed] [Google Scholar]
- 7.(a) Fox BG, Froland WA, Dege J, Lipscomb JD. J. Biol. Chem. 1989;264:10023–10033. [PubMed] [Google Scholar]; (b) Lee SK, Fox BG, Froland WA, Lipscomb JD, Munck E. J. Am. Chem. Soc. 1993;115:6450–6451. [Google Scholar]
- 8.Han W, Noodleman L. Dalton Trans. 2009;30:6045–6057. doi: 10.1039/b903847g. [DOI] [PMC free article] [PubMed] [Google Scholar]
- 9.Han W, Noodleman L. Inorg. Chim. Acta. 2008;361:973–986. doi: 10.1016/j.ica.2007.06.007. [DOI] [PMC free article] [PubMed] [Google Scholar]
- 10.Jensen KP, Bell CB, Clay MD, Solomon EI. J. Am. Chem. Soc. 2009;131:12155–12171. doi: 10.1021/ja809983g. [DOI] [PubMed] [Google Scholar]
- 11.Siegbahn PE. Inorg. Chem. 1999;38:2880–2889. doi: 10.1021/ic981332w. [DOI] [PubMed] [Google Scholar]
- 12.Siegbahn PE, Blomberg MR. Annu. Rev. Phys. Chem. 1999;50:221–249. doi: 10.1146/annurev.physchem.50.1.221. [DOI] [PubMed] [Google Scholar]
- 13.Dunietz BD, Beachy MD, Cao Y, Whittington DA, Lippard SJ, Friesner RA. J. Am. Chem. Soc. 2000;122:2828–2839. [Google Scholar]
- 14.Frisch MJ, Trucks GW, Schlegel HB, Scuseria GE, Robb MA, Cheeseman JR, Scalmani G, Barone V, Mennucci B, Petersson GA, Nakatsuji H, Caricato M, Li X, Hratchian HP, Izmaylov AF, Bloino J, Zheng G, Sonnenberg JL, Hada M, Ehara M, Toyota K, Fukuda R, Hasegawa J, Ishida M, Nakajima T, Honda Y, Kitao O, Nakai H, Vreven T, Montgomery JA, Jr, Peralta JE, Ogliaro F, Bearpark M, Heyd JJ, Brothers E, Kudin KN, Staroverov VN, Keith T, Kobayashi R, Normand J, Raghavachari K, Rendell A, Burant JC, Iyengar SS, Tomasi J, Cossi M, Rega N, Millam JM, Klene M, Knox JE, Cross JB, Bakken V, Adamo C, Jaramillo J, Gomperts R, Stratmann RE, Yazyev O, Austin AJ, Cammi R, Pomelli C, Ochterski JW, Martin RL, Morokuma K, Zakrzewski VG, Voth GA, Salvador P, Dannenberg JJ, Dapprich S, Daniels AD, Farkas O, Foresman JB, Ortiz JV, Cioslowski J, Fox DJ. Gaussian 09, Revision B.01. Wallingford CT: Gaussian, Inc.; 2010. [Google Scholar]
- 15.Ditchfield R, Hehre WJ, Pople JA. J. Chem. Phys. 1971;54:724–728. [Google Scholar]
- 16.Hehre WJ, Ditchfield R, Pople JA. J. Chem. Phys. 1972;56:2257–2261. [Google Scholar]
- 17.Harihara PC, Pople JA. Mol. Phys. 1974;27:209–214. [Google Scholar]
- 18.Harihara PC, Pople JA. Theor. Chim. Acta. 1973;28:213–222. [Google Scholar]
- 19.Gordon MS. Chem. Phys. Lett. 1980;76:163–168. [Google Scholar]
- 20.Francl MM, Pietro WJ, Hehre WJ, Binkley JS, Gordon MS, Defrees DJ, Pople JA. J. Chem. Phys. 1982;77:3654–3665. [Google Scholar]
- 21.Binning RC, Curtiss LA. J. Comp. Chem. 1990;11:1206–1216. [Google Scholar]
- 22.Blaudeau JP, McGrath MP, Curtiss LA, Radom L. J. Chem. Phys. 1997;107:5016–5021. [Google Scholar]
- 23.Rassolov VA, Pople JA, Ratner MA, Windus TL. J. Chem. Phys. 1998;109:1223–1229. [Google Scholar]
- 24.Rassolov VA, Ratner MA, Pople JA, Redfern PC, Curtiss LA. J. Comp. Chem. 2001;22:976–984. [Google Scholar]
- 25.Frisch MJ, Pople JA, Binkley JS. J. Chem. Phys. 1984;80:3265–3269. [Google Scholar]
- 26.Becke AD. Phys. Rev. A. 1988;38:3098–3100. doi: 10.1103/physreva.38.3098. [DOI] [PubMed] [Google Scholar]
- 27.Perdew JP. Phys. Rev. B. 1986;33:8822–8824. doi: 10.1103/physrevb.33.8822. [DOI] [PubMed] [Google Scholar]
- 28.Hohenberg P, Kohn W. Phys. Rev. B. 1964;136:B864–B871. [Google Scholar]
- 29.Kohn W, Sham LJ. Phys. Rev. 1965;140:A1133–A1138. [Google Scholar]
- 30.Slater JC. The Self-Consistent Field for Molecular and Solids, Quantum Theory of Molecular and Solids. Vol. 4. New York: McGraw-Hill; 1974. [Google Scholar]
- 31. http://www.stanford.edu/group/solomon/gennrvs/gennrvs.py.txt.
- 32.Rosenzweig AC, Brandstetter H, Whittington DA, Nordlund P, Lippard SJ, Frederick CA. Proteins: Struct. Funct. Bioinf. 1997;29:141–152. [PubMed] [Google Scholar]
- 33.Tinberg CE, Lippard SJ. Acc. Chem. Res. 2011;44:280–288. doi: 10.1021/ar1001473. [DOI] [PMC free article] [PubMed] [Google Scholar]
- 34.Park K, Tsugawa T, Furutachi H, Kwak Y, Liu LV, Wong SD, Yoda Y, Kobayashi Y, Saito M, Kurokuzu M, Seto M, Suzuki M, Solomon EI. Angew. Chem. Int. Ed. 2013;52:1294–1298. doi: 10.1002/anie.201208240. [DOI] [PubMed] [Google Scholar]
- 35.Srnec M, Rokob TA, Schwartz JK, Kwak Y, Rulíšek L, Solomon EI. Inorg. Chem. 2012;51:2806–2820. doi: 10.1021/ic2018067. [DOI] [PubMed] [Google Scholar]
Associated Data
This section collects any data citations, data availability statements, or supplementary materials included in this article.


