Abstract
Nucleocytoplasmic transport refers to the import and export of large molecules from the cell nucleus. Recently, a number of studies have shown a connection between amyotrophic lateral sclerosis (ALS) and impairments in the nucleocytoplasmic pathway. ALS is a neurodegenerative disease affecting the motor neurons and resulting in paralysis and ultimately in death, within 2-5 years on average. Most cases of ALS are sporadic, lacking any apparent genetic linkage, but 10% are inherited in a dominant manner. Recently, hexanucleotide repeat expansions (HREs) in the chromosome 9 open reading frame 72 (C9orf72) gene were identified as a genetic cause of ALS and frontotemporal dementia (FTD). Importantly, different groups have recently proposed that these mutants affect nucleocytoplasmic transport. These studies have mostly shown the final outcome and manifestations caused by HREs on nucleocytoplasmic transport, but they do not demonstrate nuclear transport dysfunction in real time. As a result, only severe nucleocytoplasmic transport deficiency can be determined, mostly due to high overexpression or exogenous protein insertion.
This protocol describes a new and very sensitive assay to evaluate and quantify nucleocytoplasmic transport dysfunction in real time. The rate of import of a NLS-NES-GFP protein (shuttle-GFP) can be quantified in real time using fluorescent microscopy. This is performed by using an exportin inhibitor, thus allowing the shuttle GFP only to enter the nucleus. To validate the assay, the C9orf72 HRE translated dipeptide repeats, poly(GR) and poly(PR), which have been previously shown to disrupt nucleocytoplasmic transport, were used. Using the described assay, a 50% decrease in the nuclear import rate was observed compared to the control. Using this system, minute changes in nucleocytoplasmic transport can be examined and the ability of different factors to rescue (even partially) a nucleocytoplasmic transport defect can be determined.
Keywords: Neuroscience, Issue 123, nucleocytoplasmic transport, shuttle GFP, NSC-34 cells, C9orf72, ALS
Introduction
The nuclear pore complex (NPC) controls the import and export of large molecules into and out of the cell nucleus. In contrast to small molecules, which can enter the nucleus without regulation1, the transport of larger molecules is strongly controlled by the NPC. These large molecules, such as proteins and RNA, associate with transport factors, including importins and exportins, to be imported and exported from the nucleus2. In order to be imported, proteins must contain a small peptide motif, generally called a nuclear localization signal (NLS), which is bound by importins2. These sequences of amino acids act as a tag and are diverse in composition34. Proteins can be exported from the nucleus to the cytoplasm due to their association with exportins, which bind a signal sequence, generally called a nuclear export signal (NES)2. Both importins and exportins are able to transport their cargo due to the regulation of the small Ras related nuclear protein GTPase (Ran)2. Ran has been shown to exist in different conformational states depending on whether it is bound to GTP or GDP. When bound to GTP, Ran can bind to importins or exportins. Upon binding to RanGTP, importins release their cargo, while exportins must bind RanGTP to form a complex with their export cargo. The dominant nucleotide binding state of Ran depends on its location in the nucleus (RanGTP) or the cytoplasm (RanGDP).
Recently, a number of studies have shown a connection between impairments in the nucleocytoplasmic pathway and both amyotrophic lateral sclerosis (ALS) and frontotemporal dementia (FTD)5,6,7,8,9,10,11,12. ALS is a progressive and fatal neurodegenerative disease affecting both upper and lower motor neurons (MNs)13 and resulting in paralysis and ultimately in death, within 2-5 years on average. Most cases of ALS are classified as sporadic (SALS), lacking any apparent genetic linkage, but 10% are inherited in a dominant manner (familial ALS; FALS). Recently, hexanucleotide repeat expansions (HREs) in the chromosome 9 open reading frame 72 (C9orf72) gene were identified1415 as a genetic cause of ALS and FTD. These mutants account for 30-40% of FALS cases16, and different studies have contended that they cause toxicity by affecting nucleocytoplasmic transport56789101112.
These studies have mostly shown the final outcomes and manifestations of HREs on nucleocytoplasmic transport, but they do not demonstrate nucleocytoplasmic disruption in real time. As a result, only severe nucleocytoplasmic transport deficiency has been evaluated111718.
This protocol describes a new and very sensitive assay to evaluate and quantify nucleocytoplasmic transport dysfunction in real time. The rate of import of a NLS-NES-GFP protein (shuttle-GFP) can be quantified in real time using fluorescent microscopy. This is done using an exportin inhibitor, as described previously18, thus allowing the shuttle-GFP only to enter the nucleus. Using florescent microscopy and a software capable of quantifying fluorescent changes in real time, it is possible to quantify gradual changes in the fluorescence intensity of the shuttle-GFP, located in the nucleus. As a result, a Michaelis-Menten-like saturation curve of the fluorescence-to-time axis, representing the amount of nuclear shuttle-GFP at any given time, can be made. By using the initial linear rate of the curves, it is possible to generate a slope, which represents the rate of entry into the nucleus before fluorescence saturation.
To validate the assay, the translated C9orf72 dipeptide repeats, poly(GR) and poly(PR), which have been previously reported to disrupt nucleocytoplasmic transport, were used5781012. Using this assay, a 50% decrease in the nuclear import rate was observed compared to the control. Using this system, minute changes in nucleocytoplasmic transport can be examined. Moreover, the ability of different factors to rescue a nucleocytoplasmic transport defect can be determined.
Protocol
1. Cell Line Preparation
Thaw approximately 1,000,000 mouse neuroblastoma spinal cord cells (NSC-34 cells) that were stored in a liquid nitrogen container. Use a 37 °C water incubator until the cells are fully thawed.
Add fresh, warm medium (DMEM medium containing 10% fetal bovine serum (FBS), 1% L-glutamine, and 1% pen-strep antibiotics).
Centrifuge thawed cells (SL16R) at 500 x g for 5 min, forming a cell pellet. Discard the medium and add 1 mL of new medium for the cell resuspension.
Place the resuspended cells in a 15 mL flask and add an extra 5 mL of medium. Incubate the cells overnight in a sterile incubator with 5% CO2 at 37 °C.
In parallel, place 8 uncoated coverslips (cover glass: 12 mm, 0.13-0.17 mm thick) in a 60-mm culture dish and sterilize using 70% ethanol and exposure to 30 min of UV light until it is dry. Add medium to each dish and dispose to wash off the residual ethanol.
Add trypsin buffer (2.5 g of trypsin and 0.2 g of EDTA in 1 L of Hanks' Balanced Salt Solution) to the cells after they reach approximately 90% confluence (roughly 6 million cells per flask) to allow adherent cells to dissociate. NOTE: NSC-34 cells are sensitive and only require 15 s of trypsin buffer incubation and 1 additional min of incubation free of trypsin before dissociation using the medium.
Plate the cells onto the 60 mm culture dishes already containing the coverslips with 3 mL of medium, approximately 350,000 per dish. Leave them in the incubator for 24 h to allow cell attachment onto the coverslips.
2. Cell Transfection
NOTE: After approximately 24 h, the NSC-34 cells will reach 40% confluence (approximately 800,000 cells) and will be ready for transfection.
Prepare pure DMEM medium (300 µL of DMEM medium for each 60 mm culture dish) in sterile microcentrifuge tubes.
Add 2 µg of each plasmid required for transfection to each DMEM-containing microcentrifuge tube. NOTE: The shuttle-GFP plasmid is mandatory in all cell transfections.
Add transfection reagent to all the microcentrifuge tubes that contain their required plasmids. Here, add 4 µL of the commercial transfection reagent for each 2 µg of DNA.
Vortex the microcentrifuge tubes containing DMEM, plasmids, and the transfection reagent and incubate them at room temperature for 25 min.
Add each microcentrifuge tube to a culture dish and stir the dish gently to form a homogenous solution. Place the dish back in the incubator for 48 h. NOTE: Since shuttle-GFP should be expressed in all cells, the shuttle-GFP transfection efficiency can be partially examined and pre-tested using fluorescent microscopy after overnight transfection. A full examination of non-fluorescent expressed proteins can be conducted using an immunoblot analysis.
3. Microscopy
Attach the coverslips containing transfected NSC-34 cells to a coverslip holder and wash gently with phosphate-buffered saline (PBS) to remove the detached dead cells.
Identify a suitable cell patch using a green fluorescent filter with an inverted microscope. NOTE: A suitable cell patch is defined as a microscope field of view showing a large number of cells (20-30 cells in a field) and in which the nuclei are clearly defined in the cells. Cell nuclei within the cell patch are first identified by eye and are manually marked by the imaging software.
Add 200 µL of an exportin-1 inhibitor Leptomycin B (LMB) buffer containing 10 ng/mL LMB in PBS to the coverslips by dripping the buffer on the coverslips under the microscope. NOTE: This point in time is set as interval zero.
Quantify the fluorescent intensity of the marked nuclei in 3 s intervals for around 400-500 s.
Test between 3 and 5 cover slips for each transfection group in each individual experiment.
4. Analysis
NOTE: Since different cells express different levels of florescent shuttle-GFP, it is important to normalize the nuclear fluorescent intensity of each cell to its own initial fluorescent intensity.
Normalize the fluorescent intensity of the marked nuclei by dividing 3-s fluorescent interval of each nucleus with the average of the initial six intervals of that nucleus.
After the normalization of each nucleus, produce a fluorescent intensity curve representing the change in nuclei fluorescence as a function of time for each cell patch. To do this, calculate the average of all the cells in each cell-patch (consisting of approximately 20-30 cells in each patch). NOTE: The nuclei fluorescent intensity curve resembles a Michaelis-Menten saturation curve, which is better observed within increased time periods. This is due to a decrease in the cytosolic amounts of shuttle-GFP with time due to nuclear transport. This decrease statistically lowers the probability of a shuttle-GFP to transport into the nucleus, thus reaching saturation in nuclear fluorescence. The slope derived from the linear initial rate of the curve yields the Vmax entry rate into the nucleus.
Analyze the Vmax slopes of each cell patch, derived from three to five independent experiments, using the graphing software to produce one slope representing each experimental group. Perform quantification using one-way ANOVA statistical analysis.
5. Protein Expression Validation
Place 60 mm culture dishes containing the residual cells (not used in the above experiment) from each experimental group on ice.
Dispose the medium and wash the cells twice with PBS to dilute and wash the remaining medium.
Treat the cells with 200-400 µL of lysis buffer containing PBS, 0.5% Triton, and protease inhibitor cocktail tablet (PI). Scrape using a cell scraper.
Collect the cells in lysis buffer in a microcentrifuge tube and homogenize with a homogenizer at 4,000 rpm for 1 min under ice.
Centrifuge the homogenized cells at 2,500 x g for 10 min. Collect the supernatant, quantify the protein concentration using a Bradford assay, and store until use at -20 °C.
Collect between 30 and 70 µg of total protein (depending on the protein) and load it into a SDS-PAGE gel to test for protein expression using an immunoblot assay.
Representative Results
Using the procedure presented here, motor neuron-like NSC-34 cells were transfected with a NLS-NES-GFP (shuttle-GFP) protein. This protein, which has NLS and NES signal sequences (Figure 1), can shuttle between the nucleus and the cytoplasm. Generic GFP can enter or exit the nucleus in the absence of any localization signal tag only by diffusion and is therefore distributed evenly between the nucleus and the cytoplasm (Figure 2A). In contrast, the shuttle-GFP protein is mostly found in the cytoplasm due to the NES and NLS signals affecting its dispersion (Figure 2B). Thus, only the addition of the exportin inhibitor leptomycin B (LMB), which inhibits the protein export, allows for the accumulation of the shuttle-GFP into the nucleus and eventually for the measurement of the shuttle-GFP import rate (Figure 2C). Using a florescent microscope and software to quantify fluorescent changes in real time, gradual changes in the nuclear fluorescence intensity of the shuttle-GFP can be quantified. As a result, a Michaelis-Menten-like saturation curve of the fluorescence-to-time axis (Figure 3), representing the amount of nuclear shuttle-GFP at any given time, can be produced. By using the initial linear rate of the curves (as indicated by the circle in Figure 3), a slope, which represents the rate of entry into the nucleus before fluorescence saturation, can be generated.
Several studies indicate that different C9orf72 proteins are toxic in Drosophila melanogaster models and/or cultured cells6,11. The di-peptide repeats (DPRs), poly(PR) and poly(GR), produced from HREs in the mutated C9orf72 gene, were found to induce nucleolar stress8,19,20 and have been implicated in impaired nucleocytoplasmic transport, making them appear especially harmful. To verify the utility of the described assay, motor neuron-like NSC-34 cells were transfected with these two DPR plasmids, poly(PR) and poly(GR). Since poly(PR) and poly(GR) DPRs are conjugated to GFP as well, it was important to validate that the DPRs were not affected by leptomycin-B as well, which would result in a false-positive result. Poly(PR) expression was observed in the nucleus completely as inclusions; thus, it could not give a false-positive nuclear import signal (Figure 4A). Poly(GR) expression, on the other hand, was observed homogeneously in the cytosol and also as inclusions in the nucleus (Figure 4B). When transfecting NSC-34 cells with poly(GR) only and adding leptomycin-B, no shuttle movement of the expressed poly(GR) was observed (Figure 5).
By analyzing the nucleocytoplasmic transport rate of the shuttle-GFP, NSC-34 cells were found to co-express either poly(PR) or poly(GR) DPRs, showing a decrease in the nuclear import rate of about 50% as compared to cells transfected with an empty plasmid as a control (Figure 5).
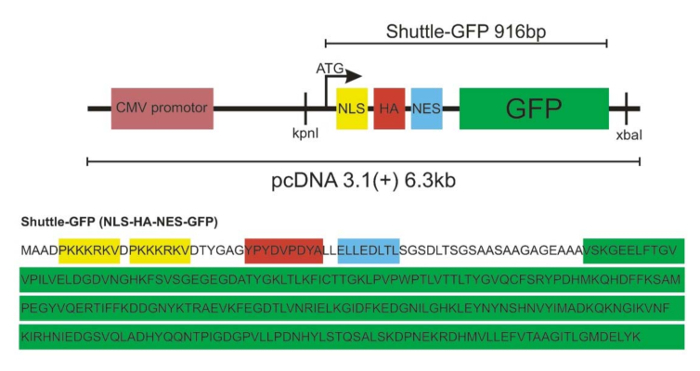 Figure 1: Schematic of the NLS-NES-GFP (shuttle-GFP) construct.
Please click here to view a larger version of this figure.
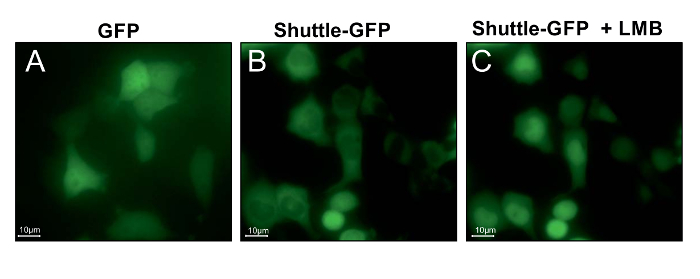 Figure 2: Leptomycin B inhibits the export of shuttle-GFP from the nuclei of NSC-34 cells. Representative images of NSC-34 cells expressing generic GFP (A) or shuttle-GFP protein before (B) and 20 min after the addition of 10 ng/mL Leptomycin B (LMB) (C). Following LMB addition, shuttle-GFP imports into the nucleus, but the export back to the cytoplasm is blocked. Thus, shuttle-GFP accumulates in the nuclei. Scale bar = 15 µm. Please click here to view a larger version of this figure.
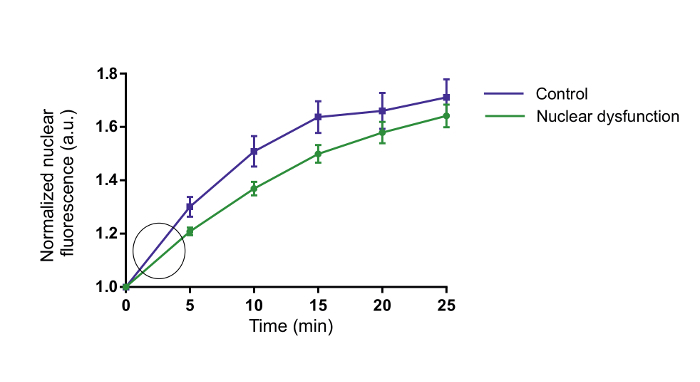 Figure 3: Michaelis-Menten-like plot showing an increase in nuclear fluorescence. Representative Michaelis-Menten-like curves portraying an increase in the nuclear fluorescence of two groups, affected and non-affected nucleocytoplasmic transport cells, within 25 min. The initial 5 min show a high difference in increase rate, which is decreased over time. Please click here to view a larger version of this figure.
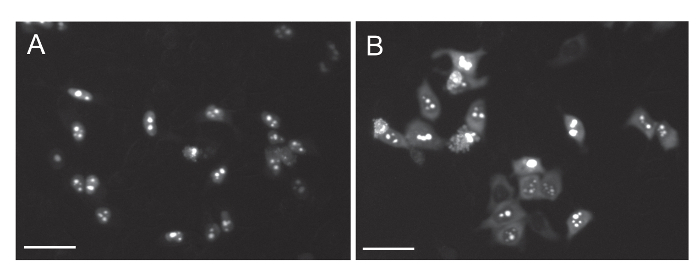 Figure 4: C9orf72 DPRs poly(PR) and poly(GR) expression in NSC-34 cells. Representative images of NSC-34 cells transfected with the C9orf72 DPRs, poly(GR) (A) and poly(PR) (B). poly(GR) is expressed in the nuclei of the cells but is also distributed homogeneously in the cytosol. Poly(PR) is expressed mainly in the nuclei. Scale bar = 30 µm. Please click here to view a larger version of this figure.
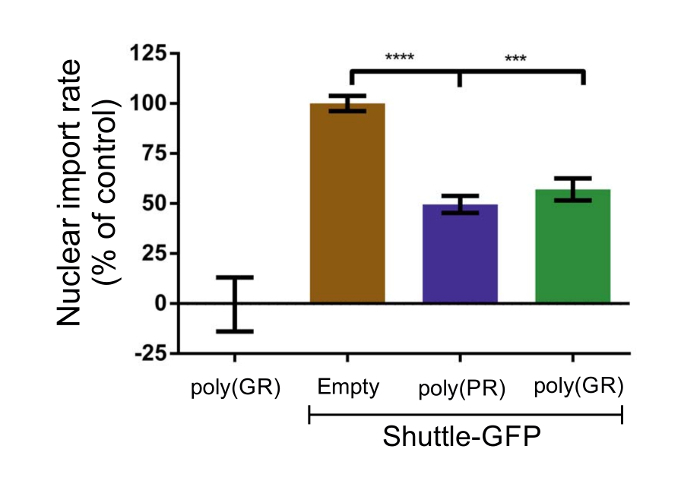 Figure 5: The C9orf72 DPRs, poly(PR) and poly(GR), strongly inhibit the nuclear import rate in NSC-34 cells. Motor neuron-like NSC-34 cells were co-transfected with shuttle-GFP, together with an empty plasmid, poly(PR) or poly(GR). The nuclear import rate was defined as the slope of the initial linear rate of the curve at Vmax. The transport rate obtained with the empty plasmid was define as 100%. Co-transfection with poly(PR) and poly(GR) inhibited the transport rate by about 50% compared to control. Quantitative analysis was performed on three to five independent experiments using one way ANOVA. **** p <0.0001; *** p <0.001. Please click here to view a larger version of this figure.
Discussion
This protocol demonstrates a highly sensitive and quantitative new assay to evaluate minute changes in nucleocytoplasmic transport. Using this system, it is possible to observe and measure nucleocytoplasmic transport and its dysfunction in real time, not only large defects that result in dramatic changes in protein distribution. This assay not only has a sensitivity advantage, but it also requires little preparation, is inexpensive, and is a very easy and low-engagement assay.
To test the efficiency of this system, C9orf72 proteins, poly(GR) and poly(PR) DPRs, models of ALS and FTD that were previously shown to cause a nucleocytoplasmic transport deficiency, were used5,7,8,10,12. Using this assay, it was possible to demonstrate, in real time, a decrease of about 50% in the nuclear import rate in cells expressing the DPRs as compared to cells transfected with a control vector. Therefore, this system opens the possibility of easily measuring small changes in nucleocytoplasmic transport, which can be caused by these and other ALS or FTD mutants or other diseases in which potential defects in nucleocytoplasmic transport may exist. Although the protocol described here deals with motor neuron-like cells, it could be easily adapted to other cell types. Most importantly, using this system, it is now possible to determine how different molecular factors or drugs may help to prevent or rescue (even partially) nucleocytoplasmic transport deficiencies in ALS, FTD, or other disorders.
One possible limitation in using this assay is the limited ability to observe and mark the cell nuclei in cells that do not possess a clear nucleus or that possess a very small one. To overcome this, a possible solution may be to simply use a greater magnification. However, this will ultimately decrease the amount of cells in each cell patch, thus increasing the amount of experiments needed to reach a significant value.
Another consideration relates to the shuttle-GFP nucleus-to-cytoplasm ratio before the addition of LMB. This ratio may be very different in different cell types and consequently may be too small (close to a 1:1 ratio) to show a visible nucleus. One possible solution is to use a nuclear marker beforehand. This will not affect the final analysis, since each cell is normalized to its original nuclear fluorescence. In addition, it is recommended to calibrate the concentration of LMB used for exportin inhibition before this assay is performed to effectively observe the optimal increase in nuclear fluorescence.
The nucleocytoplasmic transport deficiency is suggested to play a main role in the degeneration of motor neurons in ALS5,6,7,8,9,10,11,12. If that is the case, similar nucleocytoplasmic transport defects as those observed in the C9orf72 model would be predicted to play a role in other ALS models. However, because of the large variability between the different models, the end outcomes and molecular manifestations resulting from nucleocytoplasmic disruption in each case may be unnoticed or phenotypically different. Despite extensive research on different FALS models, linking them with common mechanisms remains a challenge. This assay may now provide the opportunity to overcome, at least partially, this challenge.
Disclosures
Authors have nothing to disclose.
Acknowledgments
We thank all the members of the A.I. laboratory for their helpful comments and suggestions. We would like to thank Prof. Mark Hipp (Max Planck Institute for Biochemistry) for providing us with the shuttle-GFP vector. This work was supported by grants from the Israeli Science Foundation (ISF #124/14), the Binational Science Foundation (BSF #2013325), FP7 Marie Curie Career Integration Grant (CIG # 333794), and The National Institute for Psychobiology in Israel (NIPI #b133-14/15).
References
- Alberts B. Molecular biology of the cell. 4th edn. Garland Science; 2002. [Google Scholar]
- Freitas N, Cunha C. Mechanisms and signals for the nuclear import of proteins. Curr Genomics. 2009;10:550–557. doi: 10.2174/138920209789503941. [DOI] [PMC free article] [PubMed] [Google Scholar]
- Kalderon D, Roberts BL, Richardson WD, Smith AE. A short amino acid sequence able to specify nuclear location. Cell. 1984;39:499–509. doi: 10.1016/0092-8674(84)90457-4. [DOI] [PubMed] [Google Scholar]
- la Cour T, et al. Analysis and prediction of leucine-rich nuclear export signals. Protein Eng Des Sel. 2004;17:527–536. doi: 10.1093/protein/gzh062. [DOI] [PubMed] [Google Scholar]
- Boeynaems S, et al. Drosophila screen connects nuclear transport genes to DPR pathology in c9ALS/FTD. Sci Rep. 2016;6:20877. doi: 10.1038/srep20877. [DOI] [PMC free article] [PubMed] [Google Scholar]
- Freibaum BD, et al. GGGGCC repeat expansion in C9orf72 compromises nucleocytoplasmic transport. Nature. 2015;525:129–133. doi: 10.1038/nature14974. [DOI] [PMC free article] [PubMed] [Google Scholar]
- Jovicic A, et al. Modifiers of C9orf72 dipeptide repeat toxicity connect nucleocytoplasmic transport defects to FTD/ALS. Nat Neurosci. 2015;18:1226–1229. doi: 10.1038/nn.4085. [DOI] [PMC free article] [PubMed] [Google Scholar]
- Kwon I, et al. Poly-dipeptides encoded by the C9orf72 repeats bind nucleoli, impede RNA biogenesis, and kill cells. Science. 2014;345:1139–1145. doi: 10.1126/science.1254917. [DOI] [PMC free article] [PubMed] [Google Scholar]
- Rossi S, et al. Nuclear accumulation of mRNAs underlies G4C2-repeat-induced translational repression in a cellular model of C9orf72 ALS. J Cell Sci. 2015;128:1787–1799. doi: 10.1242/jcs.165332. [DOI] [PubMed] [Google Scholar]
- Shi KY, et al. Toxic PRn poly-dipeptides encoded by the C9orf72 repeat expansion block nuclear import and export. Proc Natl Acad Sci U S A. 2017. [DOI] [PMC free article] [PubMed]
- Zhang K, et al. The C9orf72 repeat expansion disrupts nucleocytoplasmic transport. Nature. 2015;525:56–61. doi: 10.1038/nature14973. [DOI] [PMC free article] [PubMed] [Google Scholar]
- Zhang YJ, et al. C9ORF72 poly(GA) aggregates sequester and impair HR23 and nucleocytoplasmic transport proteins. Nat Neurosci. 2016;19:668–677. doi: 10.1038/nn.4272. [DOI] [PMC free article] [PubMed] [Google Scholar]
- Cleveland DW, Rothstein JD. From Charcot to Lou Gehrig: deciphering selective motor neuron death in ALS. Nat Rev Neurosci. 2001;2:806–819. doi: 10.1038/35097565. [DOI] [PubMed] [Google Scholar]
- DeJesus-Hernandez M, et al. Expanded GGGGCC hexanucleotide repeat in noncoding region of C9ORF72 causes chromosome 9p-linked FTD and ALS. Neuron. 2011;72:245–256. doi: 10.1016/j.neuron.2011.09.011. [DOI] [PMC free article] [PubMed] [Google Scholar]
- Renton AE, et al. A hexanucleotide repeat expansion in C9ORF72 is the cause of chromosome 9p21-linked ALS-FTD. Neuron. 2011;72:257–268. doi: 10.1016/j.neuron.2011.09.010. [DOI] [PMC free article] [PubMed] [Google Scholar]
- Boeve BF, et al. Characterization of frontotemporal dementia and/or amyotrophic lateral sclerosis associated with the GGGGCC repeat expansion in C9ORF72. Brain. 2012;135:765–783. doi: 10.1093/brain/aws004. [DOI] [PMC free article] [PubMed] [Google Scholar]
- Haeusler AR, Donnelly CJ, Rothstein JD. The expanding biology of the C9orf72 nucleotide repeat expansion in neurodegenerative disease. Nat Rev Neurosci. 2016;17:383–395. doi: 10.1038/nrn.2016.38. [DOI] [PMC free article] [PubMed] [Google Scholar]
- Woerner AC, et al. Cytoplasmic protein aggregates interfere with nucleocytoplasmic transport of protein and RNA. Science. 2016;351:173–176. doi: 10.1126/science.aad2033. [DOI] [PubMed] [Google Scholar]
- Tao Z, et al. Nucleolar stress and impaired stress granule formation contribute to C9orf72 RAN translation-induced cytotoxicity. Hum Mol Genet. 2015;24:2426–2441. doi: 10.1093/hmg/ddv005. [DOI] [PubMed] [Google Scholar]
- Wen X, et al. Antisense proline-arginine RAN dipeptides linked to C9ORF72-ALS/FTD form toxic nuclear aggregates that initiate in vitro and in vivo neuronal death. Neuron. 2014;84:1213–1225. doi: 10.1016/j.neuron.2014.12.010. [DOI] [PMC free article] [PubMed] [Google Scholar]


