Abstract
The optimal design and operation of photosynthetic bioreactors (PBRs) for microalgal cultivation is essential for improving the environmental and economic performance of microalgae-based biofuel production. Models that estimate microalgal growth under different conditions can help to optimize PBR design and operation. To be effective, the growth parameters used in these models must be accurately determined. Algal growth experiments are often constrained by the dynamic nature of the culture environment, and control systems are needed to accurately determine the kinetic parameters. The first step in setting up a controlled batch experiment is live data acquisition and monitoring. This protocol outlines a process for the assembly and operation of a bench-scale photosynthetic bioreactor that can be used to conduct microalgal growth experiments. This protocol describes how to size and assemble a flat-plate, bench-scale PBR from acrylic. It also details how to configure a PBR with continuous pH, light, and temperature monitoring using a data acquisition and control unit, analog sensors, and open-source data acquisition software.
Keywords: Bioengineering, Issue 124, Photosynthetic bioreactors, microalgae, growth kinetics, biofuel, temperature, light, pH, automated monitoring
Introduction
Due to growing concerns about global climate change and finite fossil fuel resources, governments have been developing policies to reduce fossil fuel consumption and to encourage the development of new, sustainable transportation fuels. The United States Environmental Protection Agency has developed the Renewable Fuel Standard (RFS), which requires that 36 of the annual 140 billion gallons of U.S. transportation fuel mix come from renewable fuel sources by 2022. Innovative and transformational technologies will be necessary to meet these and future renewable energy standards1.
The use of microalgae-based biofuels has the potential to help meet the national RFS while reducing greenhouse gas emissions2. Microalgae-based biofuels have several advantages compared to first-generation biofuels based on terrestrial food crops, such as corn and soybeans. Unlike first-generation biofuels, algae-based biofuels consume fewer land, water, and food-related resources, since algae can be cultivated year-round and on barren land using saltwater or wastewater. Microalgae have high growth rates compared terrestrial crops and can accumulate high levels of lipids, which can be readily converted to biodiesel3. Currently, no industrial-scale algae-to-biofuel plants exist due to the high costs of the energy-intensive production processes, which consist of algal cultivation, lipid separation, and lipid refining into biodiesel. More research is needed to make these processes more efficient and sustainable.
PBRs, which are optically clear, enclosed installations for the production of phototrophic microorganisms in an artificial environment, are considered one of the most promising cultivation methods3. However, current designs still lack the volumetric productivity necessary to make the algae-to-biofuel production process more efficient and economically attractive4. Powerful mathematical models that consider light irradiance and attenuation, the transport of nutrients and CO2, and the growth of the microalgae can greatly facilitate the optimization of PBR design and operation. Bench-scale growth experiments are required to determine species-specific growth parameters for these optimization models.
Kinetic tests require the careful monitoring and control of experimental setups to prevent unintended inhibitors of growth. Given the photosynthetic nature of algae (i.e., their consumption of CO2 and absorption of light), maintaining controlled conditions is especially difficult in bench-scale PBRs. As depicted in Equation 1, the amount of dissolved CO2 in the growth medium, commonly denoted as ![]() (Equation 2), will be, at minimum, a function of: 1) the CO2 partial pressure and Henry's equilibrium constant, which dictates the amount of gas that will dissolve in solution (Equation 3); 2) the initial chemical composition of the growth medium, which impacts the speciation and activity of the carbonate ions and pH (Equations 4 and 5); and 3) the temperature, which impacts Equations 3-55.
(Equation 2), will be, at minimum, a function of: 1) the CO2 partial pressure and Henry's equilibrium constant, which dictates the amount of gas that will dissolve in solution (Equation 3); 2) the initial chemical composition of the growth medium, which impacts the speciation and activity of the carbonate ions and pH (Equations 4 and 5); and 3) the temperature, which impacts Equations 3-55.
![]()
![]()
![]()
![]()
![]()
The various phases and the chemical speciation of carbon create a challenge for measuring and maintaining a consistent dissolved carbon concentration within a PBR while holding other conditions constant (e.g., the pH increases as the algae consume CO2, and increasing the dissolved CO2 substrate can possibly lead to an acidic environment that inhibits growth)6.
An additional layer of complexity for controlling conditions during algal kinetic tests involves the light intensity within the PBR. The average light intensity inside a PBR is a function of not only the incident light intensity, but also the design (e.g., material, shape, depth, and mixing), the absorbance of algal biomass components (particularly chlorophyll), and the light-scattering properties of the algal cells. As the algae grow, the average light intensity will decrease. This change in light intensity, whether caused by an increase in total cells and biomass, an increase in chlorophyll content per cell, or both, can eventually induce a metabolic response, such as an increase in chlorophyll production per cell or the use of carbohydrate and lipid storage products for energy7. Continuous monitoring of the light intensity from within the reactor provides invaluable information. This data can help to ensure that conditions stay within a specified range and can be used to help estimate algal growth and absorbance parameters if combined with other measurements (i.e., biomass, chlorophyll concentration, reactor depth, incident light, etc.).
Understanding how algae grow under a specified set of conditions requires that the pH, dissolved CO2, light intensity, and temperature be monitored in bench-scale kinetic experiments. Many algal growth setups are not equipped to monitor conditions to the extent required for calibrating kinetic models, making the modeling process extremely challenging8. Although many companies offer bench-scale PBRs with automation and control, these bench-scale setups can be extremely expensive (~$20,000) and might not accommodate all experimental considerations of a given research question.
The first step in setting up a control-feedback system for a batch experiment is live data acquisition. This paper aims to demonstrate how to construct and set up a bench-scale PBR equipped with continuous light, pH, and temperature monitoring. This real-time monitoring setup can help to ensure that the experimental conditions stay within desired ranges, at the researcher's discretion. While this protocol does not detail specific control mechanisms, these step-by-step instructions provide a basic foundation for the data acquisition framework required before more sophisticated control feedbacks can be implemented.
Protocol
1. Construct the Bench-scale PBR Body and Lid
NOTE: For illustration purposes, Dunaliella sp., a ~10 µm halotolerant microalgae lacking a cell wall, was used as the model organism for the construction of this PBR.
- Determine the PBR volume required for the research needs.
- Determine the experimental objectives for this PBR.
- Decide which algal measurement assays, M, are necessary to characterize the growth of the algal species of interest, including the volume required per assay, v; the number of technical replicates, n; the sampling frequency, f; and the duration of experiments, t. NOTE: Project-specific research questions, algal species, and available equipment dictate the algal properties measured, the methods used for these measurements, and how frequently these measurements are taken. Biomass; cell counts; and total chlorophyll pigment, protein, lipid, carbohydrate, and external nitrate concentration measurements are common ways of assessing growth, and daily sampling over 5 - 14 days is a common approach for growth tests9,10.
- Calculate the total culture volume, Vs, required for sampling throughout one experiment using Equation 6.

- Use Equation 7 to estimate a target PBR volume, Vp, using Vs from step 1.1.3 and a maximum volume removal fraction, F.
 NOTE: Removing less than a pre-specified fraction of the total culture volume (e.g., ~20%) can help to ensure that the conditions within the PBR i.e., (mixing power, light distribution, etc.) do not drastically vary over the course of the experiment as the culture volume is removed.
 - Assuming a 10-day experiment where biomass; cell counts; and total chlorophyll, protein, lipid, carbohydrate, and nitrate concentrations are measured daily in triplicate, use a total sampling volume of ~600 mL. If aiming to remove no more than 18.75% of the total culture volume, use a total working reactor volume of at least 3.2 L.
- Select sensors and accessories for the PBR experiments.
- Select pH, light, and temperature probes to use for continuous monitoring. NOTE: Sensors should be compatible with the data acquisition unit and should withstand internal culture conditions (i.e., pH range, light, heat, algal debris, salt, etc.). Stainless steel and salt-tolerant probes were selected here since Dunaliella sp. are marine microalgae.
- Select an impeller design and motor to satisfy the experimental mixing requirements. NOTE: For example, a low-shear, axial impeller is a good choice for Dunaliella algae, as they lack a cell wall and can easily shear11. These algae have flagellar locomotion and do not need intense mixing11. Low mixing speeds can be attained using a 12 V mini-gear motor. The impeller and shaft can be 3D-printed (3D printing information can be found in the materials list).
- Assemble the PBR body and lid.
- Determine the dimensions of the reactor, based on the volume calculations in step 1.1, keeping in mind the experimental objectives and potential constraints (e.g., space). NOTE: A PBR design with a lower surface-to-volume ratio is preferred, as this shape minimizes light attenuation throughout the PBR, providing a more consistent light distribution throughout the experiment.
- Cut five pieces of optically clear cast acrylic sheets (~0.25-0.5 in thick) using a table saw, according to the PBR design and size established in step 1.3.1.
- Make sure that the joint edges are smoothed, but not rounded, using 200 to 400 grit sandpaper.
- Secure the edges of the acrylic pieces together with tape and/or clamps. NOTE: Acrylic cement is not a glue. If the acrylic bonding surfaces are rough or the acrylic pieces are not evenly aligned, this bonding cement will not be effective.
- In a well-ventilated area, apply acrylic cement along the joints using a needle dispenser. The plastic surfaces will immediately adhere together. Allow the pieces to sit for 24 h. WARNING: A mask and gloves should be worn to avoid inhalation and skin exposure when using acrylic cement.
- Apply viscous acrylic cement to the joints to ensure that the PBR is watertight. Leave the cement to dry for 24-48 h, according to the cement instructions; drying times may vary.
- Fill the reactor with water to check for visible leaks. If no leaks are apparent, place the reactor on paper towels and recheck for signs of leakage after 24-36 h. NOTE: Acrylic sheets no less than ~0.5 in thick should be used to assemble PBRs holding more than ~2 L; thinner sheets may bow under water pressure and cause leaks. Gaskets and re-enforcing screws can be used as a more robust alternative to acrylic cement ( Figure 1). This type of assembly requires precision machinery and must be done extremely carefully, as acrylic can easily crack.
- Use a machine shop to design the PBR lid, with ports to accommodate sensors and other PBR accessories and needs (i.e., impeller, gas lines, sampling ports, etc.). Make sure that the internal components do not interfere with each other. NOTE: The PBR and PBR lid configuration/design will depend upon reactor accessories and experimental objectives. See Figure 1 for an example of a PBR reactor and lid design (further details can be found in the materials section). This PBR design will be referenced for the remainder of the protocol.
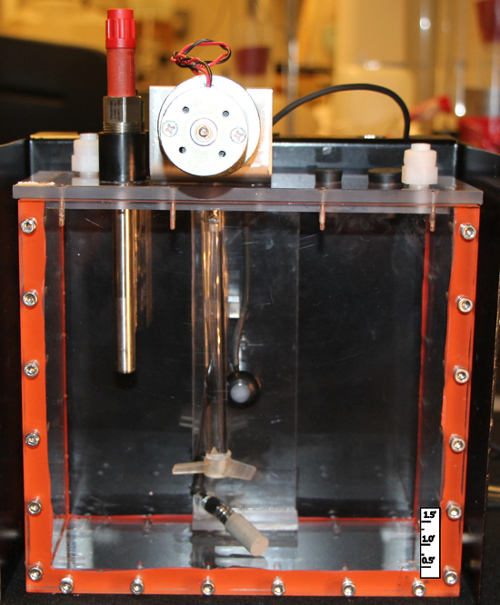
Figure 1: Image of the Customized Bench-scale PBR Setup with Sensors and a Mixer. This setup shows a mixer, an electrode secured to the lid through a threaded port in the lid, and a light sensor attached to a specially designed lid. This lid design also includes the attachment of a 12 V DC mini-gear motor. Please click here to view a larger version of this figure.
2. Set up and Configure Sensors with the Data Acquisition and Control Unit
NOTE: Sensors translate changes in the physical world into a measurable analog signal, often voltage. Data acquisition units serve as an interface between the digital and physical world and can be used to read these analog signals and convert them into discrete values, as instructed by a computer. The data-acquiring unit described herein has an analog input resolution of 16 bits, can read up to 14 analog signals (±10 V), and can supply the power required by some sensors (up to 5 V). These instructions provide an overview on how to set up this data acquisition and control unit to convert an analog signal into more meaningful values for light, pH, and temperature within a PBR. These instructions do not detail important concepts (i.e., quantization, precision, response time, etc.) needed to fully interpret these measured values and to quantify uncertainty.
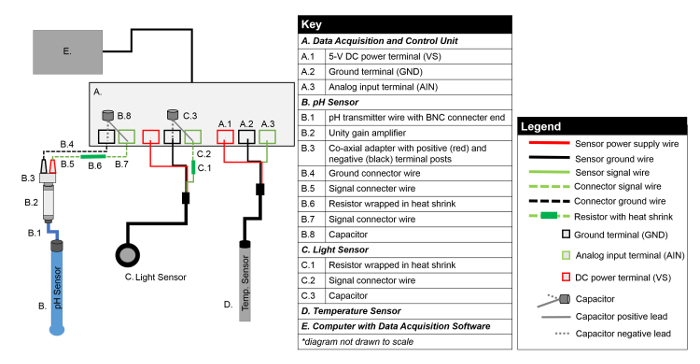
Figure 2: Sensor-to-data Acquisition and Control Unit Connection Diagram. This diagram shows how to set up pH, light, and temperature sensors to the data acquisition and control unit used for this protocol. Signal processing components for the pH and light sensor are shown. Please click here to view a larger version of this figure.
- Set up and configure the light sensor with the data acquisition and control unit using a low-pass filter. NOTE: Please refer to Figure 2 for general reference diagrams. Manufacturer sensor specifications indicate the difference between the signal, power, and ground wires based on color. A low pass-filter is a simple circuit that uses a resistor and capacitor to filter out unwanted noise from electrical signals. This type of filter attenuates electrical signals with frequencies higher than the cutoff frequency as determined by the resistance and capacitance. This filter helps to remove or smooth electrical noise from the sensor signal.
- Using wire strippers, cut a ~2 inch piece of green connector wire; strip 0.25 in of insulation off one end and ~0.5 in from the other end of both pieces.
- Identify the analog signal output wire on the light sensor. Ensure that at least ~0.25-0.50 inches of metal wire are exposed past the wire insulation.
- Carefully wrap one leg of the 1,000 Ω resistor around the ~0.5 inch stripped end of the connector wire. Wrap the other leg of the resistor around the exposed section of the light sensor analog signal wire.
- Use a soldering iron and lead-free solder to solder the resistor legs to the wire. Allow the solder to cool for 2-5 min. WARNING: The solder and soldering irons get extremely hot and can be very dangerous if users are not properly trained. Instructional videos can be found online. Safety glasses and other precautions are extremely important. Wires should not be connected to a power supply or other devices during this process.
- Slip a ~1.5 inch piece of heat-shrink tubing over one end of the connector wire and slide the piece until it covers the soldered wire and resistor. Make sure that all metal pieces are fully covered.
- Heat-shrink using a heat gun. Make sure the tubing wraps tightly around resistor and wires; no bare wire should be exposed.
- Attach the ground wire of the light sensor to a free ground (GND) terminal on the data acquisition and control unit using a screwdriver.
- Secure the free end of the signal connector wire to a free analog input (AIN) terminal using a screwdriver.
- Secure the positive lead of the 1,000 µF capacitor (i.e., the longer leg) to the same AIN terminal as in step 2.1.8 and the negative lead (i.e., the shorter leg) to the same GND terminal as in step 2.1.7. Make sure that both the capacitor leg and the wire are firmly connected to the terminal.
- Identify the power input wire for the light sensor and secure this wire to a voltage supply (VS) terminal on the data acquisition and control unit.
- Set up and configure the pH electrode with the data acquisition unit using a unity-gain amplifier and a low-pass filter. NOTE: Due to the nature of pH measurements (i.e., high impedance and low voltage), a unity-gain amplifying buffer is often required between the pH probe and the data acquiring device. A low-pass filter is also beneficial for measuring pH, to protect the signal from ambient electrical noise.
- Connect the unity-gain amplifier to the pH probe using the transmitter wire.
- Connect the co-axial adapter, with positive and negative port terminals, to the other end of the unity-gain amplifier.
- Cut two 6-in pieces of green and one ~12 inch piece of black connector wire using wire strippers. Strip ~0.25 inch of insulation off both ends of the black connector wire.
- Strip ~0.25 inch and ~0.5 inch of insulation off the ends of the green connector wires using wire strippers.
- Carefully wrap one leg of the 1,000 Ω resistor around the ~0.5 inch stripped section of one green connector wire. Wrap the other resistor leg around the ~0.5 inch stripped section of the other green connector wire.
- Use a soldering iron and lead-free solder to solder the resistor legs to the wire. Allow the solder to cool for 2-5 min.
- Slip a ~1.5 inch piece of heat-shrink tubing over one end of the connector wire and slide the piece until it covers the soldered wire and resistor. Make sure that all metal pieces are fully covered.
- Heat-shrink using a heat gun. Make sure that the plastic wraps tightly around the resistor and wires; no bare wire should be exposed.
- Secure one end of the black connector wire to the negative (black) terminal post on the co-axial adapter. Insert the other end of this wire into a GND terminal of the data acquisition and control unit and secure using a screwdriver.
- Secure one end of the green connector wire (with the resistor in series) to the positive (red) terminal post on the co-axial adapter. Insert the other end of this connector wire into a free AIN terminal on the data acquisition and control unit.
- Identify the positive lead of the 1,000 µF capacitor (i.e., the longer leg) and secure this lead to the same AIN terminal as in step 2.2.9; make sure both the capacitor leg and the signal wire are firmly connected to the terminal.
- Secure the negative lead of the 1,000 µF capacitor (i.e., the shorter leg) to the same GND terminal as in step 2.2.8.
Connect the temperature sensor to the data acquisition and control unit by connecting the signal, ground, and power wires of the probe to free AIN, GND, and VS terminals.
3. Set up the Live Data Acquisition and Experimental File
NOTE: The data acquisition and control software described here communicate with the data acquisition and control unit to monitor and log sensor data at user-specified time intervals. The instructions below explain how to set up a control file in this software to monitor and record pH, temperature, and light. These instructions are specific to the software and data acquisition and control unit listed in the materials section. Further instructions can be found in product user manuals.
Connect the data acquisition and control unit to a computer near the experimental setup using a USB cable and download all required drivers.
Download and open the data acquisition and control software.
- Set up 'Conversions' for each sensor in the software. NOTE: To convert the physical voltage signal into a meaningful value, some conversion factor, established by calibration, must be applied. Many sensors come with factory calibration factors found within product-specific specification sheets. Conversion equations are specific to the setup and the sensors. Many conversion equation parameters, especially those for electrodes, must be updated regularly via calibration. The lifetime of a sensor and calibration frequency will depend upon product-specific specifications and the working environment. NOTE: Users should read and understand these specifications in full. Table 1 shows conversions for sensors found in the materials list. An example conversion for the temperature probe is shown below.
- Navigate to "Conversions" in the software workspace, on the right side of the main homepage.
- Add a conversion name, such as, "volts_to_celsius" and type in the conversion equation: (55.56 x value) + 255.37 - 273.15.
| Channel Name | Conversion Name | Equation | Notes |
| Temperature | volts_to_celsius | (55.56 x value) + 255.37 - 273.15 | Manufacturer conversion equation to convert volts to celsius. |
| Light | volts_to_PPFD | value x 500 | Manufacturer conversion factor to convert volts to photosynthetic photon flux density (µmol m-2s-1), manufacturer LED-correction not applied. |
| pH | volts_to_pH | (-17.05 x value) + 6.93 | Calibration-dependent conversion equation (Figure 4b) to convert pH electrode voltage readings into pH values. Only apply conversion to pH channel after calibration. |
Table 1: Channel Conversion Table for the Data Acquisition File. Examples of how to input channel and conversion information for the sensors into the data acquisition software.
- Set up appropriate Channels for each sensor within the software to acquire sensor data. NOTE: Each sensor needs its own analog-to-digital channel in the software and a designated analog input terminal within the data acquisition and control unit.
- Navigate to the "Channel" page within the software.
- Add a sensor channel name. No space characters are allowed.
- Select the appropriate device to collect data for the corresponding channel; this device will correspond to the data-acquiring device.
- Input the device number used to reference the data acquisition and control unit or other data-acquiring device; if only one unit is being used, the default number is often zero.
- Select analog-to-digital, “A to D,” for the input-output type (“I/O Type”) and input the channel number that corresponds to the AIN terminal number on the data acquisition and control unit
- Input the desired sampling “Timing” (s); this value indicates how often the sensor signal will be read. Input 1.0 to acquire a reading every 1 s. To average data over 1-min intervals prior to logging, check the “Avg” box and specify 60 for the averaging length.
- Select the appropriate conversion from the dropdown menu, if applicable (see step 3.3 to generate conversions); otherwise, all channel data will be displayed/recorded as a voltage.
- Set up the "Logging Set" to log the experimental data.
- Navigate to the “Logging Panel” within the software workspace, add a new logging set, and name the set accordingly. Select the output file type and location; the ASCII file type will provide a comma-separated value file if the extension ‘.csv’ is specified in output file name.
- Add all desired channels to log to this set.
- Start and stop logging as desired by right-clicking on the logging sequence in the workspace and selecting the appropriate option. NOTE: Do not attempt to access the file when actively logging data. This action can disrupt the logging process. The file location for continuously logged files should not be saved/written within a cloud directory.
- Set up the "Page" to display the data and graphs.
- Navigate to the "Pages" display within the software workspace. Click on one of the default blank pages.
- To display a sensor output reading numerically on page, add a "Variable Value" display to the page.
- Right-click anywhere within blank page, select "Displays," and click the "Variable Value" option; a small box will appear on the screen.
- Right-click on this newly-created box and select "Properties." Type in the display caption (e.g., "Temperature in Reactor"), the channel reference (e.g., "Temperature[0]"), and the associated units (e.g., "Celsius"). Click "OK" and return to the display page.
- To display the sensor data graphically and in real time, add a 2D graph to the display page.
- Right-click anywhere within blank page and select "Graphs" and then "2-D graphs;" a small plot will appear on the screen.
- Right-click the newly-created graph and select "Properties." Within the "Traces" tab, type in the desired sensor channel name (e.g., "Temperature") in the box for "Y Expression:" and make sure that "Time" is written in the box for "X Expression:." Click "OK" and return to the display page.
4. Calibrate the pH Probe
NOTE: pH calibration should be done before every experiment, at the intended temperature of experiment, and the pH channel conversions should be updated accordingly. pH electrode readings can drift during experiments; to determine the extent of this drift, repeat the calibration process after running the experimental setup and compare the readings. pH electrodes should be properly stored in the appropriate storage solution before and after experimentation, as directed by the manufacturer.
Connect the pH and temperature sensors, as described in step 2.
Insert both the pH electrode and the temperature probe into pH calibration buffer 7.
Check the graphical display to ensure the temperature reading of the probe is at the desired temperature for running experiments (step 3.6.2.2).
Allow the pH electrode voltage output to stabilize (i.e., the voltage readings no longer change in one direction). Use a graphical display to confirm stabilization.
Log both the temperature and pH electrical data to a file (step 3.5) for 30-60 s. During this process, the pH channel should not have any conversions applied or include any averaging. Note: Since pH electrodes are sensitive to electrical noise, a lower acquisition timing (i.e. faster sampling) for the pH channel might be preferable (e.g. ‘Timing’ = 0.1 s). Keep in mind, a lower timing will require more computational resources.
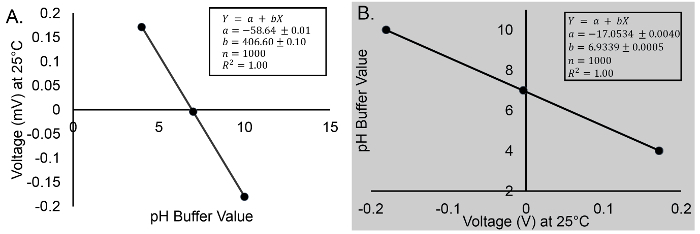
Repeat the calibration for buffers 4 and 10. Confirm that the response of the sensor is between -57 and -59 mV/pH (Figure 3a).
Generate a conversion equation by plotting the pH buffer value versus voltage and fitting a line (Figure 3b). Update the conversion equation as described in step 3.3 .
Apply this conversion to the pH channel and update channel settings to include averaging as desired for logging.
5. Set up the PBR for the Algal Experiment
NOTE: The steps below are specific to Dunaliella and the custom-made PBR shown in Figure 1. Moreover, these setup instructions are not in accordance with sterile protocols, as this system was not designed in such a way.
Prepare the algae inoculum and growth medium, as needed for the experiment and experimental objectives.
Connect the pH and temperature wires to the data acquisition and control unit, as described in steps 2.2-2.3.
Calibrate and update the conversion equation for the pH channel, as described in steps 3.3 and 4.
Figure 4: Wiring Diagram for the Mixer. This diagram shows how to set up a mixing device for a PBR using a mini-gear motor, a power supply, and a 3D-printed impeller and shaft. Please click here to view a larger version of this figure.
- Set up the PBR inside a temperature-controlled incubator with accessories and sensors. Refer to Figure 4 for visualization.
- Set up the light sensor within the PBR by threading the light sensor wire through the lid port and then mounting the sensor head onto the lid extension mount using the provided screw. Use a rubber stopper or grommet to keep this port closed to the atmosphere.
- Attach and secure the mixer impeller onto the PBR lid by placing the impeller shaft over the DC mini-gear motor shaft inside the PBR lid; secure the shaft with a set screw and an Allen wrench.
- Add algae-specific growth medium, place the lid, and secure the lid with screws. Place the PBR inside the incubator (set at 25 °C or the desired temperature).
- Insert the temperature probe into its designated port and secure it into the port using a rubber stopper.
- Secure the pH probe into the reactor lid port using a PG-13.5 threaded mount.
- Connect the light sensor wires to the data acquisition unit , as described in step 2.1.
- Power the mixer impeller to the desired speed.
- Set up the variable DC power supply adjacent to the setup. Turn on the power supply and adjust the voltage knob until the voltage value reads 0 volts. Turn off the power supply.
- Connect the impeller motor power lines to the positive and negative output terminals of the variable power supply (Figure 5). WARNING: Never connect or touch live wires or circuits. Make sure that all power supplies are turned off before connecting any wires. Always read manufacturer instructions/specifications to ensure compatibility between the motor, power supply, and wires.
- Turn on the power supply and slowly increase the voltage by turning the voltage knob until the desired mixing speed is reached; calculate the mixing speed by measuring the rotations per min.
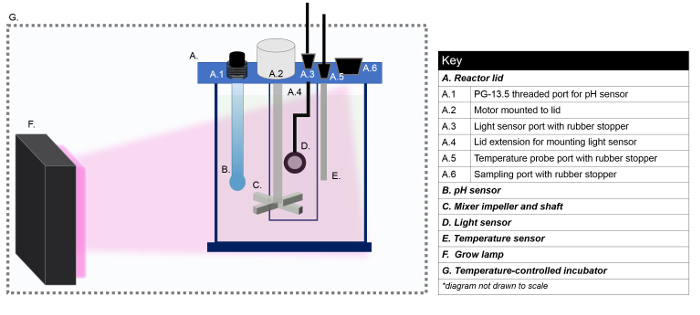
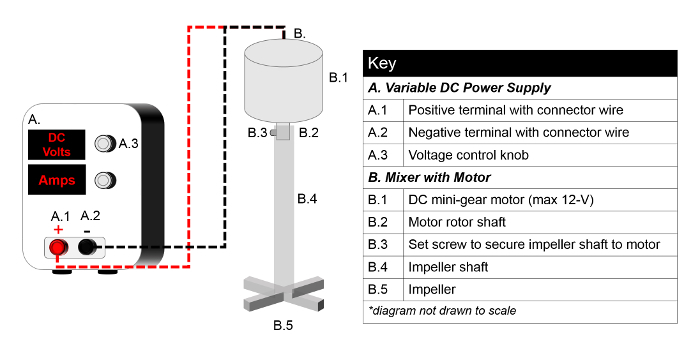
Figure 5: Reactor Experimental Setup Diagram. Visualization of a PBR experimental setup within a temperature-controlled incubator. This setup includes a grow lamp and a PBR, with sensors and a mixer secured within the PBR lid. Please click here to view a larger version of this figure.
- Set up the grow lamp to illuminate the PBR. NOTE: A high-powered, LED grow lamp that emits in the blue and red spectrum was chosen to achieve the photosynthetic light intensity levels required for this Dunaliella-specific research. The size and shape of the light fixture should be selected such that the light evenly illuminates the incident surface of the PBR. Verify that the incubator can handle an internal heat source. Not doing so could shorten the incubator lifetime and/or could cause damage or excessive heating within the incubator.
- Center the grow lamp along the front face of the PBR. Make sure that the light path is directly oriented towards the light sensor mounted on the back of the reactor.
- Turn on the light and adjust the light intensity as needed by moving the grow lamp directly toward or away from the reactor. Check the sensor variable display for light readings.
Monitor and log the sensor data for 6 - 24 h to ensure that the light, temperature, and pH readings within the PBR are stable and within the desired range. Adjust as needed. NOTE: Electrical noise can often be observed by bouncing, unsteady readings, and/or abrupt shifts in values, without apparent changes in the PBR environment.
Remove the rubber stopper on the sampling port to add algae inoculum via transfer pipette.
- Remove the samples and monitor the conditions to ensure that they stay within the range desired for the experiment.
- Remove the cultures for analysis as needed from the sampling port using a pipette. NOTE: The sample volume, frequency, and duration of experiment will depend upon step 1.1.2.
- Monitor the water temperature within the PBR by checking the data display in the software and manually adjusting the incubator air temperature set point to keep the water temperature constant. NOTE: This adjustment will depend upon the incubator manufacturer instructions.
- Monitor and adjust the pH within the PBR, as desired, to ensure that the pH stays within the expected range for the experiments. NOTE: Here, the pH was controlled with a 12 V solenoid valve (normally-closed) in line with a compressed CO2 tank (99.99%). The valve was opened as required using the control functionality of the data acquisition and control unit and software. This setup required an accessory relay board and DC modules and was implemented using custom computer programming tailored to specific research goals.
Representative Results
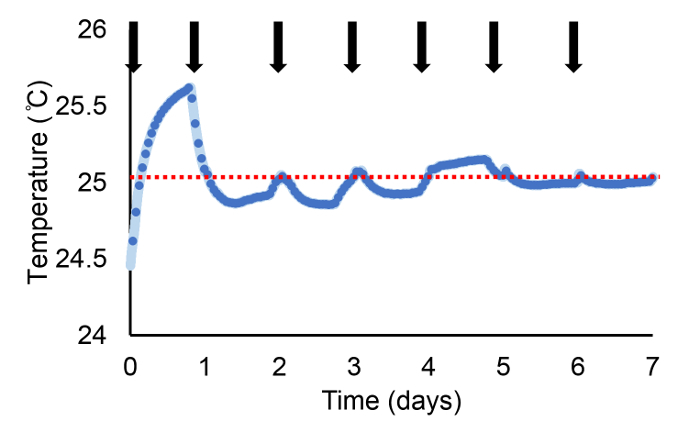
Data from this real-time monitoring system show the dynamic culturing environment for algae within a bench-scale PBR and highlight the need for monitoring and controlling the system. The logged temperature data (Figure 6) demonstrates how light illumination, incubator air temperature, and energy dissipation associated with algal growth can change the temperature within the PBR and how the real-time data can be used to adjust incubator temperature controls, as needed.
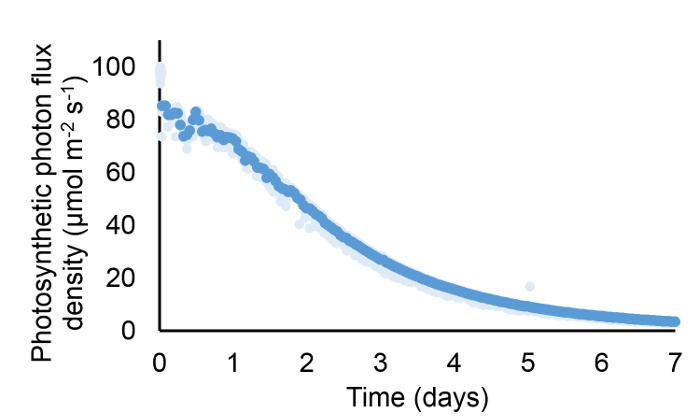
The measured light over the course of the experiment further emphasizes the dynamic nature of this growing environment. As observed in Figure 7, the light sensor reading, measured as photosynthetic photon flux density (PPFD; µE-m−2s−1), was ~100 PPFD before algae was added and dropped immediately to 85 PPFD after inoculating the reactor with the algal culture. The light continued to drop to less than 5 PPFD on day 7. This decrease in light intensity is due to increasing biomass and cell counts, and/or to increasing absorption by increased chlorophyll content, showing that algae are active through day 7, despite low light levels. Additional biological measurements are required to make further inferences.
The continuously logged pH data show that, overall, the pH was adequately controlled during this experiment with the implemented pH control algorithm (Figure 8). This data, showing both minute-by-minute readings and hour-long averages, demonstrate a few key points about culturing algae and monitoring pH in real time. First, the pH increased above the desired set point of 7.6 immediately after inoculating the PBR with algae. This change was expected, as the culture seed that was added to the PBR had a pH value higher than the set point, since the flask used to grow the inoculum was not pH-controlled. Secondly, this live data highlights how sensitive pH electrodes are to external electrical noise. This sensitivity is noted by a drastic jump in the electrode values between day 1 and day 2. These sudden changes in pH values were likely created by electrical noise from a solenoid valve from an adjacent experimental setup. This electrical disturbance prematurely triggered the pH control algorithm to inject CO2 into the PBR. Consequently, the pH dropped below the desired set point. The sensitivity of the pH electrodes can lead to extreme outliers and can potentially disrupt control systems.
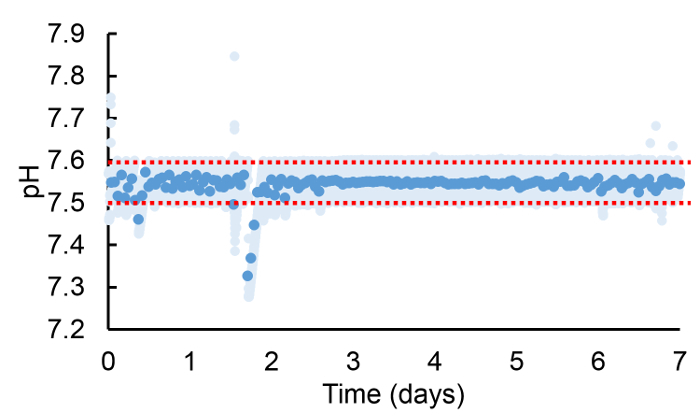
Figure 3: pH Response and Calibration Example Graphs. (a) Example response graph of the pH sensor (b) Example calibration graph of the pH sensor, with an equation to use for the conversion. Regression analysis shows a 95% confidence interval. Error bars are not visible (standard error less than 0.03%). These graphs show that the pH sensors was connected properly and that its signal was very steady. Please click here to view a larger version of this figure.
Figure 6: Temperature Measurements Within the PBR During a 7 day Experiment. Dark blue points represent 1-h averages of sensor data, and light blue points represent sensor readings acquired over 1 min (acquisition timing of 1 s, average length of 60) and converted to temperature using manufacturer-supplied conversion factors. Black arrows show when the incubator temperature setting was adjusted to maintain the culture temperature around 25 °C (this desired set point is designated with a red, dotted line). Fluctuations in temperature are due to algal growth and changes in incubator temperature. Please click here to view a larger version of this figure.
Figure 7: Light Measurements Within the PBR During a 7 day Experiment. Dark blue points represent 1 h averages of sensor data, and light blue points represent sensor readings acquired over 1 min (acquisition timing of 1 s, average length of 60) and converted into PPFD using default light-sensor factory calibration values. Please click here to view a larger version of this figure.
Figure 8: pH Measurements Within the PBR During a 7 day Experiment. Dark blue points represent 1-h averages of sensor data, and light blue points represent sensor readings logged every 1 min (acquisition timing of 0.1 s, average length of 600) and converted into pH using conversion equation established via calibration. The pH was maintained between 7.6 and 7.5 using a 99% CO2 gas injection. The red, dotted lines indicate the desired pH range. Please click here to view a larger version of this figure.
Discussion
This PBR system offers the ability to monitor and control bench-scale algal kinetic growth experiments, allowing for more repeatable results from experimental assays used to quantify growth. However, an understanding of the limitations and uncertainties of sensor measurements is critical to ensure that the sensor readings accurately reflect reactor conditions. This understanding includes basic knowledge of the measurement principles involved with sensors, the process and frequency of calibration, the measurement uncertainty, and what the sensor can and cannot measure. For example, the electrical response for the light sensor described here is not equally distributed across the visible spectrum range, and certain correction factors may need to be applied to the sensor output, depending upon how this sensor data will be analyzed.
Temperature levels and variations are also extremely important, as changes in temperature can drastically influence the sensor response. Understanding potential interferences that can impact the sensor readings is also critically important; this interference can be ambient electrical noise from the building or could stem from the measurement environment (e.g., sodium ions can drastically impact pH readings at pH values over 10)12. Moreover, submerging multiple probes into a solution, especially a highly ionic and conductive salt solution, is also a potential source of interference. Electrodes that measure pH (or ionic strength, dissolved oxygen, dissolved CO2, etc.) are especially sensitive to ambient electrical noise and can be easily perturbed. Signal conditioning used for protecting the electrode signal cannot guarantee that other factors will not interfere with the probe readings. As part of quality control, other laboratory equipment, such as a hand-held pH probe, a hand-held spectrometer, and a thermometer, should be used to verify the sensor readings and to ensure that the system is set up and running properly.
Another limitation that must be addressed is the possible impact of the algae and/or culturing environment on the sensors. For example, if algal debris or bubbles cover the photodiode receptor of the light sensor, the readings will be affected. Similarly, pH electrodes are extremely sensitive and require extra care to ensure accurate readings. These electrodes work by measuring a voltage difference across an internal junction due to the buildup of H+ ions; a hydrated buffer layer within the probe is required to maintain accurate measurements12. Depending upon the conditions within the reactor, this layer will wear off, and the response of the sensor may change over the course of the experiment while the probe is submerged. In preliminary tests, the pH voltage output did not drift by more than ~0.2 pH units over the course of a 20-day experiment, but further assessments should be performed to characterize this change in sensor response and to establish maximum experimental run times, especially if fine pH adjustments/quantifications are needed.
Many current bench-scale PBR systems built to analyze algal growth do not monitor and control the internal culture environment as tightly as needed to discern how different factors impact algal growth, since setting up systems in this way can be challenging. This protocol can help facilitate more controlled experiments by giving step-by-step instructions for constructing a PBR with real-time monitoring. Moreover, this live data can be used not only to better control experimental conditions, but it can potentially be utilized to estimate growth kinetics (e.g., optical density readings as reference for general growth rates).
Controlled experimental systems can help to make algal research more reproducible. Bench-scale PBR setups that are monitored and controlled can increase experimental efficiency by minimizing unintended artifacts in experimental design and can help to advance efforts to make algal biofuels a sustainable, alternative fuel source.
Disclosures
The authors have nothing to disclose.
Acknowledgments
The authors acknowledge the National Science Foundation Emerging Frontiers in Research and Innovation (Award #1332341) for funding this research. The authors would also like to acknowledge Dr. Andrew Grieshop, as well as the LabJack and DAQFactory online support communities for their assistance and help offered throughout this process.
References
- EPA Office of Transportation and Air Quality. Renewable Fuel Standard Program. 2013. Available from: http://www.epa.gov/OTAQ/fuels/renewablefuels/
- Liu X, Clarens AF, Colosi LM. Algae biodiesel has potential despite inconclusive results to date. Bioresour. Technol. 2012;104:803–806. doi: 10.1016/j.biortech.2011.10.077. [DOI] [PubMed] [Google Scholar]
- Chisti Y. Biodiesel from microalgae. Biotechnol. Adv. 2007;25(3):294–306. doi: 10.1016/j.biotechadv.2007.02.001. [DOI] [PubMed] [Google Scholar]
- Lardon L, Hélias A, Sialve B, Steyer J-P, Bernard O. Life-cycle assessment of biodiesel production from microalgae. Environ. Sci. Technol. 2009;43(17):6475–6481. doi: 10.1021/es900705j. [DOI] [PubMed] [Google Scholar]
- Henry W. Experiments on the Quantity of Gases Absorbed by Water, at Different Temperatures, and under Different Pressures. Philos. Trans. R. Soc. London. 1803;93(1803):29. [Google Scholar]
- Wang X, Hao C, Zhang F, Feng C, Yang Y. Inhibition of the growth of two blue-green algae species (Microsystis aruginosa and Anabaena spiroides) by acidification treatments using carbon dioxide. Bioresour. Technol. 2011;102(10):5742–5748. doi: 10.1016/j.biortech.2011.03.015. [DOI] [PubMed] [Google Scholar]
- Juneja A, Ceballos RM, Murthy GS. Effects of Environmental Factors and Nutrient Availability on the Biochemical Composition of Algae for Biofuels Production: A Review. Energies. 2013;6(9):4607–4638. [Google Scholar]
- Bernard O. Hurdles and challenges for modelling and control of microalgae for CO 2 mitigation and biofuel production. J. Process Control. 2011;21(10):1378–1389. [Google Scholar]
- Guest JS, van Loosdrecht MCM, Skerlos SJ, Love NG. Lumped Pathway Metabolic Model of Organic Carbon Accumulation and Mobilization by the Alga Chlamydomonas reinhardtii. Environ. Sci. Technol. 2013;47(7):3258–3267. doi: 10.1021/es304980y. [DOI] [PubMed] [Google Scholar]
- Packer A, Li Y, Andersen T, Hu Q, Kuang Y, Sommerfeld M. Growth and neutral lipid synthesis in green microalgae: A mathematical model. Bioresour. Technol. 2011;102(1):111–117. doi: 10.1016/j.biortech.2010.06.029. [DOI] [PubMed] [Google Scholar]
- Oren A. A hundred years of Dunaliella research: 1905-2005. Saline Systems. 2005;1:2. doi: 10.1186/1746-1448-1-2. [DOI] [PMC free article] [PubMed] [Google Scholar]
- Hach Company. What is pH and How is it Measured? 2010. Available from: http://www.hach.com/asset-get.download.jsa?id=7639984488.


