

Abstract
Background
The onset of multiple sclerosis (MS) during childhood or adolescence is increasingly recognized in the United States. Administrative databases quantify healthcare utilization as measured by hospital admissions, providing insight into the impact of MS in the pediatric population.
Objective
We examine the frequency of hospital admissions for pediatric MS in the US using the Pediatric Health Information System (PHIS) database.
Methods
Data was extracted from the PHIS database using the ICD-9 code for MS (340.00) and reviewed to verify case ascertainment. Mean, median, and range values were determined for the number of inpatient hospitalizations per patient, number of days in the hospital, and cost of each encounter. A trend analysis was performed to evaluate the annual frequency of MS-related admissions over the study period.
Results
After case verification, the PHIS database extraction reported 2068 hospital inpatient encounters for 1422 unique pediatric MS patients between 2004 and 2013. The median number of hospitalizations per patient was 2 with a median hospital stay of 4 days. Admission rates for MS increased from 2.37 per 10,000 in 2004 to 4.13 per 10,000 in 2013.
Conclusion
The number of admissions due to pediatric MS has increased since the start of the PHIS database collection, concurrent with increased disease awareness and the establishment of dedicated pediatric MS centers.
Keywords: Multiple sclerosis, Pediatric, Pediatric Health Information System, Hospital admissions
1. Introduction
Multiple sclerosis (MS) is a common neurological disease in adults, with an estimated prevalence of 90 per 100,000 people in the United States (National Multiple Sclerosis Society, 2016). Pediatric-onset MS occurs far less frequently, although creation of international guidelines for MS diagnosis in children, (Krupp et al., 2007, 2013; Polman et al., 2011) increased access to MRI and identification of MRI features of MS in pediatric patients, (Verhey et al., 2011) and the establishment of formal pediatric MS clinics in the U.S. have led to increasingly frequent identification of MS in children and adolescents.
Pediatric MS is characterized by a relapsing-remitting disease course. Common relapse features include vision loss, sensory disturbances, weakness, balance difficulty, and gait impairment. These symptoms may result in an inpatient evaluation for diagnostic studies or hospitalization for intravenous (IV) corticosteroids or other therapy. While a survey of pediatric MS experts in the United States confirms that 97% of children with MS relapses are treated first-line with IV corticosteroids, these physicians also confirm that the decision to admit a child for IV corticosteroids is dependent upon multiple factors, such as relapse severity, timing of examination relative to the onset of relapse symptoms, and MRI findings indicative of disease activity (Waldman et al., 2011).
Administrative databases quantify healthcare utilization and estimate the hospital-based burden of disease through quantification of admissions. The Pediatric Health Information System (PHIS) is an administrative database that contains inpatient, emergency department, ambulatory surgery, and observation encounter-level data from over 44 not-for-profit, tertiary care pediatric hospitals in the U.S. Several studies have used the PHIS database to determine hospitalization rates, cost burden to families, and further explore the impact of rare pediatric disorders across the U.S. (Wilson et al., 2015; Bourgeois et al., 2014; Akhavan et al., 2014; Olson et al., 2015).
We examined PHIS database-reported hospital admission rates and cost-burden for pediatric MS, and extrapolated the data to yield estimates of pediatric MS admissions and cost in the U.S. Using our institutional database to confirm the assumption that most pediatric MS patients are hospitalized at least once during their disease course, we then further extrapolated the national hospital admission rates to calculate disease prevalence estimates for pediatric MS in the U.S.
2. Methods
Data was extracted from the PHIS database for the years 2004 through the first 2 quarters of 2014 using the ICD-9 code for multiple sclerosis (ICD-9-340.00). The PHIS hospitals are affiliates of the Children’s Hospital Association (Overland Park, KS). Data quality and reliability are assured through a joint effort between the Children’s Hospital Association and participating hospitals. Portions of the data submission and data quality processes for the PHIS database are managed by Truven Health Analytics (Ann Arbor, MI). Data are de-identified at the time of data submission, and are subjected to a number of reliability and validity checks before being included in the database. Sites receive alerts if reviewed data is incomplete or appears to be of poor quality.
For each PHIS entry with an ICD-9 code of 340.00, the following information was abstracted: demographics (sex, age, race/ethnicity), admitting diagnosis, procedure codes (including MRI and spinal tap), discharge diagnosis, payor source, and total cost of the admission. Only patients under the age of 19 years were included in the data abstraction. Case verification was determined by reviewing the admitting diagnosis, procedure codes, and discharge diagnosis for consistency with an MS indication. We excluded patients with codes for other demyelinating diseases such as acute disseminated encephalomyelitis or neuromyelitis optica and whose admission was for a cause other than an MS exacerbation (i.e. chronic tonsillitis). Records were sorted by discharge ID (a unique identifier) to determine discrete patients and the number of admissions per patient. For each admission, total cost reported in the PHIS database is adjusted for the Healthcare Finance Administration’s Center of Medicare and Medicaid Services wage/price index for the hospital location to help account for regional differences in payor mix and fee schedules. The total cost includes charges from inpatient stay, laboratory assessments, and imaging.
Mean, median, and range values were determined for the number of hospital inpatient admissions, number of days in the hospital, and cost of each encounter. Since encounters were only available for half of 2014, the trend analysis only included information from 2004 to 2013. Admission rates for MS were determined using the total amount of admissions reported within the PHIS system for the years 2004–2013 collectively and within each institution. A Mantel-Haensel analysis for trend was performed to compare yearly admission rates. All data analysis was performed using Stata 12.0 (College Station, TX).
The number of unique MS patients with inpatient hospitalizations was extrapolated to the U.S. population using census-level data provided by the CDC Wonder Surveillance Program (Center for Disease Control, 2015). These estimates rest on the assumption that each MS patient was admitted for inpatient care at least once during their disease course. To confirm this assumption, we evaluated hospitalization rates of patients treated at The Children’s Hospital of Philadelphia (CHOP) for MS. Medical records were reviewed from approximately the same time period as the PHIS database (2004–2013) to replicate a search based on coding data. Each patient chart was assessed to determine how many of the patients registered as outpatients in the Pediatric MS Center at CHOP, and living within the catchment area, were hospitalized at least once at CHOP during the same time period. This retrospective portion of the study was approved by the CHOP Institutional Review Board.
3. Results
Information from 44 of the free-standing pediatric hospitals in the PHIS database reported at least one MS patient admission as described in Table 1.
Table 1.
Institutions participating in PHIS and associations with multiple sclerosis clinics.
| Hospital name | Location of hospital | Start yeara | Total number of MS admissions | Percent of hospital total admissions | NMSS center of excellenceb | Active MS research programc |
|---|---|---|---|---|---|---|
| Akron Children’s Hospital | Akron, OH | 1992 | 19 | 0.01 | ||
| All Children’s Hospital Johns Hopkins Medicine | St. Petersburg, FL | 1992 | 28 | 0.01 | ||
| Ann & Robert H. Lurie Children’s Hospital | Chicago, IL | 1992 | 46 | 0.02 | x | |
| Arkansas Children’s Hospital | Little Rock, AR | 1992 | 40 | 0.02 | ||
| Boston Children’s Hospital | Boston, MA | 2000 | 71 | 0.03 | x | x |
| Children’s Healthcare of Atlanta | Atlanta, GA | 1992 | 79 | 0.04 | ||
| Children’s Hospital | New Orleans, LA | 1995 | 44 | 0.02 | ||
| Children’s Hospital of Orange County | Orange, CA | 1992 | 77 | 0.03 | ||
| Children’s Hospital of Wisconsin | Milwaukee, WI | 1995 | 21 | 0.01 | ||
| Children’s National Medical Center | Washington, DC | 1998 | 96 | 0.04 | x | |
| Children’s Hospital Los Angeles | Los Angeles, CA | 1998 | 73 | 0.03 | ||
| Children’s Hospital & Regional Medical Center | Dallas, TX | 1998 | 15 | 0.01 | x | |
| Children’s Hospital Central California | Madera, CA | 1992 | 51 | 0.02 | ||
| Children’s Hospital Colorado | Aurora, CO | 1992 | 50 | 0.02 | x | x |
| Children’s Hospital of Michigan | Detroit, MI | 1998 | 90 | 0.04 | ||
| Children’s Hospital of Pittsburgh of UPMC | Pittsburgh, PA | 1992 | 60 | 0.03 | ||
| Children’s Hospital of The King’s Daughter | Newport News, VA | 1992 | 23 | 0.01 | ||
| Children’s Hospitals and Clinics of Minnesota | Minneapolis, MN | 1998 | 10 | 0.01 | ||
| Dayton Children’s Hospital | Dayton, OH | 1992 | 163 | 0.07 | x | |
| Children’s Mercy Hospitals and Clinics | Kansas City, MO | 1992 | 31 | 0.01 | ||
| Children’s of Alabama | Birmingham, AL | 1995 | 29 | 0.01 | x | x |
| Cincinnati Children’s Hospital Medical | Cincinnati, OH | 1995 | 60 | 0.03 | ||
| Connecticut Children’s Medical Center | Hartford, CT | 2004 | 54 | 0.02 | ||
| Cook Children’s Health Care System | Fort Worth, TX | 1994 | 49 | 0.02 | ||
| Driscoll Children’s Hospital | Corpus Christi, TX | 1992 | 11 | 0.01 | ||
| East Tennessee Children’s Hospital | Knoxville, TN | 2007 | 13 | 0.01 | ||
| Le Bonheur Children’s Medical Center | Memphis, TN | 1992 | 63 | 0.03 | ||
| Lucile Packard Children’s Hospital at Stanford | Palo Alto, CA | 1998 | 8 | 0.004 | ||
| Miami Children’s Hospital | Miami, FL | 1992 | 35 | 0.02 | ||
| Monroe Carell Jr. Children’s Hospital at Vanderbilt | Nashville, TN | 2000 | 26 | 0.01 | ||
| Nationwide Children’s Hospital | Columbus, OH | 1992 | 43 | 0.02 | ||
| Children’s Hospital of New York Presbyterian | New York, NY | 2002 | 83 | 0.04 | ||
| Phoenix Children’s Hospital | Phoenix, AZ | 2005 | 45 | 0.02 | ||
| Primary Children’s Medical Center | Salt Lake City, UT | 2007 | 39 | 0.02 | x | |
| Rady Children’s Hospital San Diego | San Diego, CA | 1992 | 48 | 0.02 | ||
| Riley Hospital for Children at Indiana | Indianapolis, IN | 2004 | 35 | 0.02 | ||
| Seattle Children’s Hospital | Seattle, WA | 1998 | 42 | 0.02 | ||
| St. Louis Children’s Hospital | St. Louis, MO | 1995 | 55 | 0.02 | x | x |
| Texas Children’s Hospital | Houston, TX | 1996 | 149 | 0.07 | x | x |
| The Children’s Hospital of Philadelphia | Philadelphia, PA | 2000 | 177 | 0.08 | x | |
| UCSF Benioff Children’s Hospital Oakland | Oakland, CA | 2004 | 18 | 0.01 | x | |
| UH Rainbow Babies & Children’s Hospital | Cleveland, OH | 2014 | 2 | 0.001 | ||
| Women and Children’s Hospital of Buffalo | Buffalo, NY | 2009 | 34 | 0.01 | x | x |
| Yale-New Haven Children’s Hospital | New Haven, CT | 2009 | 8 | 0.004 |
Year the site began contributing to the PHIS database.
The following National Multiple Sclerosis Society (NMSS) Pediatric MS Centers of Excellence are not included in the PHIS database: Pediatric MS Center at Loma Linda Children’s Hospital, San Bernadino, CA; Partners Pediatric MS Center at Mass General Hospital, Boston, MA; Mayo Clinic Pediatric MS Center Rochester, MN; Lourie Center for Pediatric MS at Stony Brook University Stony Brook, NY; University of California San Francisco Regional Pediatric MS Center; Pediatric MS Center at the Jacobs Neurological Institute, Buffalo, NY; Mellen Center for Multiple Sclerosis, Cleveland Clinic, Cleveland, OH; Rocky Mountain MS Center, University of Colorado, Denver, CO.
These sites are actively engaged in collaborative MS research project or are considered NMSS collaborative centers affiliate sites.
Most of the hospitals contributed data prior to 2004 (86%) and 6 hospitals joined the PHIS network during the reporting period (2004–2014). The PHIS database extraction captured 1818 patients of whom 396 were excluded for having other diagnoses or non-MS related admissions. Of the 1422 remaining patients, 2068 hospital admissions for pediatric MS were reported between 2004 and the first quarter of 2014. Demographic information for all subjects is presented in Table 2.
Table 2.
PHIS patient demographic information.
| N=1422 | Frequency | |
|---|---|---|
| Age | ||
| <11 | 144 | 12.8% |
| 11–15 | 472 | 42.0% |
| 15< | 508 | 45.2% |
| Gender | ||
| Female | 754 | 67.1% |
| Male | 370 | 32.9% |
| Race | ||
| Black | 98 | 8.7% |
| White | 188 | 16.7% |
| Other | 25 | 2.2% |
| Missing | 813 | 72.3% |
| Ethnicity | ||
| Hispanic | 230 | 20.5% |
| Non-Hispanic | 561 | 49.9% |
| Unknown | 333 | 29.6% |
| Payor Type | ||
| Commercial | 328 | 29.2% |
| Medicaid | 332 | 29.5% |
| Medicare | 17 | 1.5% |
| Self-Pay/Charity | 21 | 1.9% |
| Other/Unknown | 426 | 37.9% |
Approximately 13% of the patients were under the age of 11 years and the remainder were split evenly among the 11–15 year old age group (42%) and 16–18 year age group (45%). The female to male ratio was 2:1, but differed by age as shown in Table 3. Race was only reported for 29% of patients, of which 60.5% were white and 32.5% were black. Payor information was accurately recorded for 62% of patients, half of whom reported paying for care through Medicaid, Medicare or other government insurance.
Table 3.
Distribution of MS patients by age and gender.
| Age | Female (%) | Male (%) | Total |
|---|---|---|---|
| <11 | 75 (52.1) | 69 (47.9) | 144 |
| 11–15 | 311 (65.9) | 161 (34.1) | 472 |
| >15 | 368 (72.4) | 140 (27.6) | 508 |
| Total | 754 (67.1) | 370 (32.9) | 1124 |
Hospital encounter information is presented in Table 4. Of the 1422 individual MS patients, the average number of admissions per patient was 6 (Median =4; Range 1–8). The median length of stay per admission was 4 days (Range 2–5). The median cost for an encounter was $24,672 (maximum cost = $323,1020.50).
Table 4.
Hospital encounter information.
| Average hospital admissions per patient (SD) | 5.99 (6.1) |
| Median Hospitalizations per patient [Range] | 4 |
| Average inpatient days per patient (SD) | 5.5 (7.8) |
| Median inpatient days per patient [range] | 4 |
| Average cost of encounter (SD) | $38,5430.59 ($54,9350.52) |
| Median cost of encounter [maximum] | $24,6720.23 [$323,1020.50] |
The annual rate of admissions for MS related events are presented in Fig. 1. Admission rates for MS increased from 3.47 per 10,000 in 2004 to 5.32 per 10,000 in 2013 (p<0.001).
Fig. 1.
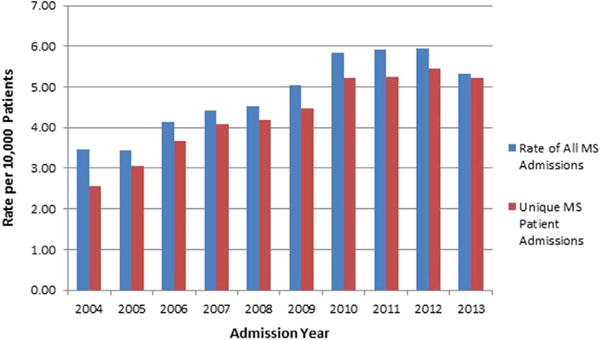
MS admission rate and patient rate per 10,000 patients in the PHIS database.
The number of MS cases per year was further stratified by age category to see if there was a change in age distribution over time (Fig. 2). The number of children under 11 years old hospitalized for an MS attack remained relatively stable; however, the number and proportion of cases 11–15 and over the age of 15 appeared to steadily increase through 2013.
Fig. 2.
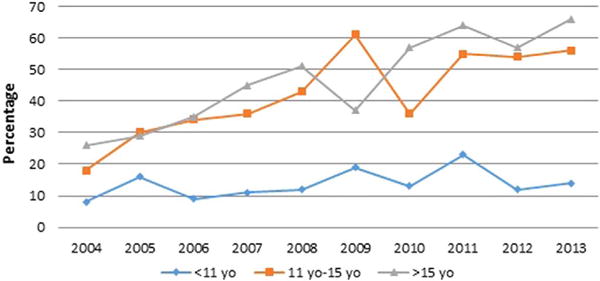
Number of MS cases per year by age category, 2004–2013.
Table 5 displays an estimation of prevalence for MS using admissions data from PHIS by age group and sex. Using U.S. Census data, we extrapolated the admissions data to the population of children within the U.S. The prevalence of Pediatric MS based on the number of patients presenting to PHIS hospitals was 0.04 per 100,000 children for those under the age of 10 and increased to 0.44 per 100,000 in children over 15 years old. Estimated prevalence rates were similar between sexes for patients 10 and under, but doubled for females in the 11 and older categories.
Table 5.
Estimated prevalence of pediatric MS based on the US census data.
| Number of MS patients admitted to hospitals by age group and gender between 2004–2013 | |||
|---|---|---|---|
| Age | Gender Female |
Male | Total |
| <11 | 75 | 69 | 144 |
| 11–15 | 311 | 161 | 472 |
| >5 | 368 | 140 | 508 |
| Total | 754 | 370 | 1124 |
| Total population estimated by the US census by age group and gender between 2004–2013 | |||
| Age | Gender Female |
Male | Total |
| <11 | 198,982,160 | 207,922,273 | 406,904,433 |
| 11–15 | 89,884,770 | 94,283,467 | 184,168,237 |
| >15 | 56,055,477 | 59,026,147 | 115,081,626 |
| Total | 344,922,409 | 361,231,887 | 706,154,296 |
| Estimated MS prevalence rate per 100,000 persons by age group and gender | |||
| Age | Gender Female |
Male | Total |
| <11 | 0.038 | 0.033 | 0.035 |
| 11–15 | 0.346 | 0.171 | 0.256 |
| >15 | 0.656 | 0.237 | 0.441 |
| Total | 0.219 | 0.102 | 0.159 |
A retrospective review of ICD-9 codes at CHOP identified 119 patients with pediatric MS. Of these patients, 87 (73%) were hospitalized between 2004 and 2013 at CHOP at least once during the course of their disease.
4. Discussion
The number of hospital admissions for pediatric MS has increased since 2004, concurrent with the establishment of dedicated pediatric MS centers and increased disease awareness. Prevalence of pediatric-onset MS is steadily increasing, notably only in patients over the age of 11 years. The increasing prevalence may reflect an increasing incidence, but may also reflect, in part, more accurate MS diagnoses in children. In 2004, at the start of our reference period, many physicians diagnosed children with a first attack of demyelination as acute disseminated encephalomyelitis, which has a different ICD-9 code and would have been missed by our search criteria. In 2007, consensus definitions for pediatric demyelinating diseases were published by the International Pediatric MS Study Group and have resulted in improved clinical phenotyping. More recently, the 2010 McDonald criteria for MS diagnosis formally include diagnosis of pediatric MS (Polman et al., 2011). The 2010 McDonald criteria also include the ability to diagnose MS based on a single clinical attack provided that key MRI features are present. Given that this now leads to confirmation of MS diagnosis much earlier in the disease, there is an increased chance that such confirmation will occur while the patient is still less than 19 years of age.
According to Weiss and Elixhauser (Weiss and Elixhauser, 2012), overall hospital admissions have decreased each year from 2003 to 2008 (−0.3% per year), with further decreases seen after 2008 (−1.9% each year). Despite this overall decrease in hospital admissions, we demonstrated that the rate of admissions due to pediatric MS has increased since 2004. This may reflect the increased recognition of pediatric MS and the expansion of pediatric MS centers across the US.
The demographic features of the MS patients captured using the PHIS database are representative of published pediatric MS cohorts. We confirm the rarity of MS onset prior to age 11 years, and the increasing rate of MS diagnosis in adolescents (Banwell et al., 2007; Yeh et al., 2009). We also confirm a striking female preponderance (2.6:1), which is notable selectively after age 11 years.
Following a systematic literature review, Kolasa et al. noted that the average annual cost for an adult MS patient in 2013 to be $41,000 (Kolasa, 2013). Even with limited information available in this dataset, we estimate a cost per pediatric MS admission to be $38,000. However, the hospital-based costs at the individual patient level may actually be higher in pediatric MS populations. Children generally have more relapses in the first 2 years of disease (Gorman et al., 2009) which may lead to more hospitalizations early in their disease course, and thus a higher cost burden per patient. The financial burden of MS includes far more than hospital-based expenses. The amount families pay for MS-related medications, which may cost several hundred dollars a month even if insurance covers part of the cost. The cost of missed work for parents, and the costs that may occur if parental vocational choices are altered by the need to have greater flexibility to care for their children with MS, are unknown. The lifetime cost of pediatric-onset MS will clearly exceed that of adult-onset MS patients.
We extrapolated the PHIS data to the pediatric MS prevalence in the U.S, and estimated the prevalence of pediatric MS to be 0.159 per 100,000 children per year. In comparison, Langer-Gould et al. used a single-payor health system database in Southern California to estimate standardized incidence rates of pediatric MS in the US 2004–2009. Based on the numbers reported in the Kaiser Permanente database, they estimated the incidence rate of pediatric MS to be 0.5 per 100,000 children (Langer-Gould et al., 2013). Of note, only free-standing children’s hospitals participate in PHIS. In addition, the PHIS estimate does not include 8 major academic centers with established pediatric clinical and research programs (Pediatric MS Center at Loma Linda Children’s Hospital, San Bernadino, CA; Partners Pediatric MS Center at Mass General Hospital, Boston, MA; Mayo Clinic Pediatric MS Center Rochester, MN; Lourie Center for Pediatric MS at Stony Brook University Stony Brook, NY; University of California San Francisco Regional Pediatric MS Center; Pediatric MS Center at the Jacobs Neurological Institute, Buffalo, NY; Mellen Center for Multiple Sclerosis, Cleveland Clinic, Cleveland, OH; Rocky Mountain MS Center, University of Colorado, Denver, CO; see Table 1). Utilizing a simple mean imputation method where the mean number of admissions per year is assigned to these 8 hospitals and added to the total number found in the present study, the prevalence rate is 0.31, which is still below prior U.S. estimates. Since the PHIS database only includes hospitalizations, we further explored our assumption that most children with MS are hospitalized at least once during their disease course. We determined that 73% of MS patients at CHOP were hospitalized on at least one occasion, which means the PHIS data could be underrepresenting MS cases by approximately 30%. Even after correcting the estimate for patients not hospitalized and applying the imputation to account for data from non-PHIS pediatric MS centers, our prevalence rate (0.40 per 100,000) is still lower than that reported by Langer-Gould et al.
We did not include in our analyses children diagnosed with optic neuritis, transverse myelitis or other demyelinating presentations unless they had a subsequent diagnosis of MS coded. As such, we have underestimated children with MS who were hospitalized for their incident MS attack, but not hospitalized subsequently once their MS diagnosis was confirmed (ie: none of their further relapses required hospital care). In contrast, the Kaiser-Permanente database would capture such patients through outpatient visit codes, and this difference in ascertainment might explain some of the variance in estimated prevalence.
In addition to missing information from hospitals not represented in the PHIS database, we acknowledge the following limitations for this study. The diagnosis of MS could not be confirmed through medical records; however, we only included patients for whom the reason for admission, procedures, and discharge diagnosis were related to MS. Our data may also be skewed to those children who have greater neurologic deficits as they are more likely to be admitted to the hospital. The percentage of MS admissions varied by institution, which was not fully explained by the presence or absence of MS expertise (defined as a funded center or an active MS research program). We cannot exclude the possibility of ascertainment bias or referral bias at the centers with the higher rates. Our analyses of MS-related hospital costs are predicated on the assumption that all admissions were due to MS relapses. In adults patients with MS, hospitalizations may also occur due to co-morbid health issues such as hypertension, heart disease and diabetes (Marrie et al., 2015). However, co-morbid conditions are rare in children and are unlikely to have influenced our data. Additionally, while participating hospitals are located throughout the US, data was unavailable to calculate regional prevalence rates proximal to the PHIS hospitals since the population served by a single institution was unknown.
In summary, the number of admissions due to pediatric MS has increased since the start of the PHIS database collection in 2004, concurrent with the establishment of dedicated pediatric MS centers and increased disease awareness. Further epidemiologic studies or national surveillance programs are needed to determine the incidence and prevalence of pediatric MS in the US. Pediatric MS is a serious illness associated with frequent hospitalization and with substantive health care costs. A greater appreciation of the impact of pediatric-onset MS on health related quality of life of patients and their families, and a more comprehensive appreciation of the financial burden of care is clearly needed.
References
- Akhavan A, Merguerian Pa, Larison C, Goldin AB, Shnorhavorian M. Trends in the rates of pediatric pyeloplasty for ureteropelvic junction obstruction over 19 years: a PHIS database study. Adv Urol. 2014;2014 doi: 10.1155/2014/142625. [DOI] [PMC free article] [PubMed] [Google Scholar]
- Banwell B, Ghezzi A, Bar-Or A, Mikaeloff Y, Tardieu M. Multiple sclerosis in children: clinical diagnosis, therapeutic strategies, and future directions. Lancet Neurol. 2007;6(10):887–902. doi: 10.1016/S1474-4422(07)70242-9. 2007/09/22 ed. [DOI] [PubMed] [Google Scholar]
- Bourgeois FT, Monuteaux MC, Stack AM, Neuman MI. Variation in emergency department admission rates in US children’s hospitals. Pediatrics [Internet] 2014;134(3):539–545. doi: 10.1542/peds.2014-1278. Available from 〈 http://www.ncbi.nlm.nih.gov/pubmed/25113291〉. [DOI] [PMC free article] [PubMed] [Google Scholar]
- Center for Disease Control. CDC Wonder Surveillance Program [Internet] 2015 Available from: wonder.cdc.gov/welcomeA.html.
- Gorman MP, Healy BC, Polgar-Turcsanyi M, Chitnis T. Increased relapse rate in pediatric-onset compared with adult-onset multiple sclerosis. Arch Neurol. 2009;66(1):54–59. doi: 10.1001/archneurol.2008.505. [DOI] [PubMed] [Google Scholar]
- Kolasa K. How much is the cost of multiple sclerosis–systematic literature review. Przegla̧d Epidemiol [Internet] 2013;67(3):75–79. Available from 〈 http://www.ncbi.nlm.nih.gov/pubmed/23745380〉. [PubMed] [Google Scholar]
- Krupp LB, Banwell B, Tenembaum S. International Pediatric MSSG. Consensus definitions proposed for pediatric multiple sclerosis and related disorders. Neurology [Internet] 2007;68(16 Suppl 2):S7–S12. doi: 10.1212/01.wnl.0000259422.44235.a8. 2007/04/18 ed. United States. Available from: 〈 http://www.neurology.org/content/68/16_suppl_2/S7〉. [DOI] [PubMed] [Google Scholar]
- Krupp LB, Tardieu M, Amato MP, Banwell B, Chitnis T, Dale RC, et al. International Pediatric Multiple Sclerosis Study Group criteria for pediatric multiple sclerosis and immune-mediated central nervous system demyelinating disorders: revisions to the 2007 definitions. Mult Scler [Internet] 2013;19(10):1261–7. doi: 10.1177/1352458513484547. [cited 2015 Nov 15] Available from: 〈 http://www.ncbi.nlm.nih.gov/pubmed/23572237〉. [DOI] [PubMed] [Google Scholar]
- Langer-Gould A, Brara SM, Beaber BE, Zhang JL. Incidence of multiple sclerosis in multiple racial and ethnic groups. Neurology. 2013;80:1734–1739. doi: 10.1212/WNL.0b013e3182918cc2. [DOI] [PubMed] [Google Scholar]
- Marrie RA, Elliott L, Marriott J, Cossoy M, Tennakoon A, Yu N. Comorbidity increases the risk of hospitalizations in multiple sclerosis. Neurology [Internet] 2015 Jan 27;84(4):350–8. doi: 10.1212/WNL.0000000000001187. 2015. [cited 2015 Oct 28] Available from: 〈 http://www.pubmedcentral.nih.gov/articlerender.fcgi?artid=4336005&tool=pmcentrez&rendertype=abstract〉. [DOI] [PMC free article] [PubMed] [Google Scholar]
- National Multiple Sclerosis Society [Internet] 2016 Available from: 〈 Http://www.nationalmssociety.org/About-the-Society/MS-Prevalence〉.
- Olson D, Birkholz M, Gaensbauer JT, Asturias EJ, Todd JK. Analysis of the Pediatric Health Information System database as a surveillance tool for travel-associated infectious diseases. Am J Trop Med Hyg [Internet] 2015;92(5):1067–9. doi: 10.4269/ajtmh.14-0794. Available from: 〈 http://www.ajtmh.org/cgi/doi/10.4269/ajtmh.14-0794〉. [DOI] [PMC free article] [PubMed] [Google Scholar]
- Polman CH, Reingold SC, Banwell B, Clanet M, Cohen JA, Filippi M, et al. Diagnostic criteria for multiple sclerosis: 2010 revisions to the McDonald criteria. Ann Neurol [Internet] 2011;69(2):292–302. doi: 10.1002/ana.22366. 2011/03/10 ed. Available from: 〈 http://onlinelibrary.wiley.com/store/10.1002/ana.22366/asset/22366_ftp.pdf?v=1&t=hd7twd3j&s=c386084f65705c35ceeacdc6d7cfd63511d3a9ec〉. [DOI] [PMC free article] [PubMed] [Google Scholar]
- Verhey LH, Branson HM, Shroff MM, Callen DJ, Sled JG, Narayanan S, et al. MRI parameters for prediction of multiple sclerosis diagnosis in children with acute CNS demyelination: a prospective national cohort study. Lancet Neurol. 2011;10(12):1065–1073. doi: 10.1016/S1474-4422(11)70250-2. 2011/11/10 ed. [DOI] [PubMed] [Google Scholar]
- Waldman AT, Gorman MP, Rensel MR, Austin TE, Hertz DP, Kuntz NL, et al. Management of pediatric central nervous system demyelinating disorders: consensus of United States neurologists. J Child Neurol. 2011;26(6):675–682. doi: 10.1177/0883073810395141. 2011/04/27 ed. United States. [DOI] [PMC free article] [PubMed] [Google Scholar]
- Weiss A, Elixhauser A. Overview of hospital stays in the United States, 2012: Statistical Brief #180. Healthcare Cost and Utilization Project (HCUP) Statistical Brief; [Google Scholar]
- Wilson KM, Torok MR, Localio R, McLeod L, Srivastava R, Luan X, et al. Hospitalization for community-acquired pneumonia in children: effect of an asthma codiagnosis. Hosp Pediatr [Internet] 2015;5(8):415–422. doi: 10.1542/hpeds.2015-0007. Available from: 〈 http://hosppeds.aappublications.org/CGI/DOI/10.1542/hpeds.2015-0007〉. [DOI] [PubMed] [Google Scholar]
- Yeh EA, Chitnis T, Krupp L, Ness J, Chabas D, Kuntz N, et al. Nat Rev [Internet] 11. Vol. 5. England: Nature Publishing Group; 2009. Pediatric multiple sclerosis; pp. 621–31. Available from: 〈 http://WWW.Nature.com/doifinder/10.1038/nrneurol.2009.158〉. [DOI] [PubMed] [Google Scholar]