Abstract
Neutrophilic asthma (NA) is associated with a severe disease course and poor response to corticosteroids. The present study aimed to compare the effects of various concentrations of house dust mite (HDM) allergens, ovalbumin (OVA), the major egg allergen, and lipopolysaccharide (LPS) in combination on the onset of severe NA. Female C57BL/6 mice were grouped according to a random number table and intranasally sensitized with HDM/LPS/OVA extracts on days 0, 1 and 2 of the study. In group 1, mice received 50 µg HDM + 50 µg OVA + 15 µg LPS, mice in group 2 received 50 µg HDM + 100 µg OVA + 15 µg LPS, mice in group 3 received 100 µg HDM + 50 µg OVA + 15 µg LPS and those in group 4 received 100 µg HDM + 100 µg OVA + 15 µg LPS, while mice in the control group received saline only. The mice were then challenged by OVA solution with atomized excitation on days 14, 15, 18, 19 and 20 for 30 min each. Ethology, airway hyperresponsiveness (AHR), immune cell distributions in bronchoalveolar lavage fluid (BALF), and specific cytokines interleukin 17A (IL-17A) and IL-4 in serum were assessed. Histological examination of inflammation by hematoxylin and eosin staining and immunohistochemical assessment of neutrophils (NEU), eosinophils (EOS), IL-17A and IL-4 were also performed. Compared with the control group, the HDM/OVA/LPS-sensitized groups 1–4 had markedly increased BALF cells, serum interleukin IL-17A and IL-4, inflammatory cell infiltration, EOS as well as IL-17A and IL-4 by immunohistochemical staining (all P<0.05). Among the four HDM/OVA/LPS-sensitized groups, mice of group 4 had higher AHR, a significantly higher total cell number, NEU and EOS in BALF as well as significantly higher NEU and NEU/EOS ratios according to immunohistochemical staining when compared to groups 1–3 (P<0.05 for all). In conclusion, sensitization with 100 µg HDM + 100 µg OVA + 15 µg LPS successfully established a severe asthma model with a predominantly neutrophilic inflammatory phenotype.
Keywords: severe asthma, mice, lipopolysaccharide, house dust mites, ovalbumin, neutrophil
Introduction
Asthma is a complex chronic inflammatory disease characterized by airway hyperresponsiveness (AHR), reversible airflow obstruction and airway inflammation. The underlying immunological mechanisms involved in the development of asthma have remained to be fully elucidated (1). Eosinophilic airway inflammation and the imbalance of T helper type I (Th1)/Th2 lymphocytes are generally recognized as pivotal factors in the pathogenesis of asthma (2,3). In general, corticosteroid therapy is more advisable in patients with eosinophilic asthma (4). However, a review based on 21 clinical studies revealed that 50% of all asthma cases were associated with a weak eosinophilic airway inflammation, which is referred to as non-eosinophilic asthma (5). These non-eosinophilic asthma cases are characterized by a neutrophilic and mixed granulocytic predominance, associated with a severe course of the disease and a poor response to corticosteroids (5–9). In line with previous studies, Moore et al (10) reported an increased frequency of the eosinophilic inflammatory phenotype in a control cluster of less severe asthma cases, while neutrophilic predominance and mixed granulocytic patterns were most frequent in the severe asthma cluster. Various clinical studies have indicated that neutrophilic inflammation in patients with severe, persistent bronchial asthma is a long-term side effect of inappropriate use of corticosteroids (5,11–13). Therefore, it has remained elusive whether the increased rate of neutrophilic asthma NA is an independent risk factor for the severity of asthma or a side effect due to exposure to corticosteroids. The establishment of a model of predominantly neutrophilic asthma may provide novel insight in to the mechanisms by which neutrophilic inflammation contributes to the pathophysiology of asthma.
At present, there is no established method to induce NA in mice. Ovalbumin (OVA) is a classic allergen to generate a mouse model of asthma (14). Recently, house dust mite (HDM) allergens were reported to be able to induce NA (15). Lipopolysaccharide (LPS) is known to be a risk factor in the development of asthma-like symptoms and acts as an adjuvant in asthma models (16). In the present study, the effects of various doses of HDM and OVA in addition to 15 µg LPS for inducing NA were compared.
Materials and methods
Animals
A total of 30 female C57BL/6 mice (age, 6–7 weeks; weight, 18–20 g) were provided by the animal center of the Second Xiangya Hospital of Central South University (Xiangya, China). The mice were maintained in the following conditions: Temperature, 20–25°C; humidity, 50%; and exposed to a 12-h light/dark cycle. Mice were fed a standardized specific pathogen-free diet with free access to the OVA-free food and clean water. The present study was approved by the Ethics Committee of the Second Xiangya Hospital and Central South University and all studies were performed in compliance with the Second Xiangya Hospital and Central South University Animal Care and Use Committee guidelines.
Experimental reagents and equipment
The HDM extract was purchased from GREER® (Lenoir, NC, USA). The LPS, aluminum hydroxide [Al(OH)3] gel and OVA (cat. no. A5503-1 G) were from Sigma-Aldrich (Merck KGaA, Darmstadt, Germany). The small animal cough and asthma induction instrument (YLS-8A) was purchased from Beijing Zhongshidichuang Science and Technology Development Co., Ltd (Beijing, China), the mouse spirometer (MAX 1320) was purchased from Buxco® (Data Science International, New Brighton, MN, USA), and the optical microscope (DMI3000B) and the pathological image analyzer (Leica Application Suite V4) were from Leica Microsystems (Wetzlar, Germany).
Mouse asthma model
Female C57BL/6 mice were grouped randomly with six mice per cage. The mice were intraperitoneally sensitized with HDM/LPS/OVA on days 0, 1 and 2: In group 1, mice received 50 µg HDM + 50 µg OVA + 15 µg LPS; in group 2, mice received 50 µg HDM + 100 µg OVA + 15 µg LPS; in group 3, mice received 100 µg HDM + 50 µg OVA + 15 µg LPS; and in group 4, mice received 100 µg HDM + 100 µg OVA + 15 µg LPS. In the control group, mice received saline only. Afterwards, mice were challenged with OVA solution with atomized excitation on days 14, 15, 18 and 19 for 30 min, then HDM solution intranasally per challenge.
Observation of ethology
The ethology of the mice was evaluated daily by observation of the following parameters: Fur luster, touching of nose and scratching of ears, irritability, sneezing, rapid breathing and incontinence.
AHR
Methacholine (Mch)-induced airway resistance was measured on day 21 (24 h after the final allergen application) by direct plethysmography (FinePointe RC system; Buxco; Data Science International). The procedures were the identical to those previously described (17). Anesthesia was performed by intraperitoneal injection of chloral hydrate (3 ml/kg), followed by tracheotomy and cannulation of the jugular vein. First, baseline lung resistance (RL0) was recorded for one minute. The mice were then given 10 µl saline and 10 µl Mch (Sigma-Aldrich; Merck KGaA) with increasing doses of 0.39 mg/ml (dose 1), 0.78 mg/ml (dose 2), 1.56 mg/ml (dose 3) and 3.12 mg/ml (dose 4). The mixture was sprayed to stimulate the airways and changes of lung resistance (RLX) were recorded. The final results were expressed as the ratio between RLX and RL0.
Bronchoalveolar lavage fluid (BALF) cell count and plasma interleukin (IL)-17A and IL-4 assay
The procedure of BALF cell collection was identical to a previously described method (17). After elimination of red blood cells, centrifugation (400 × g at 4°C for 10 min) and precipitation, the total BALF cell count was determined using a haemocytometer. Cell slices were then prepared by using the Liquid-Based Preparation System (LBP Medical Technology Co., Ltd., Guangzhou, China. BALF neutrophil (NEU) and eosinophil (EOS) cell counts were determined in 200 total BALF cells after staining of cell slices with hematoxylin and eosin (H&E).
At the end of the study, the mice were sacrificed, organs were harvested, blood samples were taken in EDTA-filled tubes, centrifuged at 4°C, 400 × g for 10 min, and plasma was frozen at −80°C. Serum IL-17 (no. CSB-E04608m), IL-4 (no. CSB-E04634m) were assayed by ELISA kits purchased from Cusabio Biotechnology Co., Ltd. (Wuhan, China).
Histopathological analysis of inflammatory and structural changes
The right lungs were fixed in 4% paraformaldehyde for 24 h and dehydrated with a graded series of ethanol, followed by treatment with xylene and embedding in paraffin. Sections were cut to 4-µm thick and baked for 1 h in the oven at 60°C. The samples were de-waxed in xylene and ethanol before hematoxylin staining for 5 min, eosin staining for 3 min, ethanol and xylene dehydration and neutral gum for mounting.
Three to four randomly selected H&E-stained lung tissue sections were analyzed per sample. The tissue inflammation score was evaluated by two independent pathologists who were blinded to the sample codes as previously described (18): 0, no inflammatory cell infiltration; 1, little inflammatory cell infiltration; 2, 1 layer of inflammatory cells around the airway; 3, 2–4 layers of inflammatory cells around the airway; 4, 4 or more layers of inflammatory cells around the airway.
Immunohistochemistry for NEU, EOS, IL-17A, and IL-4
Lung tissues were immunohistochemically stained using neutrophil-specific antibody; diluted 1:200; anti-gamma response 1; 0.5 mg/ml; cat. no. 14-5931; Thermo Fisher Scientific, Inc., Waltham, MA, USA), eosinophil antibody (diluted 1:200; anti-EOS cationic protein; 200 µg/400 µl; cat. no. orb13385; Biorbyt, Cambridge, UK), IL-17A antibody (diluted 1:200; 38 µg/150 µl; cat. no. 13082-1-AP; Proteintech, Rosemont, IL, USA) and IL-4 antibody (diluted 1:200; 0.1 mg/0.1 ml; cat. no. 251223; Abbiotec, LLC, San Diego, CA, USA) and incubated for 12 h at 4°C. Subsequently, lung tissue sections were immersed in rabbit anti-IgG poly HRP (diluted 1:1; 3 ml; cat. no. SV-0002; Boster Biological Technology Co. Ltd., Wuhan, China) at 37°C for 30 min. Two to four H&E-stained lung tissue sections per group and 25 fields from each lung tissue section were analyzed to evaluate NEU, EOS, IL-17A and IL-4 protein expression under the microscope and with an image processing system (Image-Pro Plus 6.0; Media Cybernetics, Rockville, MD, USA). The scores of NEU, EOS, IL-17A and IL-4 staining were calculated as a mean between the results obtained by two independent pathologists blinded to the sample codes.
Statistical analysis
Data were analyzed with SPSS version 17.0 (SPSS, Inc., Chicago, IL, USA). Values are expressed as the mean ± standard deviation. The Independent-samples t-test was used for comparison of continuous variables between groups. P<0.05 was considered to indicate a statistically significant difference.
Results
Ethology
After sensitization, mice in groups 1–4 showed various degrees of nose touching and ear scratching, irritability, sneezing, rapid breathing and incontinence, while mice in the control group showed no changes in ethology.
AHR
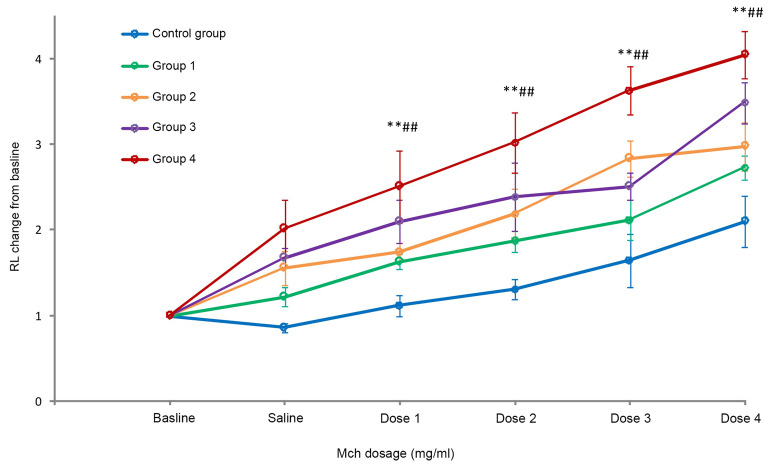
Mch-induced airway resistance was measured on day 20 (24 h after the final allergen application). With the increasing dose of Mch, mice that had been sensitized with 50 µg HDM + 50 µg OVA (group 1), 50 µg HDM + 100 µg (group 2), 100 µg HDM + 50 µg (group 3) and 100 µg HDM + 100 µg OVA (group 4) in addition to 15 µg LPS had a significantly increased lung resistance (RL) and there was a significant difference compared with the control group (P<0.05). The dose-response curves for the mice of group 4 demonstrated a significantly higher AHR than those for mice in the control group and groups 1–3 (all P<0.05; Fig. 1).
Figure 1.
Mch-induced airway hyperresponsiveness. Values are expressed as the mean ± standard deviation. **P<0.01 compared with control group; ##P<0.01 compared with groups 1–3. Groups: 1, 50 µg HDM + 50 µg OVA + 15 µg LPS; 2, 50 µg HDM + 100 µg OVA + 15 µg LPS; 3, 100 µg HDM + 50 µg OVA + 15 µg LPS; 4, 100 µg HDM + 100 µg OVA + 15 µg LPS; control, saline only. HDM, house dust mite allergen; OVA, ovalbumin; LPS, lipopolysaccharide; RL, lung resistance; Mch, methacholine.
BALF NEU and EOS, and plasma IL-17A and IL-4
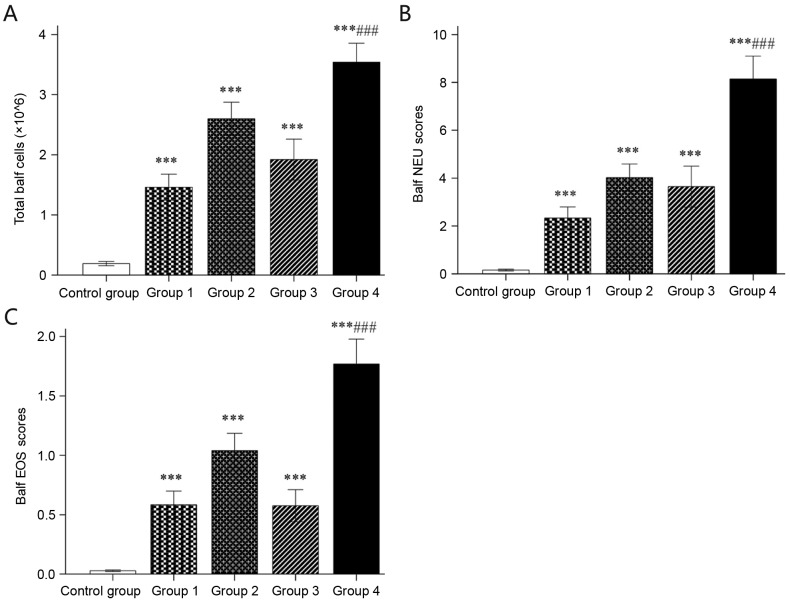
Mice of groups 1–4 had significantly higher total cell counts as well as NEU and EOS counts in the BALF than mice sensitized with saline (all P<0.05). In addition, mice in group 4 had a significantly higher total cell number as well as NEU and EOS counts in the BALF than groups 1–3 (all P<0.05; Fig. 2).
Figure 2.
BALF cell count. (A) Total BALF cell count (×106) determined by a haemocytometer. (B) NEU and (C) EOS counts were determined in 200 total BALF cells after tissue slicing and hematoxylin and eosin staining. Values are expressed as the mean ± standard deviation. ***P<0.001 compared with control group; ###P<0.001 compared with groups 1–3. Groups: 1, 50 µg HDM + 50 µg OVA + 15 µg LPS; 2, 50 µg HDM + 100 µg OVA + 15 µg LPS; 3, 100 µg HDM + 50 µg OVA + 15 µg LPS; 4, 100 µg HDM + 100 µg OVA + 15 µg LPS; control, saline only. HDM, house dust mite allergen; OVA, ovalbumin; LPS, lipopolysaccharide; BALF, bronchoalveolar lavage fluid; NEU, neutrophils; EOS, eosinophils.
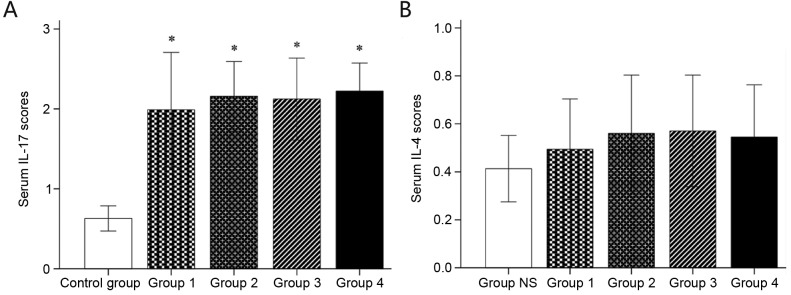
Mice in groups 1–4 had a significantly higher serum concentration of IL-17 than those in the control group (all P<0.05). There was no statistically significant difference among groups 1–4 (P>0.05 for all). Furthermore, there was no significant difference in serum IL-4 between the control and groups 1–4 (all P>0.05; Fig. 3).
Figure 3.
Serum (A) IL-17 and (B) IL-4 determined by ELISA. Values are expressed as the mean ± standard deviation. *P<0.05 compared with control group. Groups: 1, 50 µg HDM + 50 µg OVA + 15 µg LPS; 2, 50 µg HDM + 100 µg OVA + 15 µg LPS; 3, 100 µg HDM + 50 µg OVA + 15 µg LPS; 4, 100 µg HDM + 100 µg OVA + 15 µg LPS; control, saline only. HDM, house dust mite allergen; OVA, ovalbumin; LPS, lipopolysaccharide; IL, interleukin.
Structural changes and inflammatory scores of lung tissue
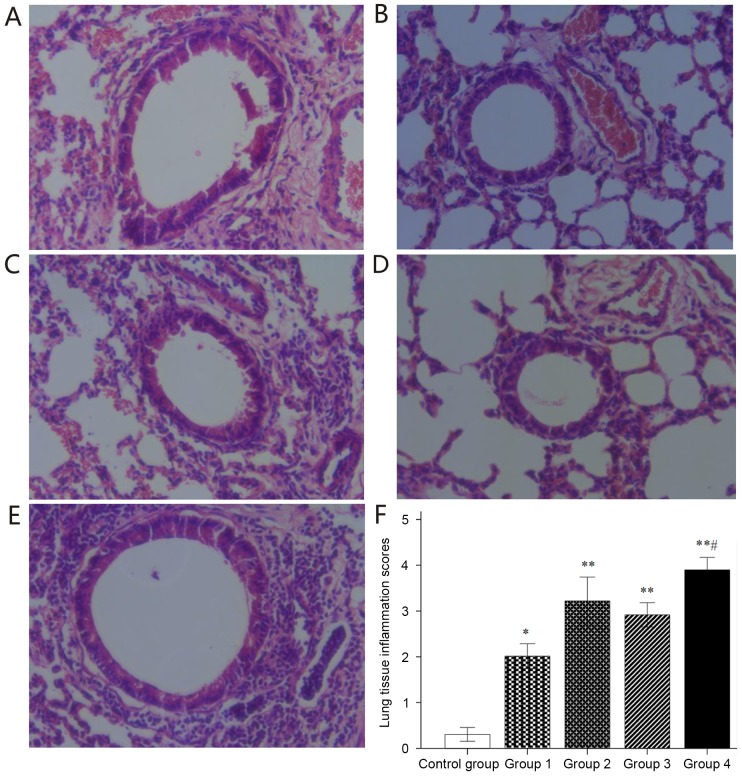
Lung tissue sections were stained with H&E to assess structural changes and inflammatory cell infiltration (Fig. 4). Histological analysis of lung tissue sections in the control group (Fig. 4A) revealed normal bronchial and alveolar structure, integrity of bronchial epithelium, neat arrangement of cilia and negligible inflammatory cell infiltration. Histological analysis of lung tissue sections in groups 1–4 demonstrated obvious congestion and edema in bronchial mucosa, stenosis of bronchial lumen, hyperplasia of goblet cells, epithelial cell necrosis, obvious inflammatory cell infiltration around the airway as well as interstitial pulmonary and small perivascular areas (Fig. 4B-E). Inflammatory responses were quantitatively evaluated, revealing that H&E-stained lung tissues in groups 1–4 had significantly higher inflammatory scores than those in the control group (all P<0.05); In addition, H&E-stained lung tissue in group 4 had significantly higher inflammatory scores than that in groups 1–3 (all P<0.05; Fig. 4F).
Figure 4.
Histological lung tissue structural changes and inflammatory infiltrate after hematoxylin and eosin staining. (A-E) Representative lung tissue sections for (A) Control and groups (B) 1, (C) 2, (D) 3 and (E) 4 (magnification, ×40). (F) Histological inflammation scoring. Values are expressed as the mean ± standard deviation. *P<0.05, **P<0.01 compared with control group; #P<0.05 compared with groups 1–3. Groups: 1, 50 µg HDM + 50 µg OVA + 15 µg LPS; 2, 50 µg HDM + 100 µg OVA + 15 µg LPS; 3, 100 µg HDM + 50 µg OVA + 15 µg LPS; 4, 100 µg HDM + 100 µg OVA + 15 µg LPS; control, saline only. HDM, house dust mite allergen; OVA, ovalbumin; LPS, lipopolysaccharide.
Immunohistochemical analysis of NEU, EOS, IL-17A and IL-4
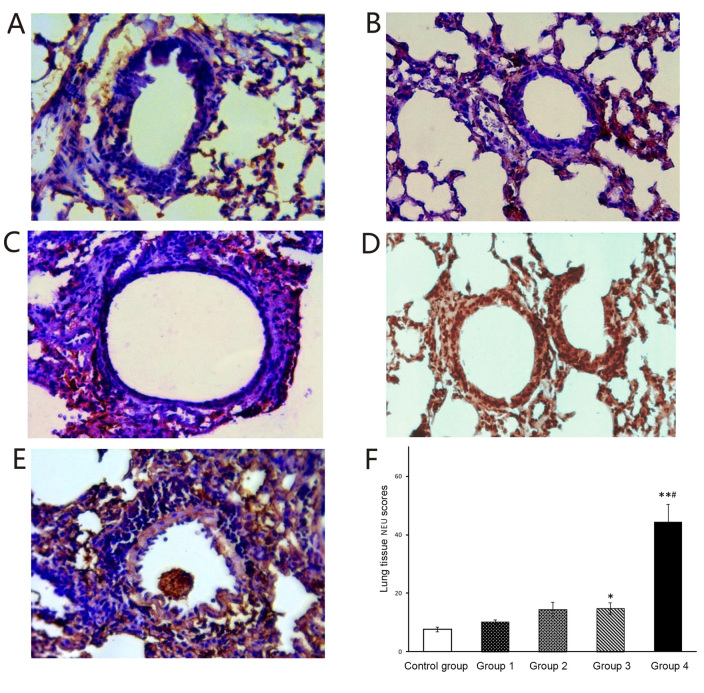
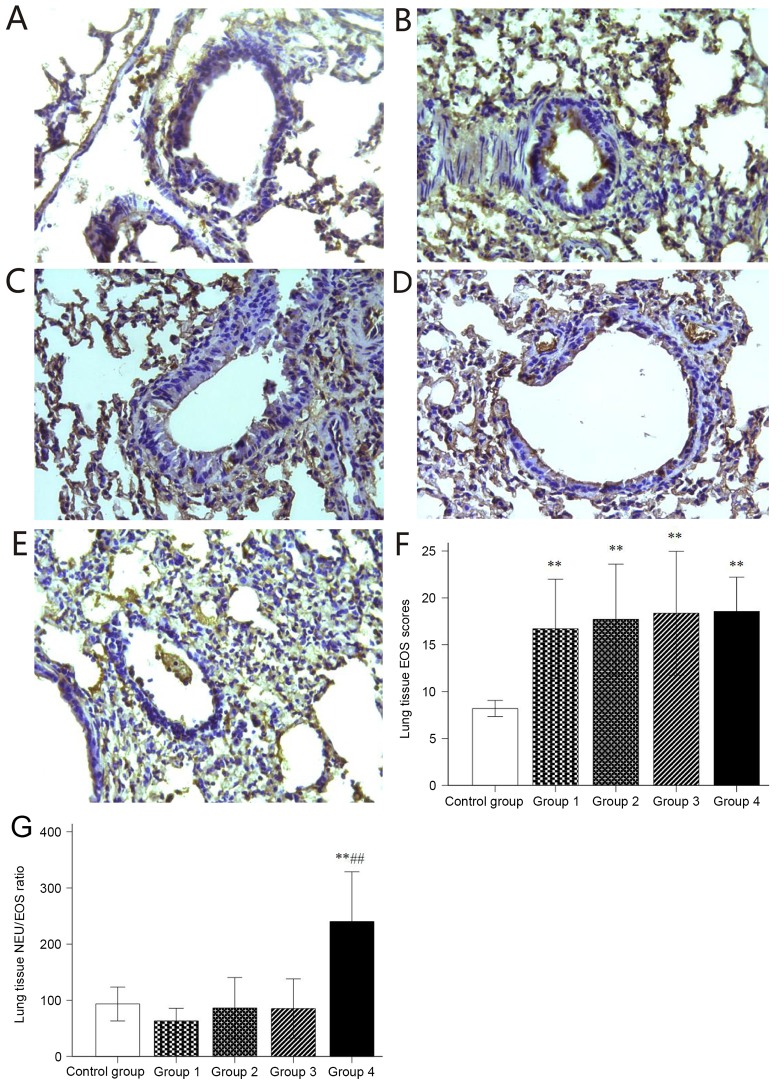
Histological sections of lung tissue were stained immunohistochemically to detect NEUs, EOSs, IL-17A and IL-4. A small amount of NEUs was observed in the stained sections of the control group (Fig. 5A) and groups 1 and 2 (Fig. 5B and C), while NEUs were significantly increased in the stained sections of groups 3 and 4 (Fig. 5D and E). In addition, group 4 contained significantly more NEUs than groups 1–3 (Fig. 5F). When compared with the control group, significantly more EOS were observed in the stained sections of groups 1–4 (Fig. 6A-F). The histological NEU vs. EOS scoring ratio (NEU/EOS) in shown in Fig. 6G; compared with those in the control group and groups 1–3, lung tissue in group 4 had a significantly higher NEU/EOS ratio (all P<0.001).
Figure 5.
Immunohistochemical staining for NEU. (A-E) Representative immunohistochemical staining images for NEU in mouse lung tissues of (A) Control and groups (B) 1, (C) 2, (D) 3 and (E) 4 (magnification, ×40). (F) Histological NEU expression scoring. Values are expressed as the mean ± standard deviation. *P<0.05 and **P<0.01 compared with control group; #P<0.05 compared with groups 1–3. Groups: 1, 50 µg HDM + 50 µg OVA + 15 µg LPS; 2, 50 µg HDM + 100 µg OVA + 15 µg LPS; 3, 100 µg HDM + 50 µg OVA + 15 µg LPS; 4, 100 µg HDM + 100 µg OVA + 15 µg LPS; control, saline only. HDM, house dust mite allergen; OVA, ovalbumin; LPS, lipopolysaccharide; NEU, neutrophils.
Figure 6.
Immunohistochemical staining for EOS. (A-E) Representative immunohistochemical staining images for EOS in lung tissues of mice in (A) Control and groups (B) 1, (C) 2, (D) 3 and (E) 4 (magnification, ×40). (F) Histological EOS expression scoring. (G) histological NEU and EOS expression scoring ratio (NEU/EOS). Values are expressed as the mean ± standard deviation. **P<0.01 compared with control group; ##P<0.01 compared with groups 1–3. Groups: 1, 50 µg HDM + 50 µg OVA + 15 µg LPS; 2, 50 µg HDM + 100 µg OVA + 15 µg LPS; 3, 100 µg HDM + 50 µg OVA + 15 µg LPS; 4, 100 µg HDM + 100 µg OVA + 15 µg LPS; control, saline only. HDM, house dust mite allergen; OVA, ovalbumin; LPS, lipopolysaccharide; NEU, neutrophils; EOS, eosinophils.
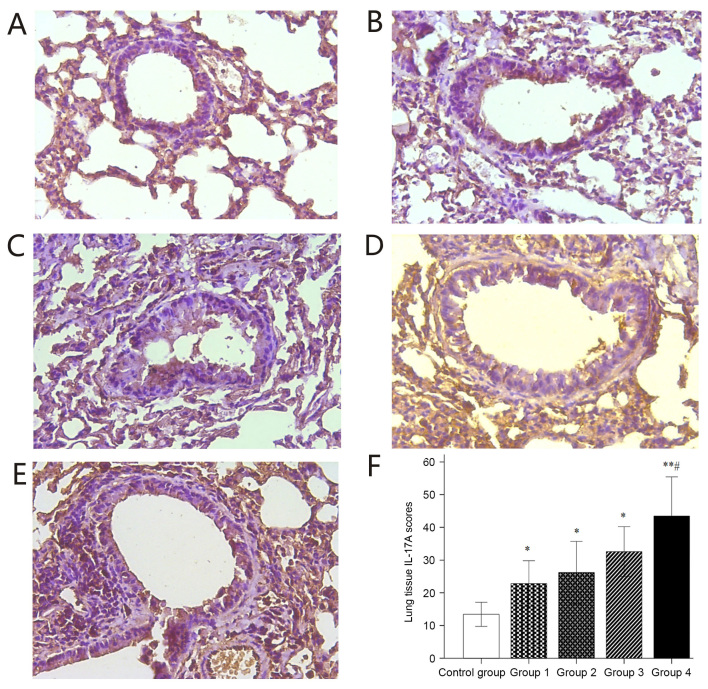
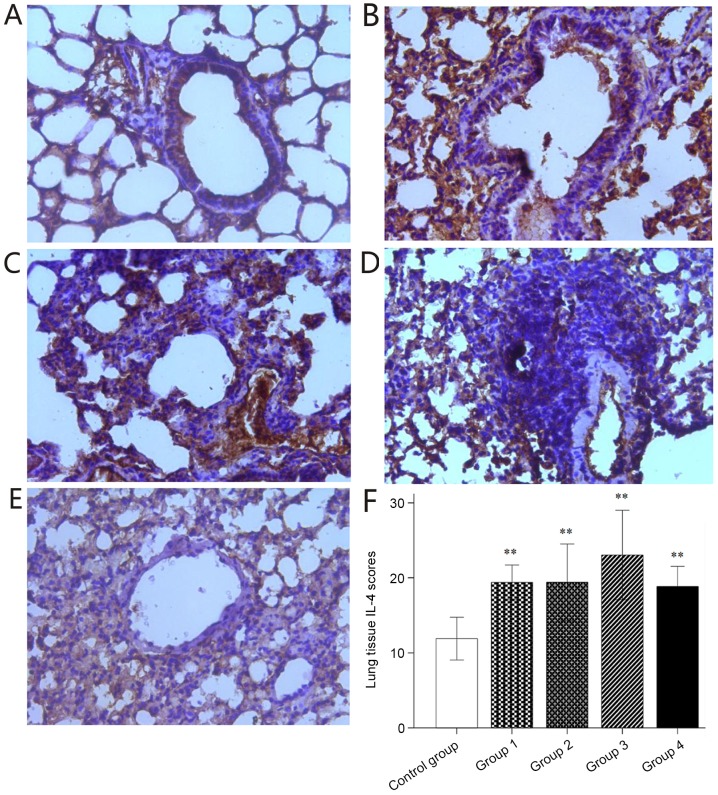
The localization of IL-17A expression is known to be associated with severe asthma. A small number of IL-17A-positive cells were observed in the stained sections of the control group (Fig. 7A), whereas the number of IL-17A-positive cells were markedly increased in the stained sections of groups 1–4 (Fig. 7B-E). This difference was statistically significant (Fig. 7F). The asthma induction groups had significantly higher IL-17A expression scoring than the control group. Furthermore, significantly higher IL-17A expression was observed in the stained lung sections of group 4 compared with that in the control and groups 1–3 (Fig. 7F). Significantly elevated IL-4 expression was observed in the stained sections of groups 1–4 compared with that in the control group (Fig. 8).
Figure 7.
Immunohistochemical staining for IL-17A. (A-E) Representative immunohistochemical staining images for IL-17A in lung tissues of mice in (A) Control and groups (B) 1, (C) 2, (D) 3 and (E) 4 (magnification, ×40). (F) Histological IL-17A expression scoring. Values are expressed as the mean ± standard deviation. *P<0.05, **P<0.01 compared with control group; #P<0.05 compared with groups 1–3. Groups: 1, 50 µg HDM + 50 µg OVA + 15 µg LPS; 2, 50 µg HDM + 100 µg OVA + 15 µg LPS; 3, 100 µg HDM + 50 µg OVA + 15 µg LPS; 4, 100 µg HDM + 100 µg OVA + 15 µg LPS; control, saline only. HDM, house dust mite allergen; OVA, ovalbumin; LPS, lipopolysaccharide; IL, interleukin.
Figure 8.
Immunohistochemical staining for IL-4. (A-E) Representative immunohistochemical staining images for IL-4 in lung tissues of mice in (A) Control and groups (B) 1, (C) 2, (D) 3 and (E) 4 (magnification, ×40). (F) Histological IL-4 expression scoring. Values are expressed as the mean ± standard deviation. **P<0.01 compared with control group. Groups: 1, 50 µg HDM + 50 µg OVA + 15 µg LPS; 2, 50 µg HDM + 100 µg OVA + 15 µg LPS; 3, 100 µg HDM + 50 µg OVA + 15 µg LPS; 4, 100 µg HDM + 100 µg OVA + 15 µg LPS; control, saline only. HDM, house dust mite allergen; OVA, ovalbumin; LPS, lipopolysaccharide; IL, interleukin.
Discussion
Exposure to LPS is known to increase a risk of asthma-like symptoms and the onset of asthma exacerbations (19,20). OVA is a classic allergen used for asthma induction in the experimental setting. Zhan et al (21) examined the effects of different doses of OVA in the range of 10–1,000 µg for the establishment of asthma in murine models. They concluded that low doses of OVA are suitable for establishing eosinophilic inflammatory allergic asthma, whereas high OVA doses result in immune tolerance, which fails to induce asthma. Co-exposure to LPS and OVA results in a different inflammatory phenotype: In the absence of OVA, 10 µg LPS alone caused a slight increase of NEUs in BALF, while in the presence of OVA, 10 µg LPS caused a slight increase of EOS (22). LPS alone cannot establish an asthma mouse model, but OVA sensitization combined with a high dose of LPS (100 µg) resulted in a NEU increase in lung tissue (23). The development of allergic asthma is strongly associated with the exposure to HDM (24,25). Although there are geographical differences, as many as 85% of asthmatics are typically allergic to HDM (26). When OVA-induced asthmatic mice are re-exposed to HDM, the pathogenic mechanism is different from that in response to exposure to OVA alone (27). As mentioned above, different doses of LPS, OVA and HDM alone, and different combinations of them trigger different pathogenic mechanisms.
In the present study, the effect of different doses of HDM and OVA combined with 15 µg LPS was tested for the establishment of a murine model of neutrophilic-predominant severe asthma. Inflammatory responses were assessed in the BALF and stained lung tissue sections. Compared with those in the control mice, total cells as well as NEU and EOS counts in the BALF were significantly increased in all HDM/OVA/LPS-sensitized groups 1–4. Importantly, among these four HDM/OVA/LPS-sensitized groups, group 4 had significantly higher total cells, NEUs and EOS in the BALF compared with those in groups 1–3. Similarly, analysis of lung tissue sections revealed that all HDM/OVA/LPS-sensitized groups 1–4 had significantly higher histological inflammation scoring and expression of NEU and EOS markers than the control group. Furthermore, among the four HDM/OVA/LPS-sensitized groups, group 4 had a significant higher histological inflammation scoring, NEU marker expression and NEU/EOS ratio, whereas there was no difference in the expression of EOS-specific marker among groups 1–4. Therefore, only 100 µg HDM + 100 µg OVA + 15 µg LPS successfully established a murine asthma model with a predominantly neutrophilic inflammatory phenotype.
The role of cytokines and chemokines in the onset of asthma has remained to be fully elucidated. Compared to moderate asthma, in severe asthma, IL-4 expression was previously reported to be decreased (9), whereas IL-17A expression was increased (28–30). The objectives of the present study were to investigate the expression of IL-17A and IL-4 in the serum and lung tissue of mice to which varying HDM/OVA/LPS sensitization protocols were applied. In the present study, IL-17A expression in serum and lung tissue was significantly increased in the four HDM/OVA/LPS-sensitized groups when compared with that in the control. Importantly, among the four HDM/OVA/LPS-sensitized groups, group 4 had significantly higher IL-17A expression in lung tissue compared with that in groups 1–3. Although the lung tissues in the four HDM/OVA/LPS-sensitized groups had significantly higher IL-4 expression compared with that in the control, the serum IL-4 expression did not differ between the control and the four HDM/OVA/LPS-sensitized groups. In addition, significantly elevated levels IL-17A in serum and lung tissue were in parallel with ethology changes, a higher AHR and an obviously higher inflammatory cell infiltration in the mice of group 4 in comparison with those in the control and groups 1–3. Therefore, 100 µg HDM + 100 µg OVA + 15 µg LPS successfully established a severe asthma model.
The mice in the present study were not exposed to corticosteroids. An increased expression of NEU marker in serum and lung tissue may exclude the side effects of inappropriate use of corticosteroids. In other words, increased NEUs are an independent risk factor for severe asthma development. In the future, the development of specific tools to reveal the causality and biological relevance between NEUs and severe asthma is required.
In conclusion, sensitization with 100 µg HDM + 100 µg OVA + 15 µg LPS led to the successful establishment of a severe asthma model with a predominantly neutrophilic inflammatory phenotype.
Acknowledgements
This study was supported by the National Natural Science Foundation of China (grant no. 81370128).
Glossary
Abbreviations
- NEU
neutrophils
- HDM
house dust mites
- OVA
ovalbumin
- LPS
lipopolysaccharide
- AHR
airway hyperresponsiveness
- BALF
bronchoalveolar lavage fluid
- IL-17A
interleukin 17A
- EOS
eosinophils
- H&E
hematoxylin and eosin
- Mch
methacholine
References
- 1.Holgate ST. Innate and adaptive immune responses in asthma. Nat Med. 2012;18:673–683. doi: 10.1038/nm.2731. [DOI] [PubMed] [Google Scholar]
- 2.Mazzarella G, Bianco A, Catena E, De Palma R, Abbate GF. Th1/Th2 lymphocyte polarization in asthma. Allergy. 2000;55:S6–S9. doi: 10.1034/j.1398-9995.2000.00511.x. (Suppl 61) [DOI] [PubMed] [Google Scholar]
- 3.Holt PG. Key factors in the development of asthma: Atopy. Am J Respir Crit Care Med. 2000;161:S172–S175. doi: 10.1164/ajrccm.161.supplement_2.a1q4-5. [DOI] [PubMed] [Google Scholar]
- 4.Pavord ID, Brightling CE, Woltmann G, Wardlaw AJ. Non-eosinophilic corticosteroid unresponsive asthma. Lancet. 1999;353:2213–2214. doi: 10.1016/S0140-6736(99)01813-9. [DOI] [PubMed] [Google Scholar]
- 5.Douwes J, Gibson P, Pekkanen J, Pearce N. Non-eosinophilic asthma: Importance and possible mechanisms. Thorax. 2002;57:643–648. doi: 10.1136/thorax.57.7.643. [DOI] [PMC free article] [PubMed] [Google Scholar]
- 6.Godon P, Boulet LP, Malo JL, Cartier A, Lemière C. Assessment and evaluation of symptomatic steroid-naive asthmatics without sputum eosinophilia and their response to inhaled corticosteroids. Eur Respir J. 2002;20:1364–1369. doi: 10.1183/09031936.02.00017502. [DOI] [PubMed] [Google Scholar]
- 7.Berry M, Morgan A, Shaw DE, Parker D, Green R, Brightling C, Bradding P, Wardlaw AJ, Pavord ID. Pathological features and inhaled corticosteroid response of eosinophilic and non-eosinophilic asthma. Thorax. 2007;62:1043–1049. doi: 10.1136/thx.2006.073429. [DOI] [PMC free article] [PubMed] [Google Scholar]
- 8.Shannon J, Ernst P, Yamauchi Y, Olivenstein R, Lemiere C, Foley S, Cicora L, Ludwig M, Hamid Q, Martin JG. Differences in airway cytokine profile in severe asthma compared to moderate asthma. Chest. 2008;133:420–426. doi: 10.1378/chest.07-1881. [DOI] [PubMed] [Google Scholar]
- 9.Hastie AT, Moore WC, Meyers DA, Vestal PL, Li H, Peters SP, Bleecker ER. National Heart, Lung, and Blood Institute Severe Asthma Research Program: Analyses of asthma severity phenotypes and inflammatory proteins in subjects stratified by sputum granulocytes. J Allergy Clin Immunol. 2010;125:1028–1036. doi: 10.1016/j.jaci.2010.02.008. e13. [DOI] [PMC free article] [PubMed] [Google Scholar]
- 10.Moore WC, Hastie AT, Li X, Li H, Busse WW, Jarjour NN, Wenzel SE, Peters SP, Meyers DA, Bleecker ER. National Heart, Lung, and Blood Institute's Severe Asthma Research Program: Sputum neutrophil counts are associated with more severe asthma phenotypes using cluster analysis. J Allergy Clin Immunol. 2014;133:1557–1563. doi: 10.1016/j.jaci.2013.10.011. e5. [DOI] [PMC free article] [PubMed] [Google Scholar]
- 11.Kikuchi S, Nagata M, Kikuchi I, Hagiwara K, Kanazawa M. Association between neutrophilic and eosinophilic inflammation in patients with severe persistent asthma. Int Arch Allergy Immunol. 2005;137:S7–S11. doi: 10.1159/000085425. (Suppl 1) [DOI] [PubMed] [Google Scholar]
- 12.Cowan DC, Cowan JO, Palmay R, Williamson A, Taylor DR. Effects of steroid therapy on inflammatory cell subtypes in asthma. Thorax. 2010;65:384–390. doi: 10.1136/thx.2009.126722. [DOI] [PubMed] [Google Scholar]
- 13.Naseem A, Liaqat J, Zaidi SB, Iftikhar R. Sputum neutrophilia in severe persistent asthmatics. J Coll Physicians Surg Pak. 2014;24:420–423. [PubMed] [Google Scholar]
- 14.Zhou E, Fu Y, Wei Z, Yang Z. Inhibition of allergic airway inflammation through the blockage of NF-κB activation by ellagic acid in an ovalbumin-induced mouse asthma model. Food Funct. 2014;5:2106–2112. doi: 10.1039/C4FO00384E. [DOI] [PubMed] [Google Scholar]
- 15.Tully JE, Hoffman SM, Lahue KG, Nolin JD, Anathy V, Lundblad LK, Daphtary N, Aliyeva M, Black KE, Dixon AE, et al. Epithelial NF-κB orchestrates house dust mite-induced airway inflammation, hyperresponsiveness, and fibrotic remodeling. J Immunol. 2013;191:5811–5821. doi: 10.4049/jimmunol.1301329. [DOI] [PMC free article] [PubMed] [Google Scholar]
- 16.Barboza R, Câmara NO, Gomes E, Sá-Nunes A, Florsheim E, Mirotti L, Labrada A, Alcântara-Neves NM, Russo M. Endotoxin Exposure during Sensitization to blomia tropicalis allergens shifts TH2 Immunity Towards a TH17-Mediated Airway Neutrophilic Inflammation: Role of TLR4 and TLR2. PLoS One. 2013;8:e67115. doi: 10.1371/journal.pone.0067115. [DOI] [PMC free article] [PubMed] [Google Scholar]
- 17.Locke NR, Royce SG, Wainewright JS, Samuel CS, Tang ML. Comparison of airway remodeling in acute, subacute, and chronic models of allergic airways disease. Am J Respir Cell Mol Biol. 2007;36:625–632. doi: 10.1165/rcmb.2006-0083OC. [DOI] [PubMed] [Google Scholar]
- 18.Bandukwala HS, Clay BS, Tong J, Mody PD, Cannon JL, Shilling RA, Verbeek JS, Weinstock JV, Solway J, Sperling AI. Signaling through Fc gamma RIII is required for optimal T helper type (Th)2 responses and Th2-mediated airway inflammation. J Exp Med. 2007;204:1875–1889. doi: 10.1084/jem.20061134. [DOI] [PMC free article] [PubMed] [Google Scholar]
- 19.Smit LA, Heederik D, Doekes G, Blom C, van Zweden I, Wouters IM. Exposure-response analysis of allergy and respiratory symptoms in endotoxin-exposed adults. Eur Respir J. 2008;31:1241–1248. doi: 10.1183/09031936.00090607. [DOI] [PubMed] [Google Scholar]
- 20.Celedón JC, Milton DK, Ramsey CD, Litonjua AA, Ryan L, Platts-Mills TA, Gold DR. Exposure to dust mite allergen and endotoxin in early life and asthma and atopy in childhood. J Allergy Clin Immunol. 2007;120:144–149. doi: 10.1016/j.jaci.2007.03.037. [DOI] [PMC free article] [PubMed] [Google Scholar]
- 21.Zhan XD, Jiang YX, Li LY, Li CP. Effect of different doses of ovalbumin on the establishment of an asthmatic mouse model. Acta Laboratorium Animalis Scientia Sinica. 2012;20:16–19. (In Chinese) [Google Scholar]
- 22.Ren Y, Ichinose T, He M, Song Y, Yoshida Y, Yoshida S, Nishikawa M, Takano H, Sun G, Shibamoto T. Enhancement of OVA-induced murine lung eosinophilia by co-exposure to contamination levels of LPS in Asian sand dust and heated dust. Allergy Asthma Clin Immunol. 2014;10:30. doi: 10.1186/1710-1492-10-30. [DOI] [PMC free article] [PubMed] [Google Scholar]
- 23.Su SM, Li CC, Ye LP, Zheng JS, Zhang WX, Luo YC, Li MR, Fang ZX. Effect of E. coli lipopolysaccharide on the allergic airway inflammation of asthma rat. Chin Asthma. 2007;1:46–49. (In Chinese) [Google Scholar]
- 24.De Alba J, Raemdonck K, Dekkak A, Collins M, Wong S, Nials AT, Knowles RG, Belvisi MG, Birrell MA. House dust mite induces direct airway inflammation in vivo: Implications for future disease therapy? Eur Respir J. 2010;35:1377–1387. doi: 10.1183/09031936.00022908. [DOI] [PubMed] [Google Scholar]
- 25.Lodge CJ, Lowe AJ, Gurrin LC, Hill DJ, Hosking CS, Khalafzai RU, Hopper JL, Matheson MC, Abramson MJ, Allen KJ, Dharmage SC. House dust mite sensitization in toddlers predicts current wheeze at age 12 years. J Allergy Clin Immunol. 2011;128:782–788. doi: 10.1016/j.jaci.2011.06.038. e9. [DOI] [PubMed] [Google Scholar]
- 26.Gregory LG, Lloyd CM. Orchestrating house dust mite-associated allergy in the lung. Trends Immunol. 2011;32:402–411. doi: 10.1016/j.it.2011.06.006. [DOI] [PMC free article] [PubMed] [Google Scholar]
- 27.Lan F, Liu K, Zhang J, Qi Y, Li K, Lin P. Th17 response is augmented in OVA-induced asthmatic mice exposed to HDM. Med Sci Monit. 2011;17:BR132–BR138. doi: 10.12659/MSM.881759. [DOI] [PMC free article] [PubMed] [Google Scholar]
- 28.Al-Ramli W, Préfontaine D, Chouiali F, Martin JG, Olivenstein R, Lemière C, Hamid Q. T(H)17-associated cytokines (IL-17A and IL-17F) in severe asthma. J Allergy Clin Immunol. 2009;123:1185–1187. doi: 10.1016/j.jaci.2009.02.024. [DOI] [PubMed] [Google Scholar]
- 29.Di Stefano A, Caramori G, Gnemmi I, Contoli M, Vicari C, Capelli A, Magno F, D'Anna SE, Zanini A, Brun P, et al. T helper type 17-related cytokine expression is increased in the bronchial mucosa of stable chronic obstructive pulmonary disease patients. Clin Exp Immunol. 2009;157:316–324. doi: 10.1111/j.1365-2249.2009.03965.x. [DOI] [PMC free article] [PubMed] [Google Scholar]
- 30.Lajoie S, Lewkowich IP, Suzuki Y, Clark JR, Sproles AA, Dienger K, Budelsky AL, Wills-Karp M. Complement-mediated regulation of the IL-17A axis is a central genetic determinant of the severity of experimental allergic asthma. Nat Immunol. 2010;11:928–935. doi: 10.1038/ni.1926. [DOI] [PMC free article] [PubMed] [Google Scholar]


