Abstract
In the present study, two different rat models of sepsis, cecal ligation and puncture (CLP), and lipopolysaccharide (LPS), were established. Changes in autophagy in both models were compared using transmission electron microscopy (TEM), immunohistochemistry, western blotting, and quantitative polymerase chain reaction techniques. Consequently, TEM analysis revealed autophagic bodies in the CLP and LPS sepsis models. In addition, autophagy-related protein LC3 A-specific staining was detected in the cytoplasm. However, analysis of protein and gene expression levels revealed a statistically significant increase in autophagic activity 12 and 24 h following induction of the CLP group, and 2 h following induction of the LPS group. Thus, it was concluded that both models of sepsis exhibited increased autophagic activity of the cardiomyocytes over time. The LPS model was superior to the CLP model in perturbation of molecular biological mechanisms, while the latter would be more likely suited for the study of physiological functions.
Keywords: sepsis, autophagy, cardiomyocyte, LPS, CLP
Introduction
The annual incidence of severe sepsis and septic shock is increasing annually with a fatality rate close to 50% (1). Sepsis often causes varying degrees of cardiac dysfunction, which accelerates the progression of sepsis and is an important cause of mortalities (2). Although numerous possible mechanisms have been proposed for sepsis-induced cardiac dysfunction, it is still poorly understood, and the following are the major implicated mechanisms: (i) an excitation-contraction decoupling process likely generated by hypoxia in cardiomyocytes, which reduces the capacity to produce high-energy phosphates (3); (ii) direct myocardial toxicity induced by bacterial endotoxin; (iii) initiation of ‘myocardial hibernation’ to maintain stable ATP levels by lowering contractility, reducing oxygen consumption, and developing functional adaptation to inflammation (4); (iv) changes in nitric oxide (NO) and NO synthase (NOS) expressions possibly leading to cardiovascular dysfunction (5–9); (v) myocardial toxicity of inflammatory mediators such as tumor necrosis factor (TNF)-α (10–12); (vi) changes in calcium ion channels possibly leading to cardiac insufficiency (13,14); (vii) occurrence of myocardial apoptosis and autophagy; and (viii) other factors such as sex, heredity, and age (13).
Autophagy is a lysosome-dependent degradation pathway characterized by cytoplasmic vacuolization. It is not only an in vivo degradation pathway of longevity proteins but also the sole mechanism for the organelle degradations (15). In particular, the changes in autophagy and its role in the occurrence of cardiovascular diseases has aroused considerable interest. Cell autophagy is a relatively conserved subcellular metabolic pathway specific to eukaryotes. It serves as a housekeeping mechanism for maintaining cells in a stable condition and regulating the continuous renewal of peroxidase, mitochondria, and endoplasmic reticulum. In addition, it also removes damaged organelles and metabolites in the cytoplasm, reconstructs the subcellular components, and protects damaged cells.
However, the excessive activation of cell autophagy leads to programmed cell death, namely type II cell apoptosis, which causes a series of disease processes. Considering that programmed cell death is regulatable, its inhibition is also possible (16). Currently, it is particularly important to investigate programmed cell death and its relationship with diseases. Therefore, to adequately explore the precise mechanisms of myocardial cell autophagy, more time-history information on the changes in autophagic activity and the extent of effects on the heart in different stress conditions is required.
The development of an appropriate model is a prerequisite for the experimental study of sepsis. Presently, two models are commonly used: the cecal ligation and puncture (CLP)- and lipopolysaccharide (LPS)-induced models of sepsis. The CLP-induced model is believed to simulate the development process of clinical sepsis more closely than other methods. The LPS-induced model does not provide a complete simulation of clinical sepsis. No domestic or foreign studies have reported on the similarity and difference in the expression of cardiomyocyte autophagy between the CLP and LPS models of sepsis and their mechanisms. The present study was a comparative examination of the CLP and LPS models and the results, which revealed that the expression of rat cardiomyocyte autophagy in both sepsis models was not the same, are reported in this paper.
Materials and methods
Establishment of CLP model
Male, specific-pathogen-free (SPF) Wistar rats of a clean grade (weighing 180 to 240 g and purchased from the Department of Experimental Animals, Shengjing Hospital of China Medical University, Shenyang, China) were divided into three groups (n=8) 6, 12, and 24 h, postoperatively using the random number method. A corresponding control group was used at each point in time. The rats were fasted overnight but allowed free access to water prior to the experiment. The rats were anesthetized by an intraperitoneal injection of 10% (mass fraction) chloral hydrate, and then a 1.5 cm incision was made along the abdominal midline. The ligation was performed with a no. 1 thread at a distance of 1–2 cm from the blind-ending cecum, avoiding the mesenteric vessels of the ileum and cecum.
The distal cecum was then punctured twice with a no. 9 needle, and a 2-mm wide lien rubber piece was inserted for a cut-through cecum. A small amount of feces was gently squeezed out, the cecum was returned to the abdominal cavity, and then the layers of the celiac incisions were sequentially sutured. The rats included in the experiment were classified according to the grading standard of intra-abdominal infection using the Simon method (Table I). The control group was similarly anesthetized and incised, but the cecum was stretched without puncturing, returned to the abdominal cavity, and then the celiac incision layers were sequentially sutured. The preoperative and intraoperative mean arterial pressure (MAP) of every rat was monitored via the femoral artery.
Table I.
Grading standard of intra-abdominal infection by Simon method.
| Grade no. | Characteristics |
|---|---|
| Grade 0 | No infected site |
| Grade 1 | Abscess formation, entire envelope, and no ascites |
| Grade 2 | Abscess formation, entire envelope, a small amount of ascites, and spotted necrosis on the cecum wall |
| Grade 3 | Diffuse intra-abdominal infection, a moderate amount of ascites, and gangrenous cecum |
| Grade 4 | Diffuse intra-abdominal infection, a large amount of bloody ascites, andextensive hemorrhage necrosis on the cecum wall |
Establishment of LPS model
An addition set of clean grade, male specific-pathogen-free (SPF) Wistar rats (weighing 180 to 240 g and purchased from the Department of Experimental Animals, Shengjing Hospital of China Medical University) were also divided into three groups (n=8) 2, 4, and 6 h after the induction using the random number method. Corresponding control groups were set at each time point. The rats were provided a normal diet and water freely prior to the experiment. Then, they were anesthetized by intraperitoneal injection of urethane, the right femoral vein was dissociated, and a slow bolus injection of LPS (L2880; Sigma-Aldrich, St. Louis, MO, USA) was administered at a dose and speed of 20 mg/kg and 0.1 ml/min, respectively. The MAP was monitored via the left femoral artery, and rats showing a drop in blood pressure indicated the successful establishment of the model and were included in the experimental group. The control group rats were administered slow injections of saline solution via the right femoral vein and subjected to other similar procedures as the experimental group.
Transmission electron microscopy (TEM)
To prepare the TEM tissue samples for analysis, approximately 1 mm3 2.5% glutaraldehyde-fixed myocardial tissue was washed in 0.1 mol/l phosphate-buffered saline (PBS), fixed in 1% osmic acid, gradient dehydrated with ethanol and acetone, embedded in epoxy resin, and then cut into ultrathin sections. After double staining with uranyl acetate and lead acetate, the ultrastructure of the myocardial tissue sections was observed under a JEM-1200EX transmission electron microscope.
Immunohistochemistry (IHC)
The prepared myocardial tissue sections (5-µm) were conventionally dewaxed, treated with freshly prepared 3% hydrogen peroxide solution at room temperature for 30 min to block peroxidases, and then washed thrice with PBS for 3 min each time. Then, the sections were treated with antigen retrieval buffer at 37°C for 5 min, washed thrice with PBS for 3 min each, and incubated overnight with the LC3 primary antibody (ab48394; Abcam, Cambridge, UK) at 4°C. The next day, the section were washed thrice with PBS for 3 min each time, incubated with secondary antibody for 1 h using an immunohistochemical kit (ZSGB-BIO, PV-9001), and washed thrice with PBS for 3 min each time. This was followed by development with 3,3′-diaminobenzidine (DAB) for 3 min, thorough washing, restaining with hematoxylin, dehydration with alcohol, dimethylbenzene treatment for transparency, and then sealing and microscopic examination.
Western blot analysis
Frozen left ventricular tissue (100 mg) was weighed, placed in a grinding bowl, and pulverized after adding a moderate amount of lysis solution. The lysate was transferred to a 1.5-ml Eppendorf (EP) tube and placed on ice for a 30-min lysis. The mixture was then centrifuged at 14,000 rpm for 15 min at 4°C, and the supernatant was subpackaged. A bicinchoninic acid (BCA) protein assay kit (P0010S; Beyotime Institute of Biotechnology, Shanghai, China) was used to determine the protein concentration, and samples of known concentrations were separated using sodium dodecyl sulfate-polyacrylamide gel electrophoresis (SDS-PAGE) after denaturation by mixing with the loading buffer at a ratio of 1:4 for 5 min at 100°C. The SDS-PAGE was run at 120 V until the dye reached the bottom of the separation gel, and the proteins were then transferred to a polyvinylidene fluoride (PVDF) membrane using wet electroblotting at 120 V for 2 h. The membrane was blocked with 5% skimmed milk powder for 2 h, washed thrice with Tris-buffered saline plus Tween-20 (TBST) for 15 min each time. This was followed by overnight incubation with primary antibodies against LC3 (ab48394; Abcam) and beclin1 (ab62472; Abcam) at 4°C. The membrane was rewarmed at room temperature for 1 h, washed thrice with TBST for 15 min each time, incubated with the secondary goat anti-rabbit antibody (ab136817; Abcam) for 2 h, and then washed thrice with TBST for 15 min each time. The images of the blots were acquired after visualization with electrochemiluminescence (ECL).
Quantitative polymerase chain reaction (qPCR)
Total RNA was extracted using the TRIzol (D9108A; Takara Bio, Dalian, China) reagent following the manufacturer's instructions. The ratio of absorbance optical density (OD) at 260 and 280 nm (OD260/280) of the extracted total RNA was determined using an ultraviolet spectrophotometer, and the quality and purity of the extracted total RNA were also evaluated. The RNA was reverse transcribed into cDNA according to the instructions of the reverse transcription (RT) kit (RR047A; Takara Bio) with reaction conditions of 37°C for 15 min, 85°C for 5 sec, and cooling to 4°C. The quality and purity of the cDNA were measured and then it was amplified using the 7500 Real-Time PCR system (Applied Biosystems Life Technologies, Foster City, CA, USA) according to the amplification kit instructions (RR420A; Takara Bio). The primers used were synthesized by Takara Bio, and the sequences are shown in Table II.
Table II.
The sequences of primers.
| Gene | Primers |
|---|---|
| β-actin | F-5′-GGAGATTACTGCCCTGGCTCCTA-3′ |
| R-5′-GACTCATCGTACTCCTGCTTGCTG-3′ | |
| LC3 | F-5′-AGCTCTGAAGGCAACAGCAACA-3′ |
| R-5′-GCTCCATGCAGGTAGCAGGAA-3′ | |
| Beclin1 | F-5′-TTGGCCAATAAGATGGGTCTGAA-3′ |
| R-5′-TGTCAGGGACTCCAGATACGAGTG-3′ |
F, forward; R, reverse.
Statistical analysis
All the data were analyzed using the statistical package for the social sciences (SPSS) 13.0 software (SPSS, Inc., Chicago, IL, USA). All the data are presented as the mean ± standard deviation. The means were compared using a one-way analysis of variance (ANOVA) and Student's t-test. P<0.05 was considered to indicate a statistically significant difference. All experiments were repeated at least three times.
Results
Gross findings
There were no evident intra-abdominal inflammatory changes in the control group of CLP model. In the experimental groups, rat intra-abdominal inflammatory changes were gradually evident over time. The lightest inflammatory changes occurred at 6 h when slight intra-abdominal ascites and congestive changes in the ileocecus were visible. There was a moderate amount of intra-abdominal ascites at 12 h when ileocecus congestion, high expansion of small intestine, inflatable jejunum, and partial necrosis of rat cecum were visible. There were numerous intra-abdominal ascites and even bloody ascites with an unpleasant odor at 24 h, when partial necrosis at the site of cecal ligation, high expansion of the entire small intestine, inflatable jejunum, and total abdominal adhesions were visible. The Simon intra-abdominal infection degree classification revealed a degree of grade 0 in the control group and between grade 3 and 4 in the sepsis group. There were no evident intra-abdominal inflammatory changes in the induced and control groups of the LPS model.
TEM
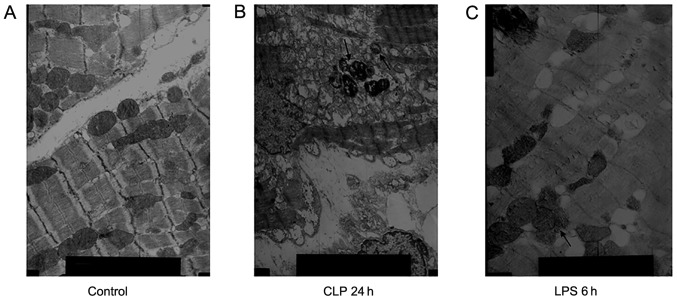
In the control group, myocardial fibers were neatly arranged and the Z line, M line, I band, and A band were clearly visible while there were more mitochondria between adjacent myocardial fibers. In the CLP 24 h group, the myocardial fibers were neatly arranged, locally fractured, and dissolved with a clearly visible Z line. The sarcomere differed in length, the myofilament space differed in width, and there were numerous mitochondria between the adjacent myocardial fibers. In addition, there was a decrease in the number of mitochondrial cristae, which showed vacuolated changes or outer-membrane damage, and autophagolysosomes were visible. In the LPS 6 h group, the myocardial fiber myofilaments showed partial expansion with a visible Z line, but the I and A bands were ill-defined, and the mitochondrial cristae or outer-membrane damage between adjacent myocardial fibers was decreased while autophagic vacuoles were visible (Fig. 1).
Figure 1.
Ultrastructural features of autophagic vacuoles. (A) In the control group, myocardial fibers were neatly arranged; magnification, ×8,000. (B) In the cecal ligation and puncture (CLP) 24 h group, autophagic vacuoles were visible; magnification, ×5,000. (C) In the lipopolysaccharide (LPS) 6 h group, autophagolysosomes were visible; magnification, ×8,000.
IHC
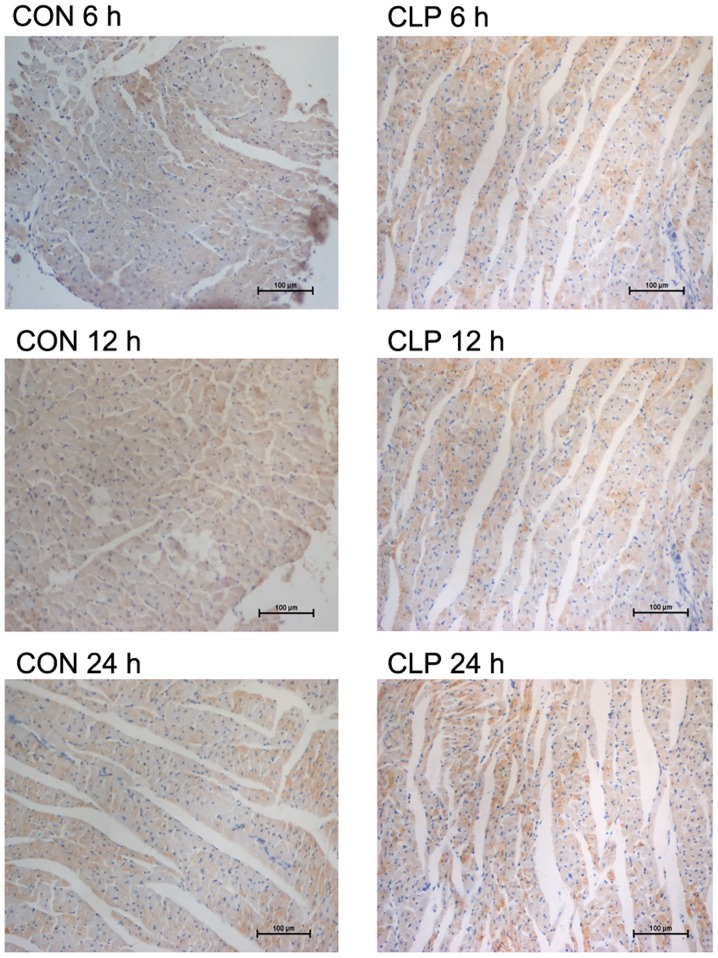
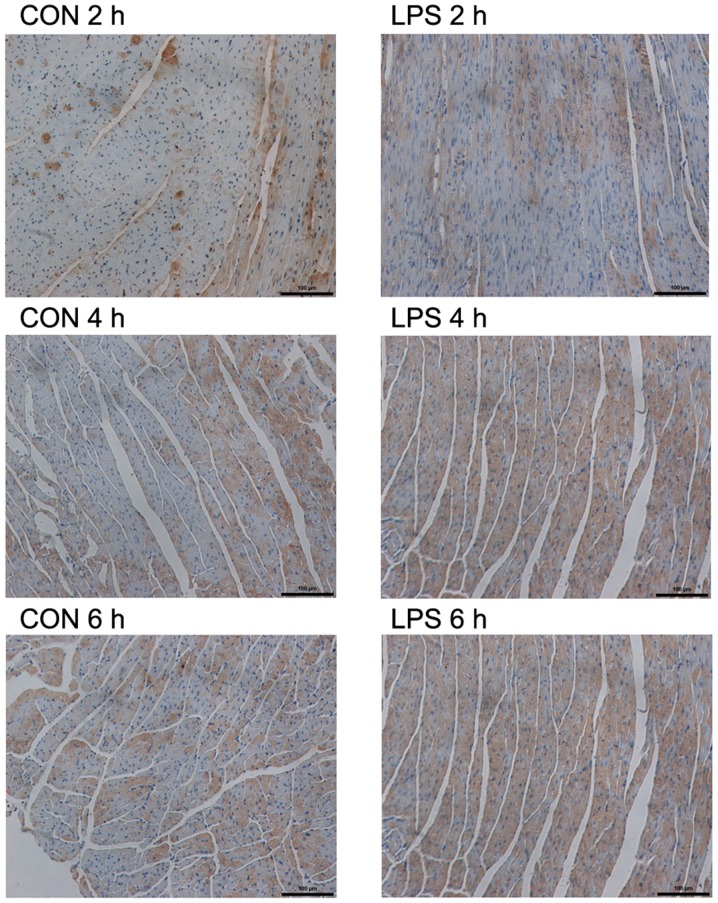
As observed microscopically, the LC3 staining in the two models was less in the respective control groups (Figs. 2 and 3). However, specific staining was visible in both experimental groups. The specific staining, which was obviously increased at 12 and 4 h in the CLP and LPS models, respectively, gradually increased with time. However, there was no obvious increase in the 24-h staining of the CLP model compared with that of the CLP model at 12 h. The results of the average OD assay for each group are shown in Table III.
Figure 2.
Immunohistochemistry features of autophagy-related light chain 3 protein (LC3) after cecal ligation and puncture (CLP) administration The LC3 protein was stained positive in cytoplasm; magnification, ×200. The results of the average optical density assay for each group are shown in Table III.
Figure 3.
Immunohistochemistry features of autophagy-related light chain 3 protein (LC3) after lipopolysaccharide (LPS) administration The LC3 protein was stained positive in cytoplasm; magnification, ×200. The results of the average optical density assay for each group are shown in Table III.
Table III.
The average optical density value of LC3 expression (mean ± standard deviation).
| Variables | CLP 6 h | CLP 12 h | CLP 24 h | LPS 2 h | LPS 4 h | LPS 6 h |
|---|---|---|---|---|---|---|
| Sepsis | 0.358±0.011a | 0.373±0.09a | 0.36±0.012a | 0.366±0.007a | 0.380±0.016a | 0.408±0.024a |
| Control | 0.3411±0.008 | 0.3427±0.06 | 0.3439±0.04 | 0.3451±0.016 | 0.3447±0.032 | 0.3447±0.005 |
P<0.05 vs. control group.
Western blot analysis
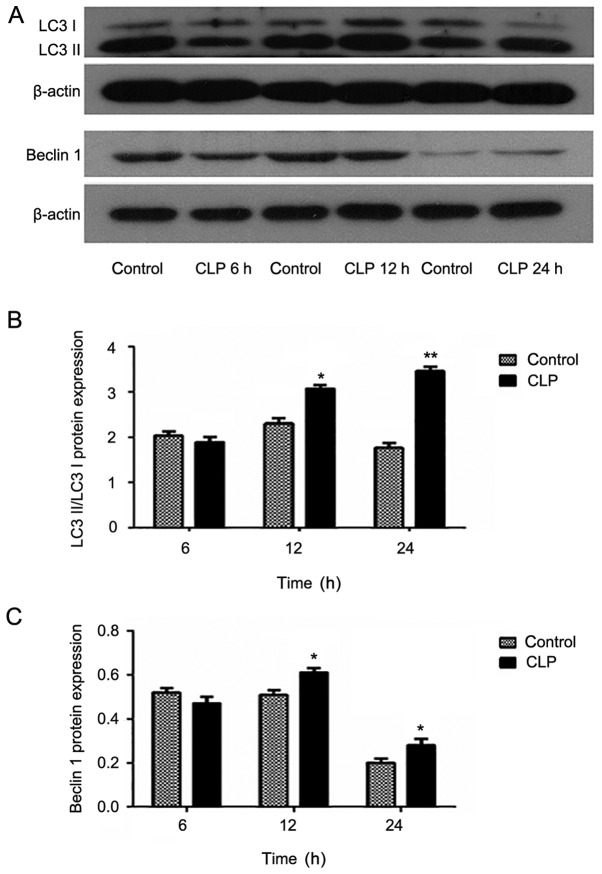
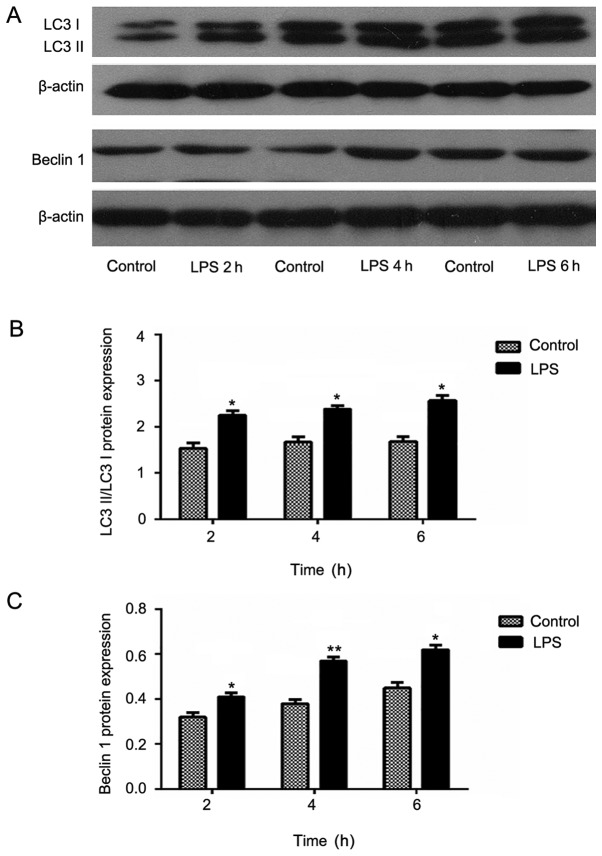
In the LPS model, expression of Beclin1 in the induced group was increased compared with that in the control group. Moreover, the Beclin1 expression appeared to increase gradually with increasing induction time. These data were evaluated using meta-analyses, which revealed statistically significant results (P<0.05). However, in the CLP model, no similar trend was observed. Moreover, the Beclin1 expression in the 6 h experimental group was lower than that in the control group was. Furthermore, although the Beclin1 expression in the 24 h experimental group was higher than that in the control group, it was lower than that in the 12 h group.
LC3, a structural protein of the autophagic vesicle membrane, is transformed from LC3-I to LC3-II when there is enhanced autophagy and an increased number of autophagosomes (17). In addition, the half-life of autophagosomes is extremely short at approximately only 8 min. Therefore the cell autophagic activity can be accurately determined by the ratio of LC3-II/lC3-I. The experimental results were similar to those obtained in the expression analysis of Beclin1. Specifically, in the LPS model groups, the expression in the experimental group increased compared with that of the control group and the inter-group comparison showed statistical significance. In the CLP model group, only the expression levels at 12 and 24 h were increased (Figs. 4 and 5).
Figure 4.
Protein expression levels of (A) autophagy-related light chain 3 protein (LC3) and Beclin1 after cecal ligation and puncture (CLP). Expression of (B and C) LC3 and Beclin1 in myocardial tissue at 6, 12 and 24 h after CLP evaluated by western blotting. Data are mean ± standard deviation for each group. *P<0.05 and **P<0.01 vs. control group.
Figure 5.
Protein expression levels of (A) autophagy-related light chain 3 protein (LC3) and Beclin1 after lipopolysaccharide (LPS) administration. Expressions of (B and C) LC3 and Beclin1 in myocardial tissue at 2, 4, and 6 h after LPS administration evaluated by western blotting. Data are mean ± standard deviation (SD) for each group. *P<0.05 and **P<0.01 vs. control group (B, C).
qPCR
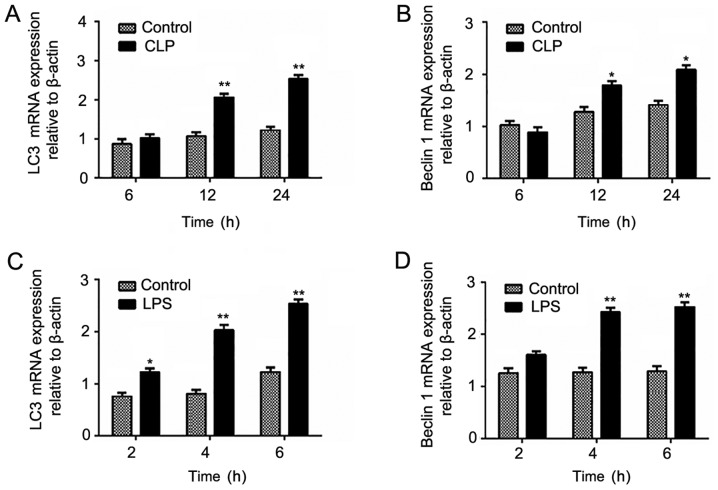
In the LPS model, the mRNA expression of LC3 and Beclin1 gradually increased with increasing model induction time and reached highest levels at 6 h, which was similar to the protein expression. However, in the CLP model, only the expression levels at 12 and 24 h in the experimental group were significantly higher than that in the control group was (Fig. 6).
Figure 6.
mRNA expression levels of autophagy-related light chain 3 protein (LC3) and Beclin1 after (A and B) cecal ligation and puncture (CLP) and (C and D) lipopolysaccharide (LPS) administration. Data are mean ± standard deviation (SD) for each group. *P<0.05 and **P<0.01 vs. control group.
Discussion
Currently, the role of autophagy in cardiovascular disease development is not entirely clear, especially in sepsis-induced myocardial injury, where cardiomyocyte autophagy is rarely reported. Our previous studies have demonstrated that myocardial damage occurring after septic shock decreased the cardiac function and induced or exacerbated shock. To further confirm the mechanism underlying this kind of myocardial damage, we conducted a detailed observation of cardiomyocyte autophagy in septic shock and provided a preliminary evaluation of the autophagy level under this specific condition. The experimental results showed that the autophagic activity in cardiomyocytes of rats of the two models investigated was significantly elevated and gradually increased as the model induction time increased.
During cell autophagy, the increasing number of autophagosomes results in an increase in the transformation of the vesicle membrane protein LC3 from a precursor protein into LC3-I and then subsequently into LC3-II. Therefore, the ratio of LC3-II/lC3-I continues to rise. Moreover, the total content of LC3 protein also continues to increase because LC3 precursor proteins are constantly synthesized during the process of autophagy enhancement (18,19). Our results also showed that with the rising ratio of LC3-II/lC3-I after sepsis shock, the total protein content of LC3 also increased.
Autophagy is considered by some investigators to play a protective or deleterious role in the different transduction pathways involving various cell signal molecules. For example, the molecular mechanisms of autophagy during ischemia and reperfusion in the model of myocardial ischemia and reperfusion were not the same (20–22). However, Lin et al (23) considered autophagy to play a protective role in sepsis-induced T lymphocyte apoptosis and immunosuppression. In a mice model of sepsis established by Lo et al (24), a moderate amount of autophagy was found to protect against sepsis-induced pulmonary dysfunction. However, in the late stage of sepsis, excessive autophagy might have an important role in the development of acute lung injury.
In conclusion, irrespective of the model type, the autophagic activities in cardiomyocytes during sepsis were enhanced and increased in the incipient stage after the model induction. However, this enhancement was unlikely to persist indefinitely. At the end stage of the experiment, the decline in the physiological functions of the experimental animals caused an inevitable decline in the autophagic activities. In our opinion, this could be mainly responsible for the low expression levels of Beclin 1 and LC3 in the 24 h groups. However, it is still unclear whether the enhancement of autophagy has a protective role or lethal effect, and its mechanism needs to be further explored.
The CLP and LPS models as two of the most commonly used models of septic shock have their distinct characteristics. In the LPS model, septic shock can be achieved within a short time (4 to 6 h) in a simple manner and with a low mortality rate, which is effective for studying the functional changes at the late stage of sepsis shock and its mechanism. However, because the LPS model is established using a single inducing factor, the actual clinical conditions cannot be adequately simulated. Endotoxin was not considered the leading cause of sepsis by Postel et al (25). Van der Poll and Meijers (26) considered LPS to cause systemic inflammatory response syndrome mainly by the excessive release of inflammatory mediators, which leads to shock and even multiple organ dysfunction syndrome. And the demand for continuously invasive monitoring of the LPS and the respective control subjects will also have a significant influence on the experimental outcome. Therefore, the reliability of using the LPS-induced animal model to simulate the course of septic shock and conduct related therapeutic research remains to be further explored.
The CLP model has characteristics that are close to actual clinical septic shock, so it may have a greater application for investigating the inhibition of cardiac function caused by CLP-induced septic shock. However, the mortality rate of the CLP model is higher than that of the LPS model. It takes a long time to achieve the septic shock stage, and a long-term monitoring requires high anesthesia level in the animals. In a study of the rat CLP model, Ye et al (27) showed ventricular dynamics changes that were consistent with those occurring clinically in patients who present with an increase in dynamic indicators in the early days and a decrease during the later period. Furthermore, there was a transformation from a high to a low power period between the early and late stages. During the disease progression, the transformation periods for different individuals occur at different times and, therefore, it is still quite difficult to decide when the low power period occurs.
In the present study, the changes in the early autophagic activity of the CLP model were not evident. Although the autophagic activity was obviously enhanced at 12 h postoperatively, no regular trend of enhancement was observed. This may be due to the intervention factors used in the experiment, which have highly varying effects including the induction of converse effects in the experiment, leading to reduced autophagic activities. In a study of CLP-induced sepsis in the hippocampus by Su et al (28), the LC3 level was obviously higher in the model group than it was in the control group. However, the Beclin 1 level was only significantly elevated in the 6 h group and gradually reduced after 12 h. Although the actual clinical conditions of sepsis were not adequately simulated in the LPS model, the obviously higher variation in trend is precisely attributable to its single factor. Overall, the LPS sepsis model is better for investigating basic mechanisms than the CLP sepsis model, which may be more suitable for guiding translational and clinical research.
Acknowledgements
This study was supported by the National Natural Science Foundation of China (no. 81372039) and the Liaoning Science and Technology Department of China (Project Grant no. 2014225017).
References
- 1.Dombrovskiy VY, Martin AA, Sunderram J, Paz HL. Rapid increase in hospitalization and mortality rates for severe sepsis in the United States: A trend analysis from 1993 to 2003. Crit Care Med. 2007;35:1244–1250. doi: 10.1097/01.CCM.0000261890.41311.E9. [DOI] [PubMed] [Google Scholar]
- 2.Zanotti-Cavazzoni SL, Hollenberg SM. Cardiac dysfunction in severe sepsis and septic shock. Curr Opin Crit Care. 2009;15:392–397. doi: 10.1097/MCC.0b013e3283307a4e. [DOI] [PubMed] [Google Scholar]
- 3.Bougaki M, Searles RJ, Kida K, Yu J, Buys ES, Ichinose F. Nos3 protects against systemic inflammation and myocardial dysfunction in murine polymicrobial sepsis. Shock. 2010;34:281–290. doi: 10.1097/SHK.0b013e3181cdc327. [DOI] [PMC free article] [PubMed] [Google Scholar]
- 4.Levy RJ, Piel DA, Acton PD, Zhou R, Ferrari VA, Karp JS, Deutschman CS. Evidence of myocardial hibernation in the septic heart. Crit Care Med. 2005;33:2752–2756. doi: 10.1097/01.CCM.0000189943.60945.77. [DOI] [PubMed] [Google Scholar]
- 5.Ichinose F, Hataishi R, Wu JC, Kawai N, Rodrigues AC, Mallari C, Post JM, Parkinson JF, Picard MH, Bloch KD, Zapol WM. A selective inducible NOS dimerization inhibitor prevents systemic, cardiac, and pulmonary hemodynamic dysfunction in endotoxemic mice. Am J Physiol Heart Circ Physiol. 2003;285:H2524–H2530. doi: 10.1152/ajpheart.00530.2003. [DOI] [PubMed] [Google Scholar]
- 6.Hwang TL, Yeh CC. Hemodynamic and hepatic microcirculational changes in endotoxemic rats treated with different NOS inhibitors. Hepatogastroenterology. 2003;50:188–191. [PubMed] [Google Scholar]
- 7.Elahi M, Asopa S, Matata B. NO-cGMP and TNF-alpha counter regulatory system in blood: Understanding the mechanisms leading to myocardial dysfunction and failure. Biochim Biophys Acta. 2007;1772:5–14. doi: 10.1016/j.bbadis.2006.09.002. [DOI] [PubMed] [Google Scholar]
- 8.Fischmeister R, Castro L, Abi-Gerges A, Rochais F, Vandecasteele G. Species- and tissue-dependent effects of NO and cyclic GMP on cardiac ion channels. Comp Biochem Physiol A Mol Integr Physiol. 2005;142:136–143. doi: 10.1016/j.cbpb.2005.04.012. [DOI] [PubMed] [Google Scholar]
- 9.Coldewey SM, Thiemermann C. Pleiotropic effects of atorvastatin in experimental sepsis: Preservation of β1-adrenoreceptor signaling in the heart. Shock. 2014;41:458–459. doi: 10.1097/SHK.0000000000000154. [DOI] [PubMed] [Google Scholar]
- 10.Hehlgans T, Pfeffer K. The intriguing biology of the tumour necrosis factor/tumour necrosis factor receptor superfamily: Players, rules and the games. Immunology. 2005;115:1–20. doi: 10.1111/j.1365-2567.2005.02143.x. [DOI] [PMC free article] [PubMed] [Google Scholar]
- 11.Maekawa N, Wada H, Kanda T, Niwa T, Yamada Y, Saito K, Fujiwara H, Sekikawa K, Seishima M. Improved myocardial ischemia/reperfusion injury in mice lacking tumor necrosis factor-alpha. J Am Coll Cardiol. 2002;39:1229–1235. doi: 10.1016/S0735-1097(02)01738-2. [DOI] [PubMed] [Google Scholar]
- 12.Rameshrad M, Maleki-Dizaji N, Vaez H, Soraya H, Nakhlband A, Garjani A. Lipopolysaccharide induced activation of toll like receptor 4 in isolated rat heart suggests a local immune response in myocardium. Iran J Immunol. 2015;12:104–116. [PubMed] [Google Scholar]
- 13.Rossi MA, Santos CS. Sepsis-related microvascular myocardial damage with giant cell inflammation and calcification. Virchows Arch. 2003;443:87–92. doi: 10.1007/s00428-003-0816-0. [DOI] [PubMed] [Google Scholar]
- 14.Mink SN, Jacobs H, Bose D, Duke K, Cheng ZQ, Liu G, Light RB. Lysozyme: A mediator of myocardial depression and adrenergic dysfunction in septic shock in dogs. J Mol Cell Cardiol. 2003;35:265–275. doi: 10.1016/S0022-2828(03)00004-X. [DOI] [PubMed] [Google Scholar]
- 15.Levine B, Klionsky DJ. Development by self-digestion: Molecular mechanisms and biological functions of autophagy. Dev Cell. 2004;6:463–477. doi: 10.1016/S1534-5807(04)00099-1. [DOI] [PubMed] [Google Scholar]
- 16.Bandyopadhyay U, Kaushik S, Varticovski L, Cuervo AM. The chaperone-mediated autophagy receptor organizes in dynamic protein complexes at the lysosomal membrane. Mol Cell Biol. 2008;28:5747–5763. doi: 10.1128/MCB.02070-07. [DOI] [PMC free article] [PubMed] [Google Scholar]
- 17.Kabeya Y, Mizushima N, Ueno T, Yamamoto A, Kirisako T, Noda T, Kominami E, Ohsumi Y, Yoshimori T. LC3, a mammalian homologue of yeast Apg8p, is localized in autophagosome membranes after processing. EMBO J. 2000;19:5720–5728. doi: 10.1093/emboj/19.21.5720. [DOI] [PMC free article] [PubMed] [Google Scholar]
- 18.Mizushima N, Yoshimori T. How to interpret LC3 immunoblotting. Autophagy. 2007;3:542–545. doi: 10.4161/auto.4600. [DOI] [PubMed] [Google Scholar]
- 19.Dong Y, Undyala VV, Gottlieb RA, Mentzer RM, Jr, Przyklenk K. Autophagy: Definition, molecular machinery, and potential role in myocardial ischemia-reperfusion injury. J Cardiovasc Pharmacol Ther. 2010;15:220–230. doi: 10.1177/1074248410370327. [DOI] [PubMed] [Google Scholar]
- 20.Jin Y, Wang H, Cui X, Jin Y, Xu Z. Role of autophagy in myocardial reperfusion injury. Front Biosci (Elite Ed) 2010;2:1147–1153. doi: 10.2741/e174. [DOI] [PubMed] [Google Scholar]
- 21.Matsui Y, Takagi H, Qu X, Abdellatif M, Sakoda H, Asano T, Levine B, Sadoshima J. Distinct roles of autophagy in the heart during ischemia and reperfusion: Roles of AMP-activated protein kinase and Beclin 1 in mediating autophagy. Circ Res. 2007;100:914–922. doi: 10.1161/01.RES.0000261924.76669.36. [DOI] [PubMed] [Google Scholar]
- 22.Matsui Y, Kyoi S, Takagi H, Hsu CP, Hariharan N, Ago T, Vatner SF, Sadoshima J. Molecular mechanisms and physiological significance of autophagy during myocardial ischemia and reperfusion. Autophagy. 2008;4:409–415. doi: 10.4161/auto.5638. [DOI] [PMC free article] [PubMed] [Google Scholar]
- 23.Lin CW, Lo S, Hsu C, Hsieh CH, Chang YF, Hou BS, Kao YH, Lin CC, Yu ML, Yuan SS, Hsieh YC. T-cell autophagy deficiency increases mortality and suppresses immune responses after sepsis. PLoS One. 2014;9:e102066. doi: 10.1371/journal.pone.0102066. [DOI] [PMC free article] [PubMed] [Google Scholar]
- 24.Lo S, Yuan SS, Hsu C, Cheng YJ, Chang YF, Hsueh HW, Lee PH, Hsieh YC. Lc3 over-expression improves survival and attenuates lung injury through increasing autophagosomal clearance in septic mice. Ann Surg. 2013;257:352–363. doi: 10.1097/SLA.0b013e318269d0e2. [DOI] [PubMed] [Google Scholar]
- 25.Postel J, Schloerb PR, Furtado D. Pathophysiologic alterations during bacterial infusions for the study of bacteremic shock. Surg Gynecol Obstet. 1975;141:683–692. [PubMed] [Google Scholar]
- 26.van der Poll T, Meijers JC. Systemic inflammatory response syndrome and compensatory anti-inflammatory response syndrome in sepsis. J Innate Immun. 2010;2:379–380. doi: 10.1159/000318190. [DOI] [PubMed] [Google Scholar]
- 27.Ye TM, Xu C, Gao Q, Zhou XM, Shan QX, Xia Q. The alterations of nitric oxide synthase activity of ventricular cardiac muscle of rats in two septic shock models. Zhongguo Ying Yong Sheng Li Xue Za Zhi. 2007;23:194–198. (In Chinese) [PubMed] [Google Scholar]
- 28.Su Y, Qu Y, Zhao F, Li H, Mu D, Li X. Regulation of autophagy by the nuclear factor κB signaling pathway in the hippocampus of rats with sepsis. J Neuroinflammation. 2015;12:116. doi: 10.1186/s12974-015-0336-2. [DOI] [PMC free article] [PubMed] [Google Scholar] [Retracted]


