

Abstract
The present study aimed to investigate the impacts of telmisartan (TEL) on hepatic fibrosis, serum leptin, leptin protein in liver tissue and its mRNA expression level in rats with non-alcoholic fatty liver disease (NAFLD). Male Sprague Dawley rats were randomly divided into the control (N), model (M), polyene phosphatidylcholine (P) and TEL (T) groups. Group M and the intervention groups were given a high-fat diet for 12 weeks to induce NAFLD, followed by 4 weeks of intragastric administration of normal saline (1.0 ml/kg/day), polyene phosphatidylcholine (PPC; 123.1 mg/kg/day) and TEL (8 mg/kg/day). The liver tissue was then assessed for the NAFLD activity score and fibrosis score (FS), and serum biochemistry and leptin levels were determined. Additionally, leptin protein expression levels were examined by western blotting and the expression of leptin mRNA was investigated by reverse transcription-polymerase chain reaction. TEL significantly improved FS in rats (P<0.01) and was more effective than PPC. TEL significantly reduced the expression of serum leptin, as well as the expression levels of leptin protein and its mRNA in liver tissue (P<0.01); however, the effects of PPC were not significant (P>0.05). TEL reduced serum leptin, leptin protein and its mRNA in the liver tissue of NAFLD rats, and improved the pathological indicators of liver fibrosis.
Keywords: non-alcoholic fatty liver disease, liver fibrosis, leptin, telmisartan
Introduction
Non-alcoholic fatty liver disease (NAFLD) is currently one of the world's major public health problems (1), and its pathological processes include non-alcoholic fatty liver, steatohepatitis and cirrhosis (2). NAFLD is the most common cause of abnormal liver function and chronic liver disease in Europe and other western countries, with the average prevalence rate in adults ranging from 20–33% (3,4). In the past 20 years, the prevalence of NAFLD in Asian countries has grown rapidly and demonstrated a trend towards onset in younger generations (1). In China, the prevalence rates of NAFLD in adults in Shanghai and Guangzhou are ~15% (1). The disease may develop into liver fibrosis and cirrhosis; however, its pathogenesis is not clear (3), and effective prevention and treatment techniques are lacking. During the development of NAFLD, hepatic fibrosis may be a pathological pathway through which steatohepatitis develops toward cirrhosis (5,6), thus active treatment at this stage could stabilize or improve the disease conditions to some extent.
Telmisartan (TEL) is a angiotensin II receptor blocker (ARB), and it may also activate the peroxisome proliferator-activated receptor γ (PPARγ) (7). In recent years, TEL has been reported to participate in protecting against NAFLD by regulating the expression of a variety of factors (8–11). Leptin is an independence flag that could mark the progression and severity of NAFLD, and is closely related to liver lipid metabolism, steatosis, inflammation and fibrosis (12,13). However, the impacts of TEL on leptin resistance and hepatic fibrosis have been rarely reported. Therefore, the present study investigated the impacts of TEL on leptin expression and hepatic fibrosis in a rat model of NAFLD.
Materials and methods
Animal grouping and model preparation
A total of 45 male Sprague Dawley rats (age, 6 weeks; weight, 200±20 g) were purchased from and raised in the Experimental Animal Center of the Institute of Radiation Medicine, Chinese Academy of Medical Science (Tianjin, China). The rats were maintained under standard conditions of temperature (22±2°C) and humidity (55±5%) in a 12-h light/dark cycleand given ad libitum access to food and water. After 1 week of acclimatization, they were randomly divided into groups N (n=10), M (n=15) and intervention (n=20). Group N was fed with a normal diet for 12 weeks, followed by 4-week intragastric administration of saline (1.0 ml/kg/day) and continuous normal diet feeding. Group M and the intervention group (including group P and T) were fed a high-fat diet (88% of normal diet, plus 2% of cholesterol and 10% of lard) for 12 weeks for NAFLD modeling. After the 12 weeks, 5 rats were randomly selected to confirm the successful modeling by liver histopathological examination, and the other 10 rats were subsequently intragastrically administered with 1.0 ml/kg/day saline for 4 weeks alongside a high-fat diet. The intervention group was then randomly divided into groups P (n=10) and T (n=10), and rats were intragastrically administered with polyene phosphatidylcholine (PPC; 123.1 mg/kg/day; Sanofi S.A., Paris, France) and TEL (8 mg/kg/day; Boehringer Ingelheim Pharma GmbH, Ingellheim, Germany) for 4 weeks, respectively. The present study was conducted in strict accordance with the recommendations in the Guide for the Care and Use of Laboratory Animals of the National Institutes of Health. The animal use protocol was reviewed and approved by the Institutional Animal Care and Use Committee of Tianjin Medical University Fourth Central Clinical College (Tianjin, China).
Serological indexes
After 16 weeks, all rats were fasted, with access to water ad libitum, for 12 h. Following this, the rats were anesthetized via an intraperitoneal injection of 0.3% sodium pentobarbital (40 mg/kg; Sigma-Aldrich; Merck KgaA, Darmstadt, Germany) and a sample of blood was collected from the femoral artery before the rats were sacrificed. An automatic biochemical analyzer (Beckman Coulter, Inc., Brea, CA, USA) was used to analyze the contents of alanine aminotransferase (ALT), aspartate aminotransferase (AST), triglyceride (TG) and total cholesterol (TC). Serum levels of tumor necrosis factor α (TNF-α) and leptin were detected using ELISA kits (ELR-TNFα-001 and ELR-Leptin-001; RayBiotech, Inc., Norcross, GA, USA), according to the manufacturer's instructions.
Liver histopathological observation
Following fixation in 4% neutral formalin at 4°C overnight, the liver tissue was prepared into 5 µm liver pathological sections on a microtome (RM2235; Leica Microsystems GmbH, Wetzlar, Germany). Sections were stained with hematoxylin and eosin, Masson's trichrome stain and reticular fiber 3-color staining and observed using a light microscope. The sections were then routinely analyzed for NAFLD activity score (NAS) and fibrosis score (FS) using the modified Chevallier semi-quantitative scoring system (14). The liver tissue was then stored at −80°C until further experiments to detect the expression leptin protein and its mRNA.
Determination of liver leptin protein levels
Detection of liver leptin protein expression was performed according to the KeyGen Whole Cell Lysis assay kit manufacturer's instructions (Nanjing KeyGen Biotech Co., Ltd., Nanjing, China). The supernatant of liver tissue proteins was used to quantitatively detect the protein levels. Protein samples (50 µg) were separated by 4–5% SDS-PAGE and transferred onto one nitrocellulose membrane. Following 5% dried skimmed milk blocking at room temperature for 1.5–2 h, the membrane was washed three times with TBST (10 min each) and 200 µl leptin goat anti-mouse polyclonal primary antibody (sc-471278; Santa Cruz Biotechnology, Inc., Dallas, TX, USA; dilution 1:500) was added for overnight incubation at 4°C. Subsequently, the membrane was washed three times with TBST (10 min each) and horseradish peroxidase-conjugated rabbit anti-goat immunoglobulin G secondary antibody (KGAA38; dilution 1:2,000; Nanjing KeyGen Biotech Co., Ltd.) was added for 1–2 h at room temperature. The membrane was then washed three times with TBST (10 min each), followed by exposure, processing and scanning on a gel imaging analysis system (Syngene G: BOXChemiXR5; Syngene International, Bangalore, India). Gel-Pro32 software (Media Cybernetics, Inc., Rockville, MD, USA) was used to digitally analyze the strip gray values for semi-quantitative detection.
Detection of liver leptin mRNA
Total RNA was extracted from rat liver tissue samples using TRIzol reagent (CW0581; CW Bio Co., Ltd., Beijing, China). Total RNA (1 µg) was then reverse transcribed into cDNA using the HiFi-MMLV First Strand cDNA Synthesis kit (CW0744; CW Bio Co., Ltd.), according to the manufacturer's instructions. Quantitative PCR was performed using specific primers (10 µmol/l; Sangon Biotech Co., Ltd., Shanghai, China) and UltraSYBR Mixture Taq kit (CW0596; CW Bio Co., Ltd., Beijing, China) with an ABI 7500 Real-time PCR system (Applied Biosystems; Thermo Fisher Scientific, Inc., Waltham, MA, USA). The sequences of the primers were as follows: Leptin forward, 5′-CAGGATCAATGACATTTCACACA-3′ and reverse, 5′-GCTGGTGAGGACCTGTTGAT-3′; GAPDH forward, 5′-TCCACTCATGGCAAATTCAA-3′ and reverse, 5′-TTTGATGTTAGTGGGGTCTCG-3′. Quantitative PCR was performed with the following cycle conditions: Initial step (95°C for 10 min), 40 cycles of denaturation (95°C for 15 sec), annealing (60°C for 60 sec) and extension (72°C for 60 sec). The mRNA expression levels of leptin were assessed using the 2−ΔΔCq method (15), relative to GAPDH mRNA levels.
Statistical analysis
SPSS 17.0 software (SPSS, Inc., Chicago, IL, USA) was used for all statistical analyses. Measurement data were expressed as the mean ± standard error of the mean and one-way analysis of variance was used for data comparison among multiple groups, followed by intergroup comparisons using Fisher's least significant difference method. Data comparisons between two groups were made using Student's t-tests. P<0.05 was considered to indicate a statistically significant difference.
Results
Liver histopathological observations
The liver tissue in group N was demonstrated to be normal. Group M exhibited severe hepatic steatosis, balloon-like changes and intra-lobular inflammatory cell infiltration. Furthermore, the liver cells exhibited degeneration, necrosis or even partial necrotic parts integrating into bridging necrosis and focal sinus fibrosis (Fig. 1). NAS and FS were significantly higher in group M than in group N (P<0.01; Table I). The above histopathological changes in group P and T were improved to a certain extent compared with those in group M. Compared with group M, intra-lobular inflammation (P<0.01), NAS (P<0.01) and FS (P<0.05) in group P were improved significantly, and fatty degeneration (P<0.05), intra-lobular inflammation (P<0.01), balloon-like changes (P<0.01), NAS (P<0.01) and FS (P<0.01) in group T were improved significantly (Table I).
Figure 1.

Pathological performance of liver tissue in the various experimental groups. (A) H&E staining (magnification, ×200), (B) Masson staining (magnification, ×400) and (C) reticular fiber staining (magnification, ×400) of liver tissue from the control group. (D) H&E staining (magnification, ×200), (E) Masson staining (magnification, ×400) and (F) reticular fiber staining (magnification, ×400) of liver tissue from the model group. (G) H&E staining (magnification, ×200), (H) Masson staining (magnification, ×400) and (I) reticular fiber staining (magnification, ×400) of liver tissue from the polyene phosphatidylcholine treatment group. (J) H&E staining (magnification, ×200), (K) Masson staining (magnification, ×400) and (L) reticular fiber staining (magnification, ×400) of liver tissue from the telmisartan treatment group. H&E, hematoxylin and eosin.
Table I.
NAS and liver tissue fibrosis scores.
| Group | Fatty degeneration | Intra-lobular inflammation | Balloon-like changes | NAS | FS |
|---|---|---|---|---|---|
| N | 0 | 0.31±0.48 | 0.12±0.32 | 0.43±0.52 | 0 |
| M | 2.89±0.32 | 2.83±0.42a | 2.00±0.56a | 7.72±0.48a | 11.25±2.12a |
| P | 2.62±0.52 | 1.43±0.71b | 1.68±0.48 | 5.73±0.50b | 9.11±2.03c |
| T | 2.41±0.75c | 1.37±0.78b | 1.16±0.87b | 4.94±1.45b | 7.38±1.69b,d |
Data are presented as the mean ± standard error of the mean (n=10).
P<0.01 vs. N
P<0.01
P<0.05 vs. M
P<0.05 vs. P. N, control group; M, model group; P, polyene phosphatidylcholine treatment group; T, telmisartan treatment group; NAS, non-alcoholic fatty liver disease activity score; FS, fibrosis score.
Serum TNF-α and biochemical indexes
The serum values of ALT, AST, TG and TC in group M were significantly higher than group N (P<0.01; Table II). TEL and PPC significantly reduced the levels of ALT and AST in rats with NAFLD (P<0.01), and PPC demonstrated greater reductions to these levels; however, PPC and TEL could not reduce blood lipids in NAFLD rats (P>0.05). The TNF-α level in group M was significantly higher than that of group N (P<0.01), and those in group P and T were significantly lower than group M (P<0.01). Group P demonstrated a significantly greater reduction in the level of TNF-α than group T (P<0.05; Table II).
Table II.
Comparison of TNF-α and biochemical parameters among the various treatment groups.
| Group | ALT, U/l | AST, U/l | TG, mmol/l | TC, mmol/l | TNF-α, ng/ml |
|---|---|---|---|---|---|
| N | 40.8±8.74 | 93.2±12.11 | 0.60±0.17 | 1.33±0.24 | 1.46±0.45 |
| M | 112.1±23.40a | 248.2±24.77a | 0.78±0.21a | 2.52±0.13a | 4.33±1.30a |
| P | 74.3±14.64b | 120.7±11.88b | 0.66±0.11 | 2.32±0.31 | 2.50±0.50b |
| T | 87.0±12.05b | 154.3±24.87b,c | 0.71±0.12 | 2.42±0.15 | 3.16±0.35b,d |
Data are presented as the mean ± standard error of the mean (n=10).
P<0.01 vs. N
P<0.01 vs. M
P<0.01
P<0.05 vs. P. N, control group; M, model group; P, polyene phosphatidylcholine treatment group; T, telmisartan treatment group; TNF-α, tumor necrosis factor α; ALT, alanine aminotransferase; AST, aspartate aminotransferase; TG, triglyceride; TC, total cholesterol.
Serum leptin
The serum leptin level in group M was significantly higher than group N, and the difference was statistically significant (P<0.01). The serum levels of leptin in group P and T were decreased compared with group M to different extents, with the difference between group T and M being statistically significant (P<0.01), while that between group P and M was not (P>0.05; Table III).
Table III.
Comparison of serum leptin, leptin protein and its mRNA in liver tissues among the various treatment groups.
| Group | Serum leptin, ng/ml | Leptin mRNA in liver tissue | Leptin protein in liver tissue |
|---|---|---|---|
| N | 4.15±0.95 | 1.03±0.1 | 0.06±0.02 |
| M | 10.68±2.69a | 1.63±0.30a | 1.12±0.21a |
| P | 9.63±1.95 | 1.53±0.33 | 1.01±0.18 |
| T | 8.12±1.23b | 1.30±0.17b,c | 0.10±0.01b,d |
Data are presented as the mean ± standard error of the mean (n=10). Leptin mRNA and protein and levels are relative to GAPDH.
P<0.01, vs. N
P<0.01 vs. M
P<0.05
P<0.01 vs. P. N, control group; M, model group; P, polyene phosphatidylcholine treatment group; T, telmisartan treatment group.
Levels of leptin protein
The level of leptin protein in group M was significantly higher than group N (P<0.01). The levels of leptin protein in group P and T were decreased compared with group M to different extents, with the difference between group T and M being statistically significant (P<0.01), while that between group P and M was not (P>0.05; Table III; Fig. 2).
Figure 2.
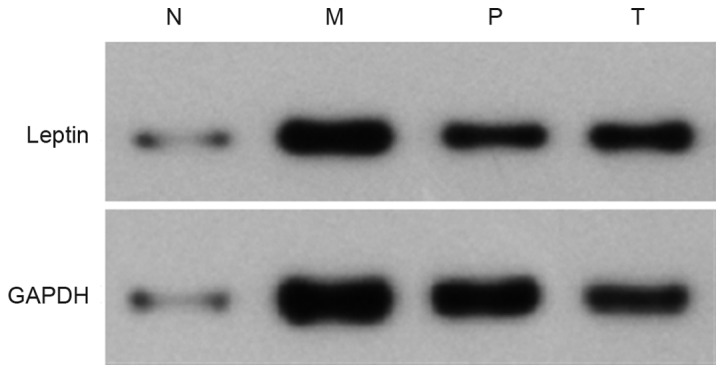
Expression of leptin protein in liver tissue of rats with non-alcoholic fatty liver disease. N, control group; M, model group; P, polyene phosphatidylcholine treatment group; T, telmisartan treatment group.
Leptin mRNA
The leptin mRNA level in group M was significantly higher than group N (P<0.01). The levels of leptin mRNA in group P and T were decreased compared with group M to different extents, with the difference between group T and M being statistically significant (P<0.01), while that between group P and M was not (P>0.05; Table III; Fig. 3).
Figure 3.
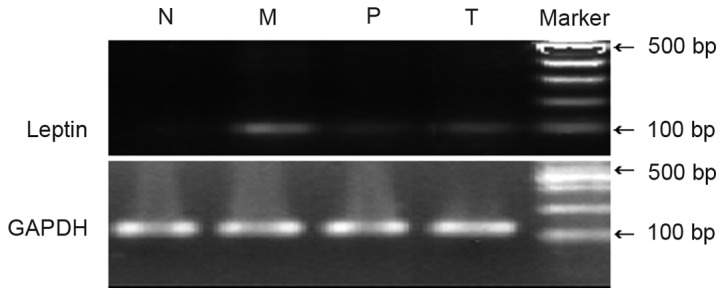
Expression of leptin mRNA in liver tissue of rats with non-alcoholic fatty liver disease. N, control group; M, model group; P, polyene phosphatidylcholine treatment group; T, telmisartan treatment group.
Discussion
NAFLD is a result of metabolic syndrome in the liver, and its pathological processes include non-alcoholic fatty liver, steatohepatitis and cirrhosis (2). Liver fibrosis is a common final pathway of chronic liver disease, characterized by chronic liver injuries and the accumulation of extracellular matrix (ECM) proteins, which is often accompanied by liver functional abnormalities and liver structural changes (16). Active treatments at this stage could stabilize or improve the disease conditions to a certain extent, while continuous development of the disease could lead to irreversible cirrhosis or liver cancer (17). Therefore, blocking the development of liver fibrosis is very important to prevent the occurrence and development of NAFLD.
Liver fibrosis is complex and involves a series of processes, such as the death of liver cells, actions of cytokines and ECM deposition (16). The activation and proliferation of hepatic stellate cells (HSCs), as well as the large amounts of ECM produced, are key processes in the development of liver fibrosis (18). Transforming growth factor β1 (TGF-β1) is the most important pro-fibrosis initiating factor, and the activation of HSCs by TGF-β1 is a central process contributing to the induction of hepatic fibrosis (19,20). Leptin is a peptide hormone secreted by human adipose tissue and has important roles in regulating the body's energy homeostasis, and is particularly closely related to the occurrence, development and prognosis of a fatty liver (21). Leptin aggravates hepatic insulin resistance, and promotes inflammation and fibrosis in the occurrence and development of NAFLD (22,23). After combining with leptin receptors, leptin activates corresponding signaling molecules in HSCs. Subsequently, under the influence of some transcription factors, leptin may transduce these signals into the nuclei, thus promoting the sinus endothelial cells and Kupffer cells to express TGF-β1, as well as further mediating and inducing the activation of HSCs (24). The HSCs then proliferate and transform into myofibroblasts, thus synthesizing and secreting a large amount of ECM (24). In liver fibrosis, the signal transduction mechanism of leptin is predominantly involved in the Janus kinase (JAK)-signal transducer and activator of transcription (STAT) pathway, related to the phosphorylation of JAK2 and STAT3 (25–27). While not totally dependent on this pathway, the activated JAKs could activate other pathways, such as the Ras-Raf-mitogen-activated protein kinase kinase-mitogen-activated protein and phosphoinositide 3-kinase/protein kinase B pathways, as well as transcription factors, including nuclear factor-κB and activator protein 1, so as to induce hepatic fibrosis (28).
The present study demonstrated that the serum level of leptin, leptin protein level and its mRNA expression level in liver cells in group M were significantly higher than those in group N. Thus, the findings supported the view that leptin participated in the onset of nonalcoholic steatohepatitis (NASH), and exacerbated liver fibrosis.
TEL is the only ARB drug that is able to activate the functions of PPARγ, thus having important roles in regulating glucose and lipid metabolism (29). Clinical trials have demonstrated that TEL may improve insulin resistance in patients with metabolic syndrome and significantly upregulate the expression of serum adiponectin and its mRNA in patients with type 2 diabetes mellitus (30). TEL may also improve the insulin resistance and histologic performance in patients with NASH (10). Animal studies have indicated that TEL may reduce macrophage infiltration and fat accumulation, thus having protective roles against NASH (31). Our previous studies also demonstrated that TEL was able to reduce the expression of resistin so as to improve insulin resistance and have therapeutic effects against NASH (32). A study by Alam et al (33) used randomized controlled clinical trials and significant improvements in histology and fibrosis in NASH patients 1 year after TEL treatment were observed. A study by Jin et al (34) also reported that TEL could inhibit the activation of HSCs. Following treatment with TEL, TGF-β1, tissue inhibitors of matrix metalloproteinases-1 (TIMP-1), TIMP-2 and matrix metalloproteinase-13 were significantly downregulated, and the pathological results demonstrated that the liver fibrosis score of the treatment group was significantly improved, suggesting that TEL may have the roles against hepatic fibrosis. Furthermore, a study by Nakagami et al (35) indicated that TEL may upregulate PPARγ and increase the production of hepatocyte growth factor, thus improving liver fibrosis in rats with NASH. The present study demonstrated that, although TEL could not significantly reduce the blood lipid levels in rats with NAFLD, it was able to reduce liver enzyme levels and serum TNF-α level in rats with NAFLD. Furthermore, TEL treatment significantly reduced the levels of serum leptin, leptin protein and its mRNA in the liver tissues of rats with NAFLD, thus improving NAS of liver tissue and pathological indexes of liver fibrosis.
In conclusion, TEL may reduce the TNF-α level in rats with NAFLD, reduce leptin resistance and improve the pathological indexes of liver fibrosis. The present study suggested that TEL may be a potential drug for the treatment of NAFLD; however, the exact mechanisms of how TEL induces its effects on NAFLD require further study.
Acknowledgements
The present study was funded by the Foundation of Tianjin Health and Family Planning Commission (grant no. 2012KR04).
References
- 1.Fan JG, Farrell GC. Epidemiology of nonalcoholic fatty liver disease in China. J Hepatol. 2009;50:204–210. doi: 10.1016/j.jhep.2008.10.010. [DOI] [PubMed] [Google Scholar]
- 2.European Association for the Study of the Liver (EASL); European Association for the Study of Diabetes (EASD); European Association for the Study of Obesity (EASO): EASL-EASD-EASO clinical practice guidelines for the management of non-alcoholic fatty liver disease. J Hepatol. 2016;64:1388–1402. doi: 10.1016/j.jhep.2015.11.004. [DOI] [PubMed] [Google Scholar]
- 3.Farrell GC, Larter CZ. Nonalcoholic fatty liver disease: From steatos is to cirrhosis. Hepatology. 2006;43:S99–S112. doi: 10.1002/hep.20973. (2 Suppl 1) [DOI] [PubMed] [Google Scholar]
- 4.de Alwis NM, Day CP. Nonalcoholic fatty liver disease: The mist gradually clears. J Hepatol. 2008;48:S104–S112. doi: 10.1016/j.jhep.2008.01.009. (Suppl 1) [DOI] [PubMed] [Google Scholar]
- 5.Teli MR, James OF, Burt AD, Bennett MK, Day CP. The natural history of nonalcoholic fatty liver: A follow-up study. Hepatology. 1995;22:1714–1719. doi: 10.1002/hep.1840220616. [DOI] [PubMed] [Google Scholar]
- 6.Calzadilla Bertot L, Adams LA. The natural course of non-alcoholic fatty liver disease. Int J Mol Sci. 2016;17 doi: 10.3390/ijms17050774. pii: E774. [DOI] [PMC free article] [PubMed] [Google Scholar]
- 7.Benson SC, Pershadsingh HA, Ho CI, Chittiboyina A, Desai P, Pravenec M, Qi N, Wang J, Avery MA, Kurtz TW. Identification of telmisartan as a unique angiotensin II receptor antagonist with selective PPARgamma-modulating activity. Hypertension. 2004;43:993–1002. doi: 10.1161/01.HYP.0000123072.34629.57. [DOI] [PubMed] [Google Scholar]
- 8.Sugimoto K, Qi NR, Kazdová L, Pravenec M, Ogihara T, Kurtz TW. Telmisartan but not valsartan increases caloric expenditure and protects against weight gain and hepatic steatosis. Hypertension. 2006;47:1003–1009. doi: 10.1161/01.HYP.0000215181.60228.f7. [DOI] [PubMed] [Google Scholar]
- 9.Yokohama S, Tokusashi Y, Nakamura K, Tamaki Y, Okamoto S, Okada M, Aso K, Hasegawa T, Aoshima M, Miyokawa N, et al. Inhibitory effect of angiotensin II receptor antagonist on hepatic stellate cell activation in non-alcoholic steatohepatitis. World J Gastroenterol. 2006;12:322–326. doi: 10.3748/wjg.v12.i2.322. [DOI] [PMC free article] [PubMed] [Google Scholar]
- 10.Georgescu EF, Ionescu R, Niculescu M, Mogoanta L, Vancica L. Angiotensin-receptor blockers as therapy for mild-to-moderate hypertension-associated non-alcoholic steatohepatitis. World J Gastroenterol. 2009;15:942–954. doi: 10.3748/wjg.15.942. [DOI] [PMC free article] [PubMed] [Google Scholar]
- 11.Kudo H, Yata Y, Takahara T, Kawai K, Nakayama Y, Kanayama M, Oya T, Morita S, Sasahara M, Mann DA, Sugiyama T. Telmisartan attenuates progression of steatohepatitis in mice: Role of hepatic macrophage infiltration and effects on adipose tissue. Liver Int. 2009;29:988–996. doi: 10.1111/j.1478-3231.2009.02006.x. [DOI] [PubMed] [Google Scholar]
- 12.Tilg H, Moschen AR. Evolution of inflammation in nonalcoholic fatty liver disease: The multiple parallel hits hypothesis. Hepatology. 2010;52:1836–1846. doi: 10.1002/hep.24001. [DOI] [PubMed] [Google Scholar]
- 13.Procaccini C, Galgani M, De Rosa V, Carbone F, La Rocca C, Ranucci G, Iorio R, Matarese G. Leptin: The prototypic adipocytokine and its role in NAFLD. Curr Pharm Des. 2010;16:1902–1912. doi: 10.2174/138161210791208884. [DOI] [PubMed] [Google Scholar]
- 14.Hepatic Fibrosis Study Group Of Chinese Liver Diseases Association: Consensus on evaluation of the diagnosis and efficacy of hepatic fibrosis. Zhonghua Gan Zang Bing Za Zhi. 2002;10:327–328. [PubMed] [Google Scholar]
- 15.Livak KJ, Schmittgen TD. Analysis of relative gene expression data using real-time quantitative PCR and the 2(−Delta Delta C(T)) Method. Methods. 2001;25:402–408. doi: 10.1006/meth.2001.1262. [DOI] [PubMed] [Google Scholar]
- 16.Ebrahimi H, Naderian M, Sohrabpour AA. New concepts on pathogenesis and diagnosis of liver fibrosis; a review article. Middle East J Dig Dis. 2016;8:166–178. doi: 10.15171/mejdd.2016.29. [DOI] [PMC free article] [PubMed] [Google Scholar]
- 17.Castera L. Non-invasive diagnosis of steatosis and fibrosis. Diabetes Metab. 2008;34:674–679. doi: 10.1016/S1262-3636(08)74603-2. [DOI] [PubMed] [Google Scholar]
- 18.Troeger JS, Mederacke I, Gwak GY, Dapito DH, Mu X, Hsu CC, Pradere JP, Friedman RA, Schwabe RF. Deactivation of hepatic stellate cells during liver fibrosis resolution in mice. Gastroenterology. 2012;143:1073–1083. doi: 10.1053/j.gastro.2012.06.036. e22. [DOI] [PMC free article] [PubMed] [Google Scholar]
- 19.Gressner AM, Weiskirchen R. Modern pathogenetic concepts of liver fibrosis suggest stellate cells and TGF-beta as major players and therapeutic targets. J Cell Mol Med. 2006;10:76–99. doi: 10.1111/j.1582-4934.2006.tb00292.x. [DOI] [PMC free article] [PubMed] [Google Scholar]
- 20.Thenappan A, Li Y, Kitisin K, Rashid A, Shetty K, Johnson L, Mishra L. Role of transforming growth factor beta signaling and expansion of progenitor cells in regenerating liver. Hepatology. 2010;51:1373–1382. doi: 10.1002/hep.23449. [DOI] [PMC free article] [PubMed] [Google Scholar]
- 21.Polyzos SA, Kountouras J, Mantzoros CS. Leptin in nonalcoholic fatty liver disease: A narrative review. Metabolism. 2015;64:60–78. doi: 10.1016/j.metabol.2014.10.012. [DOI] [PubMed] [Google Scholar]
- 22.Tsochatzis E, Papatheodoridis GV, Archimandritis AJ. The evolving role of leptin and adiponectin in chronic liver diseases. Am J Gastroenterol. 2006;101:2629–2640. doi: 10.1111/j.1572-0241.2006.00848.x. [DOI] [PubMed] [Google Scholar]
- 23.Tom RZ, Sjögren RJ, Vieira E, Glund S, Iglesias-Gutiérrez E, Garcia-Roves PM, Myers MG, Jr, Björnholm M. Increased hepatic insulin sensitivity in mice lacking inhibitory leptin receptor signals. Endocrinlolgy. 2011;152:2237–2246. doi: 10.1210/en.2010-0040. [DOI] [PubMed] [Google Scholar]
- 24.Sokolović A, van Roomen CP, Ottenhoff R, Scheij S, Hiralall JK, Claessen N, Aten J, Oude Elferink RP, Groen AK, Sokolović M. Fasting reduces liver fibrosis in a mouse model for chronic cholangiopathies. Biochim Biophys Acta. 2013;1832:1482–1491. doi: 10.1016/j.bbadis.2013.05.012. [DOI] [PubMed] [Google Scholar]
- 25.Ptak A, Gregoraszczuk EL. Bisphenol A induces leptin receptor expression, creating more binding sites for leptin, and activates the JAK/Stat, MAPK/ERK and PI3K/Akt signalling pathways in human ovarian cancer cell. Toxicol Lett. 2012;210:332–337. doi: 10.1016/j.toxlet.2012.02.003. [DOI] [PubMed] [Google Scholar]
- 26.Wada N, Hirako S, Takenoya F, Kageyama H, Okabe M, Shioda S. Leptin and its receptors. J Chem Neuroanat. 2014;61–62:191–199. doi: 10.1016/j.jchemneu.2014.09.002. [DOI] [PubMed] [Google Scholar]
- 27.Zhang W, Niu M, Yan K, Zhai X, Zhou Q, Zhang L, Zhou Y. Stat3 pathway correlates with the roles of leptin in mouse liver fibrosis and sterol regulatory element binding protein-1c expression of rat hepatic stellate cells. Int J Biochem Cell Biol. 2013;45:736–744. doi: 10.1016/j.biocel.2012.12.019. [DOI] [PubMed] [Google Scholar]
- 28.Suk KT, Kim DY, Sohn KM, Kim DJ. Biomarkers of liver fibrosis. Adv Clin Chem. 2013;62:33–122. doi: 10.1016/B978-0-12-800096-0.00002-0. [DOI] [PubMed] [Google Scholar]
- 29.Shimabukuro M, Tanaka H, Shimabukuro T. Effects of telmisartan on fat distribution in individuals with the metabolic syndrome. J Hypertension. 2007;25:841–848. doi: 10.1097/HJH.0b013e3280287a83. [DOI] [PubMed] [Google Scholar]
- 30.Yamada S, Ano N, Toda K, Kitaoka A, Shiono K, Inoue G, Atsuda K, Irie J. Telmisartan but not candesartan affects adiponectin expression in vivo and in vitro. Hypertens Res. 2008;31:601–606. doi: 10.1291/hypres.31.601. [DOI] [PubMed] [Google Scholar]
- 31.Kuwashiro S, Terai S, Oishi T, Fujisawa K, Matsumoto T, Nishina H, Sakaida I. Telmisartan improves nonalcoholic steatohepatitis in medaka (Oryzias latipes) by reducing macrophage infiltration and fat accumulation. Cell Tissue Res. 2011;344:125–134. doi: 10.1007/s00441-011-1132-7. [DOI] [PMC free article] [PubMed] [Google Scholar]
- 32.Zhang Q, Wang Y, Liu Y, Yang Q, Wang X, Wang Q, Zhang C, Wang B. Effects of telmisartan on resistin expression in a rat model of nonalcoholic steatohepatitis and insulin resistance. Zhonghua Gan Zang Bing Za Zhi. 2015;23:281–285. doi: 10.3760/cma.j.issn.1007-3418.2015.04.010. (In Chinese) [DOI] [PubMed] [Google Scholar]
- 33.Alam S, Kabir J, Mustafa G, Gupta U, Hasan SK, Alam AK. Effect of telmisartan on histological activity and fibrosis of non-alcoholic steatohepatitis: A 1-year randomized control trial. Saudi J Gastroenterol. 2016;22:69–76. doi: 10.4103/1319-3767.173762. [DOI] [PMC free article] [PubMed] [Google Scholar]
- 34.Jin H, Yamamoto N, Uchida K, Terai S, Sakaida I. Telmisartan prevents hepatic fibrosis and enzyme-altered lesions in liver cirrhosis rat induced by a choline-deficient L-amino acid-defined diet. Biochem Biophys Res Commun. 2007;364:801–807. doi: 10.1016/j.bbrc.2007.10.083. [DOI] [PubMed] [Google Scholar]
- 35.Nakagami H, Kiomy Osako M, Nakagami F, Shimosato T, Minobe N, Moritani T, Shimamura M, Miyake T, Shimizu H, Takeya Y, Morishita R. Prevention and regression of non-alcoholic steatohepatitis (NASH) in a rat model by metabosartan, telmisartan. Int J Mol Med. 2010;26:477–481. doi: 10.3892/ijmm_00000488. [DOI] [PubMed] [Google Scholar]