

Abstract
The aim of the present study was to evaluate the retinal nerve fiber layer (RNFL) thickness of myopic subjects using Spectralis optical coherence tomography (OCT) and to determine variations with age and sex. A total of 271 Chinese participants with a spherical equivalent <+0.50 diopters were enrolled in the research. All subjects underwent a full ophthalmic examination. RNFL thickness was measured and compared according to sex, age and spherical equivalent. No significant difference was demonstrated between RNFL thickness in males and females. No significant difference was observed between RNFL thickness of the two age groups (≤12 years old and >12 years old). Significant differences were observed in all subfields of RNFL thickness among different spherical equivalent groups (P<0.05). In conclusion, myopia did have special influence on RNFL thickness, which was not related to sex or age.
Keywords: myopia, optical coherence tomography, retinal nerve fiber layer
Introduction
Myopia is one of the most common health issues in Asia (1). Myopia, particularly high myopia, results in marked pathologic changes, such as posterior staphyloma, scleral thinning, large tilted optic discs, Fuchs' spot, large cup-to-disc ratios, thin lamina cribrosa and localized retinal nerve fiber layer (RNFL) defects (2,3). The myopic eyeball is enlarged with the increase of axial length and stretching beyond normal dimensions, which may lead to the thinning of the retina (1,3).
Myopia is well recognized to be associated with glaucoma; however, it remains uncertain whether RNFL thickness would vary with the refractive status of the eye (4,5). Parameters measured by optical coherence tomography (OCT) in the myopic eye have been previously studied (4–8). However, OCT characteristics have not yet been systematically analyzed and compared among different degrees of myopia. The purpose of the present study was to evaluate the RNFL thickness of Chinese subjects using Spectralis spectral domain OCT (SD-OCT) and analyze the relationship between RNFL thickness and myopia.
Subjects and methods
Design and participants
A total of 271 Chinese participants with spherical equivalent (SE) <+0.50 diopters (D) were consecutively enrolled and included in the present research. Subjects were recruited at the Second Affiliated Hospital of Wenzhou Medical University (Wenzhou, China) between October 2014 and March 2016. According to their SE, the subjects were divided into the following four groups for comparison: Group 1 were the high myopia group, with SE<-6.00 D; group 2 were the median myopia group, with SE between −3.00 and −6.00 D; group 3 were the low myopia group, with SE between −0.50 and −3.00 D; and group 4 were the emmetropic group (control), with spherical equivalents of ±0.50 D. All subjects underwent a full ophthalmic examination, including measurement of visual acuity, refraction and intraocular pressure (IOP) using a non-contact tonometer (Topcon CT-80; Topcon Corp., Tokyo, Japan), axial length measurement using an IOL-master (Zeiss IOL-Master; Carl Zeiss AG, Oberkochen, Germany), RNFL thickness measurement using a SD-OCT (Spectralis; Heidelberg Engineering, Inc., Heidelberg, Germany), and fundus examination with indirect ophthalmoscopy. Exclusion criteria were as follows: Best-corrected visual acuity worse than 20/20; IOP >21 mmHg; and any history or evidence of retinal disease, glaucoma, refractive or retinal/vitreous surgeries, neurological diseases or diabetes. When both eyes were eligible for study, one randomly selected eye per subject was selected for analysis. The present study was conducted in accordance with the ethical standards stated in the 1964 Declaration of Helsinki and was approved by the Ethics Committee of The Second Affiliated Hospital of Wenzhou Medical University. Written informed consent was obtained from all subjects.
OCT
All the measurements were performed by a single experienced operator who was blinded to the diagnoses of the subjects. The operator independently monitored the stability of fixation with an incorporated infrared camera. Cross-sectional images were analyzed with Spectralis OCT software v5.3 (Heidelberg Engineering GmbH, Heidelberg, Germany).
Peripapillary SD-OCT RNFL thickness measurements were performed on all subjects. The Spectralis OCT software allowed for automatic segmentation of the upper and lower borders of the RNFL to calculate the overall global average RNFL thickness. Peripapillary RNFL thickness values were divided into four quadrants. The superior and inferior quadrants were further divided into nasal (N) and temporal (T) sectors (Fig. 1). All RNFL region subfields included temporal superior (TS), temporal (T), temporal inferior (TI), nasal inferior (NI), nasal (N) and nasal superior (NS).
Figure 1.
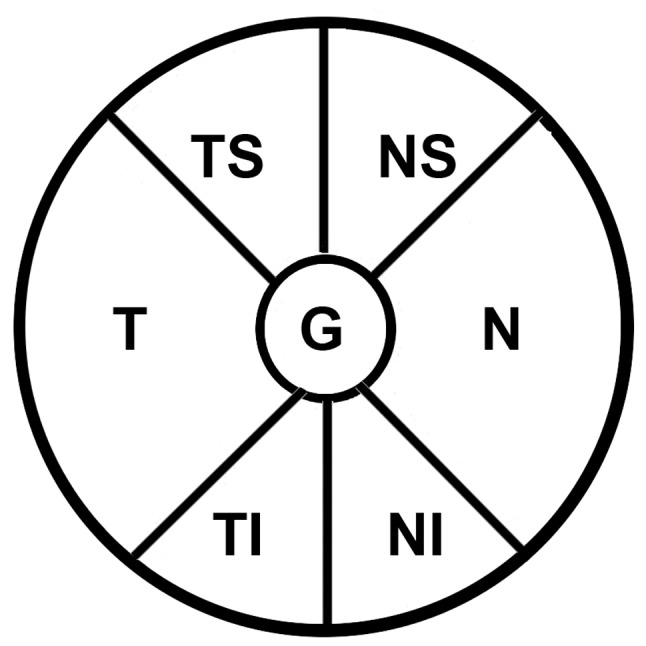
Depiction of the six standard subfields and the average of the retinal nerve disc. The pie chart displays four retinal nerve fiber layer sectors (TS, TI, NS and NI), two RNFL quadrants (N and T) and G. G is 360° and the four quadrants (superior, inferior, N and T) are each 90°. Sector TS is 45–90°, sector NS is 90–135°, sector NI is 225–270° and sector TI is 270–315°. TS, temporal superior; TI, temporal inferior; NS, nasal superior; NI, nasal inferior; N, nasal, T, temporal; G, overall global average.
Statistical analysis
All statistical analyses were conducted using SPSS v. 16.0 software (SPSS, Inc., Chicago, IL, USA). The Kolmogorov-Smirnov test was used to test the distribution type (Gaussian or non-Gaussian) of all continuous variables. The data were presented as the mean ± standard deviation (SD) for normally distributed, continuous numerical variables. Analysis of variance (ANOVA) was performed to determine differences between SE groups. The least significant difference test was used for multiple comparisons. Independent-samples t-tests were used to compare differences in RNFL thickness between the two age groups (≤12 years old and >12 years old) and sex. P<0.05 was considered to indicate a statistically significant difference.
Results
Comparison of RNFL thicknesses
Data from a total of 271 Chinese subjects were collected and analyzed. Of these subjects, 107 were female and 164 were male. The average age was 18±7.95 years (range, 7–35 years). There were 110 participants aged <12 years. The mean ± SD RNFL thickness values of all participants are demonstrated in Table I. No significant differences were observed between males and females in each RNFL region subfield (P>0.05; Table II). According to age, two groups were created, with group 1 being composed of subjects ≤12 years old and group 2 being composed of subjects >12 years old. There was no significant difference between the two age groups in any of the RNFL regions (P>0.05; Table II). However, a statistically significant negative correlation was demonstrated between the global mean peripapillary RNFL thickness and age (r=−0.141; P=0.02).
Table I.
RNFL thicknesses of all participants (n=271) in the different RNFL subfields.
| RNFL subfield | Thickness, µm |
|---|---|
| Temporal superior | 141.99±18.630 |
| Temporal | 85.05±13.474 |
| Temporal inferior | 154.68±20.773 |
| Nasal inferior | 102.07±22.166 |
| Nasal | 59.91±14.415 |
| Nasal superior | 111.47±24.109 |
| Global average | 100.08±9.962 |
Data are presented as the mean ± standard deviation. RNFL, retinal nerve fiber layer.
Table II.
Analysis, using independent-samples t-tests, of RNFL thickness in different age groups (≤12 years old, n=110; >12 years old, n=161) and sex groups (107 females and 164 males).
| Comparison (P-value) | ||
|---|---|---|
| RNFL subfield | Sex (male vs. female) | Age (≤12 years old vs. >12 years old) |
| Temporal superior | 0.117 | 0.101 |
| Temporal | 0.174 | 0.708 |
| Temporal inferior | 0.170 | 0.220 |
| Nasal inferior | 0.121 | 0.963 |
| Nasal | 0.969 | 0.536 |
| Nasal superior | 0.501 | 0.957 |
| Global average | 0.054 | 0.393 |
RNFL, retinal nerve fiber layer.
As shown in Table III, on the T subfield, group 1 had the thickest RNFL thickness of 93.20 µm, followed by group 2 (85.54 µm), group 3 (83.61 µm) and group 4 (81.85 µm). On the N subfield, group 4 had the thickest RNFL thickness of 67.27 µm, followed by group 3 (60.91 µm), group 2 (58.85 µm) and group 1 (46.89 µm). Table III demonstrates ANOVA results of RNFL thickness in the different SE groups. Significant differences were observed in RNFL thickness in each RNFL region subfield between each of the SE groups (P<0.05). Multiple comparisons demonstrated notable results (Table IV). RNFL thicknesses in group 1 (high myopia group) were significantly different in each RNFL region subfield compared with the other three groups (P<0.05). In subfields NI and N, the RNFL thicknesses of groups 2 and 3 were significantly different compared with group 4 (P<0.05). In the NS subfield, RNFL thicknesses in group 2 were significantly different compared with groups 3 and 4.
Table III.
Analysis of variance of RNFL thickness in the different SE groups according to RNFL subfield.
| SE group | |||||
|---|---|---|---|---|---|
| RNFL subfield | 1 (n=55) | 2 (n=75) | 3 (n=79) | 4 (n=62) | P-value |
| Temporal superior | 131.89±21.73 | 142.73±15.97 | 144.56±16.69 | 142.97±21.20 | 0.006 |
| Temporal | 93.20±16.47 | 85.54±13.94 | 83.61±11.70 | 81.85±11.62 | <0.001 |
| Temporal inferior | 139.60±28.37 | 154.60±20.43 | 155.79±16.06 | 161.71±18.21 | <0.001 |
| Nasal inferior | 80.97±22.05 | 98.81±16.58 | 102.93±17.68 | 117.23±23.85 | <0.001 |
| Nasal | 46.89±15.01 | 58.85±13.69 | 60.91±11.54 | 67.27±13.71 | <0.001 |
| Nasal superior | 92.94±20.60 | 108.12±19.79 | 118.93±22.56 | 115.81±27.36 | <0.001 |
| Global average | 90.57±10.07 | 99.15±8.94 | 101.46±7.95 | 104.76±10.15 | <0.001 |
Data are presented as the mean ± standard deviation. RNFL, retinal nerve fiber layer; SE, spherical equivalent; 1, high myopia group with SE≤-6.00 diopters; 2, median myopia group with SE between −3.00 and −6.00 diopters; 3, low myopia group with SE between −0.50 and −3.00 diopters; 4, emmetropic group with SE of ±0.50 diopters.
Table IV.
Multiple comparisons between the different SE groups according to RNFL subfield.
| Comparisons between SE groups (P-value) | ||||||
|---|---|---|---|---|---|---|
| RNFL subfield | 1 vs. 2 | 1 vs. 3 | 1 vs. 4 | 2 vs. 3 | 2 vs. 4 | 3 vs. 4 |
| Temporal superior | 0.003 | 0.001 | 0.005 | 0.510 | 0.938 | 0.599 |
| Temporal | 0.004 | <0.001 | <0.001 | 0.331 | 0.093 | 0.420 |
| Temporal inferior | <0.001 | <0.001 | <0.001 | 0.694 | 0.055 | 0.073 |
| Nasal inferior | <0.001 | <0.001 | <0.001 | 0.165 | <0.001 | <0.001 |
| Nasal | <0.001 | <0.001 | <0.001 | 0.304 | <0.001 | 0.004 |
| Nasal superior | 0.001 | <0.001 | <0.001 | 0.002 | 0.044 | 0.406 |
| Global average | <0.001 | <0.001 | <0.001 | 0.095 | <0.001 | 0.029 |
RNFL, retinal nerve fiber layer; SE, spherical equivalent; 1, high myopia group with SE≤-6.00 diopters; 2, median myopia group with SE between −3.00 and −6.00 diopters; 3, low myopia group with SE between −0.50 and −3.00 diopters; 4, emmetropic group with SE of ±0.50 diopters.
Correlation analysis indicated that the global RNFL thickness was positively correlated with SE (P<0.001; Fig. 2).
Figure 2.

Correlation between global average RNFL thickness and SE. RNFL, retinal nerve fiber layer; SE, spherical equivalent; D, diopters.
Discussion
OCT has emerged as an important imaging tool in the assessment of retinal and optic nerve structure and diseases, such as macular edema, diabetic retinopathy and glaucoma (6,9). The Spectralis OCT accompanied with the eye tracking system allows high-speed, high-resolution imaging of the retina, improves the ability to detect the true inner and outer retinal boundaries and increases repeatability of measurements (9). The Spectralis OCT has presented the highest reproducibility, together with the best inter-operator agreement among different OCT devices in assessing RNFL thickness (10,11).
A study by Oner et al (12) evaluated the RNFL thickness in myopic and emmetropic eyes by SD-OCT and observed that the overall global RNFL thickness of myopic eyes was significantly thinner than that of emmetropic eyes. A study by Lim and Chun (13) compared the peripapillary RNFL thickness of high myopic eyes (SE≤-6.0 D) with those of low myopic eyes (SE from −0.25 to −3.0 D) in children and found that the mean overall thickness of the peripapillary RNFL in the high myopic subjects was significantly lower than that in the low myopic subjects. A study by Mohammad Salih (14) compared the peripapillary RNFL thickness of three different degrees of myopic groups and found that the mean RNFL thickness was thinner in highly and moderately myopic eyes compared with low myopic eyes. In the present study, subjects were divided into four groups, with one emmetropic group and three myopic groups. It was demonstrated that myopic eyes had a thinner average global RNFL thickness compared with emmetropic eyes, while the high myopic eye had the thinnest average global RNFL thickness. From the present results, it may be proposed that the global RNFL thickness has a linear increase with the increase of SE. This trend may explain why the average global RNFL thickness in the present study (100.08 µm) was thinner than 102 µm obtained in a study by Zhao et al (15), but close to 100.7 µm obtained in a study by Alasil et al (16). All three studies were concerned with Asian individuals. The difference may lie on the more myopic SE (−2.96 D) of the present research compared with others.
Zhao et al (15) used SD-OCT to measure the RNFL thickness of Chinese individuals and observed that the mean RNFL thickness was higher in the TI quadrant than in the TS sector, followed by the NI sector, the NS sector, the T sector and finally the N quadrant. In the present research, the mean RNFL thickness was thicker in the TI quadrant than in the TS sector, followed by the NS sector, the NI, the T sector and finally the N quadrant. The only difference between the pattern obtained by Zhao et al (15) and the present study was the RNFL thickness of NI and NS. There was some similarity between the two studies. Firstly, both studies were related to Chinese subjects. Secondly, SD-OCT was used to scan the optic nerve head and macula. Lastly, for RNFL thickness measurements, the peripapillary region was divided into six sectors for analysis. Therefore, these two studies were comparable. Another explanation for the difference found between the two studies may be due to the difference in SE.
Controversies exist among the results of studies that investigated the influence of myopia on RNFL thickness (17–21). However, there are only two generally acknowledged opinions. One is that myopia has an effect on RNFL thickness and the other is that only high myopia influences RNFL thickness. In the current study, the T quadrant has the greatest RNFL thickness in high myopia groups than in moderate or low myopia groups. A study by Kim et al (5) attempted to explain the greater RNFL thickness in the T quadrant among subjects with highly myopic eyes, and thought of it as a redistribution of the RNFL. They inferred that, with the increase of axial length, the retina was dragged toward the temporal horizon and the RNFL was compressed against the bundles originating from the opposite hemisphere at the horizontal raphe, which would result in thickening of the RNFL in the temporal quadrant (5). A study by Moriyama et al (22) imaged the shape of the globe in 44 highly myopic eyes using high-resolution magnetic resonance images and demonstrated that myopic eyes had symmetrical or asymmetrical anteroposterior elongation and posterior protrusions, which could draw the superior and inferior RNFL bundles closer to the macula. However, Leung et al (6) considered the T convergence of the RNFL bundles as an image artifact consequential to an increase in the vertical curvature of the retina.
In the present study, the average global RNFL thickness was thinnest in the subjects of the high myopia group. The thinning was not universal. Although the high myopia group had significantly thinner RNFL thickness in the non-T sectors, they had significantly thicker RNFL thickness in the T quadrant compared with the other three groups. Notably, the high myopia group demonstrated significantly different RNFL thicknesses compared with the other three groups in all subfields of the RNFL. However, RNFL thickness in the median and low myopia groups were only significantly different compared with the emmetropic group at subfields NI and N. At the NS subfield, the median myopia group demonstrated significant differences in RNFL thickness with the low myopia group and emmetropic group. These results indicate that myopia did have an influence on RNFL thickness. It may also be concluded that a special pattern exists for myopia influencing RNFL thickness. According to the present results, it may be deduced that the whole process of myopia influences RNFL. The N and NI regions of the RNFL were more sensitive to myopia, which means that even with low myopia, the RNFL thickness of these two regions is more greatly affected and becomes thinner. In the present study, the NS region of the RNFL was the second most sensitive region when it came to medium myopia, followed by the TS and TI regions, which were sensitive to only higher myopia (SE≤-6.00 D). The T quadrant region demonstrated thicker RNFL values with the increase of myopia. This process may explain why the NS region had greater RNFL thickness than the NI compared with the study by Zhao et al (15).
Age and sex are two factors that may affect macular retinal thickness and RNFL thickness; however, contradictory results have been found in former studies (21,23–25). In the present research, a statistically meaningful negative correlation was demonstrated between the global mean peripapillary RNFL thickness and age, which has been reported before in various studies (15,16). Yet no significant difference was observed between the two age groups and two sex groups in the present study, which suggested that age and sex may not affect macular retinal thickness and RNFL thickness.
In conclusion, the present study provided a detailed evaluation of SD-OCT RNFL thickness in Chinese subjects and their relationship with myopia. It was demonstrated that myopia did have particular influence on RNFL thickness. The degree of myopia may affect the RNFL thickness differently. OCT RNFL thickness measurement may be a tool to predict myopia progression. Ophthalmologists should take these structural characteristics into consideration during the clinical evaluation of myopia.
Acknowledgements
The authors thank Professor Mingguang Shi (the Second Affiliated Hospital of Wenzhou Medical University, Wenzhou, China) for his helpful comments and suggestions on statistics. This study was supported by the Education Department Project in Zhejiang Province (grant no. Y201636869).
References
- 1.Morgan IG, Ohno-Matsui K, Saw SM. Myopia. Lancet. 2012;379:1739–1748. doi: 10.1016/S0140-6736(12)60272-4. [DOI] [PubMed] [Google Scholar]
- 2.Kremmer S, Zadow T, Steuhl KP, Selnack JM. Scanning laser polarimetry in myopic and hyperopic subjects. Grafes Arch Clin Exp Ophthalmol. 2004;242:489–494. doi: 10.1007/s00417-004-0859-1. [DOI] [PubMed] [Google Scholar]
- 3.Schweitzer KD, Ehmann D, Garcia R. Nerve fibre layer changes in highly myopic eyes by optical coherence tomography. Can J Ophthalmol. 2009;44:e13–e16. doi: 10.3129/i09-058. [DOI] [PubMed] [Google Scholar]
- 4.Vernon SA, Rotchford AP, Negi A, Ryatt S, Tattersal C. Peripapillary retinal nerve fiber layer thickness in highly myopic Caucasians as measured by Stratus optical coherence tomography. Br J Ophthalmol. 2008;92:1076–1080. doi: 10.1136/bjo.2007.127571. [DOI] [PubMed] [Google Scholar]
- 5.Kim MJ, Lee EJ, Kim TW. Peripapillary retinal nerve fibre layer thickness profile in subjects with myopia measured using the Stratus optical coherence tomography. Br J Ophthalmol. 2010;94:115–120. doi: 10.1136/bjo.2009.162206. [DOI] [PubMed] [Google Scholar]
- 6.Leung CK, Yu M, Weinreb RN, Mak HK, Lai G, Ye C, Lam DS. Retinal nerve fiber layer imaging with spectral-domain optical coherence tomography: Interpreting the RNFL maps in healthy myopic eyes. Invest Ophthalmol Vis Sci. 2012;53:7194–7200. doi: 10.1167/iovs.12-9726. [DOI] [PubMed] [Google Scholar]
- 7.Zhang Z, He X, Zhu J, Jiang K, Zheng W, Ke B. Macular measurements using optical coherence tomography in healthy Chinese school age children. Invest Ophthalmol Vis Sci. 2011;52:6377–6383. doi: 10.1167/iovs.11-7477. [DOI] [PubMed] [Google Scholar]
- 8.Hwang YH, Kim YY. Macular thickness and volume of myopic eyes measured using spectral-domain optical coherence tomography. Clin Exp Optom. 2012;95:492–498. doi: 10.1111/j.1444-0938.2012.00749.x. [DOI] [PubMed] [Google Scholar]
- 9.Chen TC, Cense B, Pierce MC, Nassif N, Park BH, Yun SH, White BR, Bouma BE, Tearney GJ, de Boer JF. Spectral domain optical coherence tomography: Ultra-high speed, ultra-high resolution ophthalmic imaging. Arch Ophthalmol. 2005;123:1715–1720. doi: 10.1001/archopht.123.12.1715. [DOI] [PubMed] [Google Scholar]
- 10.Pierro L, Giatsidis SM, Mantovani E, Gagliardi M. Macular thickness interoperator and intraoperator reproducibility in healthy eyes using 7 optical coherence tomography instruments. Am J Ophthalmol. 2010;150:199–204. doi: 10.1016/j.ajo.2010.03.015. e1. [DOI] [PubMed] [Google Scholar]
- 11.Pierro L, Gagliardi M, Iuliano L, Ambrosi A, Bandello F. Retinal nerve fiber layer thickness reproducibility using seven different OCT instruments. Invest Ophthalmol Vis Sci. 2012;53:5912–5920. doi: 10.1167/iovs.11-8644. [DOI] [PubMed] [Google Scholar]
- 12.Oner V, Aykut V, Tas M, Alakus MF, Iscan Y. Effect of refractive status on peripapillary retinal nerve fibre layer thickness: A study by RTVue spectral domain optical coherence tomography. Br J Ophthalmol. 2013;97:75–79. doi: 10.1136/bjophthalmol-2012-301865. [DOI] [PubMed] [Google Scholar]
- 13.Lim HT, Chun BY. Comparison of OCT measurements between high myopic and low myopic children. Optom Vis Sci. 2013;90:1473–1478. doi: 10.1097/OPX.0000000000000086. [DOI] [PubMed] [Google Scholar]
- 14.Mohammad Salih PA. Evaluation of peripapillary retinal nerve fiber layer thickness in myopic eyes by spectral-domain optical coherence tomography. J Glaucoma. 2012;21:41–44. doi: 10.1097/IJG.0b013e3181fc8053. [DOI] [PubMed] [Google Scholar]
- 15.Zhao L, Wang Y, Chen CX, Xu L, Jonas JB. Retinal nerve fibre layer thickness measured by Spectralis spectral-domain optical coherence tomography: The Beijing Eye Study. Acta Ophthalmol. 2014;92:e35–e41. doi: 10.1111/aos.12240. [DOI] [PubMed] [Google Scholar]
- 16.Alasil T, Wang K, Keane PA, Lee H, Baniasadi N, de Boer JF, Chen TC. Analysis of normal retinal nerve fiber layer thickness by age, sex, and race using spectral domain optical coherence tomography. J Glaucoma. 2013;22:532–541. doi: 10.1097/IJG.0b013e318255bb4a. [DOI] [PubMed] [Google Scholar]
- 17.Melo GB, Libera RD, Barbosa AS, Pereira LM, Doi LM, Melo LA., Jr Comparison of optic disk and retinal nerve fiber layer thickness in nonglaucomatous and glaucomatous patients with high myopia. Am J Ophthalmol. 2006;142:858–7860. doi: 10.1016/j.ajo.2006.05.022. [DOI] [PubMed] [Google Scholar]
- 18.Leung CK, Mohamed S, Leung KS, Cheung CY, Chan SL, Cheng DK, Lee AK, Leung GY, Rao SK, Lam DS. Retinal nerve fiber layer measurements in myopia: An optical coherence tomography study. Invest Ophthalmol Vis Sci. 2006;47:5171–5176. doi: 10.1167/iovs.06-0545. [DOI] [PubMed] [Google Scholar]
- 19.Budenz DL, Anderson DR, Varma R, Schuman J, Cantor L, Savell J, Greenfield DS, Patella VM, Quigley HA, Tielsch J. Determinants of normal retinal nerve fiber layer thickness measured by Stratus OCT. Ophthalmology. 2007;114:1046–1052. doi: 10.1016/j.ophtha.2006.08.046. [DOI] [PMC free article] [PubMed] [Google Scholar]
- 20.Lee JW, Yau GS, Woo TT, Yick DW, Tam VT, Lai JS. Retinal nerve fiber layer thickness in myopic, emmetropic, and hyperopic children. Medicine (Baltimore) 2015;94:e699. doi: 10.1097/MD.0000000000000699. [DOI] [PMC free article] [PubMed] [Google Scholar]
- 21.Rauscher FM, Sekhon N, Feuer WJ, Budenz DL. Myopia affects retinal nerve fiber layer measurements as determined by optical coherence tomography. J Glaucoma. 2009;18:501–505. doi: 10.1097/IJG.0b013e318193c2be. [DOI] [PMC free article] [PubMed] [Google Scholar]
- 22.Moriyama M, Ohno-Matsui K, Hayashi K, Shimada N, Yoshida T, Tokoro T, Morita I. Topographic analyses of shape of eyes with pathologic myopia by high-resolution three-dimensional magnetic resonance imaging. Ophthalmology. 2011;118:1626–1637. doi: 10.1016/j.ophtha.2011.01.018. [DOI] [PubMed] [Google Scholar]
- 23.Leung MM, Huang RY, Lam AK. Retinal nerve fiber layer thickness in normal hong kong chinese children measured with optical coherence tomography. J Glaucoma. 2009;19:95–99. doi: 10.1097/IJG.0b013e3181a98cfa. [DOI] [PubMed] [Google Scholar]
- 24.Song WK, Lee SC, Lee ES, Kim CY, Kim SS. Macular thickness variations with sex, age, and axial length in healthy subjects: A spectral domain-optical coherence tomography study. Invest Ophthalmol Vis Sci. 2010;51:3913–3918. doi: 10.1167/iovs.09-4189. [DOI] [PubMed] [Google Scholar]
- 25.Grover S, Murthy RK, Brar VS, Chalam KV. Normative data for macular thickness by high-definition spectral-domain optical coherence tomography (Spectralis) Am J Ophthalmol. 2009;148:266–271. doi: 10.1016/j.ajo.2009.03.006. [DOI] [PubMed] [Google Scholar]