Abstract
Introduction:
The quality of data obtained from image analysis can be directly affected by several preanalytical (e.g., staining, image acquisition), analytical (e.g., algorithm, region of interest [ROI]), and postanalytical (e.g., computer processing) variables. Whole-slide scanners generate digital images that may vary depending on the type of scanner and device settings. Our goal was to evaluate the impact of altering brightness, contrast, compression, and blurring on image analysis data quality.
Methods:
Slides from 55 patients with invasive breast carcinoma were digitized to include a spectrum of human epidermal growth factor receptor 2 (HER2) scores analyzed with Visiopharm (30 cases with score 0, 10 with 1+, 5 with 2+, and 10 with 3+). For all images, an ROI was selected and four parameters (brightness, contrast, JPEG2000 compression, out-of-focus blurring) then serially adjusted. HER2 scores were obtained for each altered image.
Results:
HER2 scores decreased with increased illumination, higher compression ratios, and increased blurring. HER2 scores increased with greater contrast. Cases with HER2 score 0 were least affected by image adjustments.
Conclusion:
This experiment shows that variations in image brightness, contrast, compression, and blurring can have major influences on image analysis results. Such changes can result in under- or over-scoring with image algorithms. Standardization of image analysis is recommended to minimize the undesirable impact such variations may have on data output.
Keywords: Calibration, digital pathology, error, human epidermal growth factor receptor 2, image analysis, informatics, whole-slide imaging
INTRODUCTION
There has been a recent increase in the number of image analysis algorithms being developed for use in pathology.[1] One set of algorithms that has demonstrated considerable success is those apps that assist pathologists with quantifying immunohistochemistry stain results. Quantitative image analysis (QIA) for evaluating breast biomarkers, i.e., estrogen receptor, progesterone receptor, human epidermal growth factor receptor 2 (HER2), and Ki67, is commonly employed in clinical practice.[2,3] Several of these algorithms have even received regulatory approval by the United States Food and Drug Administration and/or by the European Union's Conformite Européenne (CE marking) for clinical use.[4] QIA algorithms have been reported to provide more precise, accurate, and reproducible quantitative measurements than pathologists,[5] especially for intermediate categories and complex scoring systems. In one study using deep learning to score HER2 of breast cancer cases, the investigators showed that the diagnostic discordance between algorithm and manual scores was caused by differences in human perception when assessing HER2 cases with stain heterogeneity.[6]
Despite the aforementioned benefits of QIA, the pathology community is aware that the quality of image analysis data can be affected by several variables.[7] Preanalytical variables that may potentially impact QIA results include tissue handling (e.g., fixation), glass-slide preparation (e.g., tissue section folds), and staining (e.g., color differences). Analytical variables that may alter QIA results include technical factors such as image file format or software application, as well as biological parameters such as tumor heterogeneity (e.g., analyzing an entire specimen vs. only hotspots). Image acquisition may also influence results. In a study regarding whole-slide imaging (WSI) reproducibility, researchers showed that running an identical commercial HER2/neu algorithm with preset parameters on images acquired from three different scanners produced inconsistent results.[8] It is conceivable that even digital slides acquired using the same WSI scanner may differ from one another (i.e., intrascanner variability) that could impact QIA findings. To illustrate this point, a study was conducted evaluating the potential impact of altering specific image parameters (brightness, contrast, compression, and blurring) on HER2 image analysis data quality.
METHODS
This study was approved by the Institutional Review Board at the University of Pittsburgh Medical Center.
Image acquisition
Glass slides from 55 patients with invasive breast carcinoma were digitized using a VL120 WSI scanner (GE Omnyx). These cases included a spectrum of HER2 scores: 30 cases with score 0, 10 with 1+, 5 with 2+, and 10 with 3+ scores. For each case, a region of interest (ROI) was segmented by a pathologist from the HER2-stained slide showing that invasive carcinoma, without artifacts (no tissue folds or tears, no excess background staining, no dirt or coverslip imperfections such as excess mounting medium, and image of cancer cells in focus), was selected from the digital slide and a static image snapshot (JPEG format) was saved.
Image manipulation
We utilized the Visiopharm HER2 image algorithm (HER2-Connect™) and assessed its robustness against images serially degraded with four parameters: brightness, contrast, compression (JPEG2000), and blurring (to represent “out-of-focus” images). The HER2-Connect™ image analysis software module is intended for the detection and semi-quantitative measurement of HER2/neu (c-erb2-2) in formalin-fixed, paraffin-embedded breast tissue. The algorithm computes the connectivity (HER2-stained cell membranes) in one or more ROI defined by a user. This specific algorithm has been previously demonstrated to score immunohistochemical staining reactions of HER2 in digital images with high accuracy.[3,9] Successively degraded images were generated by computer simulation using MATLAB (2015a, MathWorks) and a computer (Alienware/M14XR2, Intel i7) with CPU 2.3GHz and 12G memory.
Brightness simulation
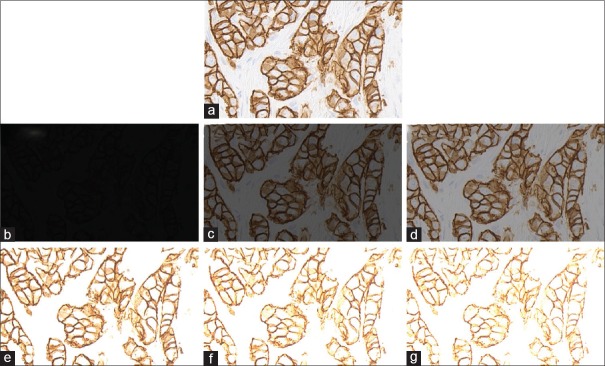
Images were altered to simulate different brightness settings. For this simulation, images were converted from their original Red-Green-Blue (RGB) space to the Hue-Saturation-Value (HSV) space, the latter being one of the most common cylindrical coordinate representation of points in an RGB color model.[10] The Value channel (V channel) permitted us to control brightness of the image. Brightness adjustment was accordingly implemented by increasing or decreasing the value in channel V, achieved by multiplying a weight to the V channel. As shown in the equation  , I0 and I1 represent the V channel before and after brightness adjustment and is the brightness controller ranging from −0.95 to 1.45. Thereafter, the images were converted from HSV space back to the original RGB space. Some examples with figures showing a different brightness controller (a) are provided in Figure 1.
Figure 1.
Human epidermal growth factor receptor 2 score 3+ invasive breast carcinoma with brightness adjustments. (a) Original image, (b-d) degraded images with brightness controller an equal to 0.05, 0.35, and 0.65, respectively, (e-g) degraded images with brightness controller an equal to 1.35, 1.65, and 1.95, respectively
Contrast simulation
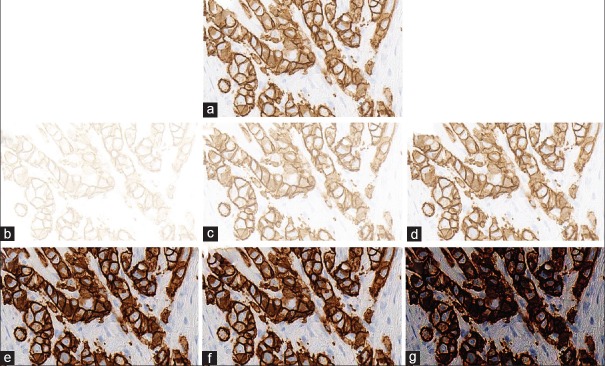
Contrast alteration was implemented by gamma correction, which is a nonlinear operation. A typical gamma correction can be defined by a power-law expression as demonstrated in the equation Vout= AVϒin where Vout and Vin are the V channel of output and input images, at HSV space.[11] A is a constant, in common case A = 1. Inputs and outputs are typically in the range of 0–1. A gamma value γ< 1 is sometimes called an encoding gamma, and the process of encoding with this compressive power-law nonlinearity is called gamma compression; conversely, a gamma value γ > 1 is called a decoding gamma and the application of the expansive power-law nonlinearity is called gamma expansion. Examples of regions from degraded images of varying contrast are shown in Figure 2.
Figure 2.
Human epidermal growth factor receptor 2 score 3+ invasive breast carcinoma with contrast adjustments. (a) Original image, (b-d) degraded images with gamma value of 0.1, 0.4, and 0.7, respectively, (e-g) degraded images with gamma value of 3, 6, and 9, respectively
Compression rates
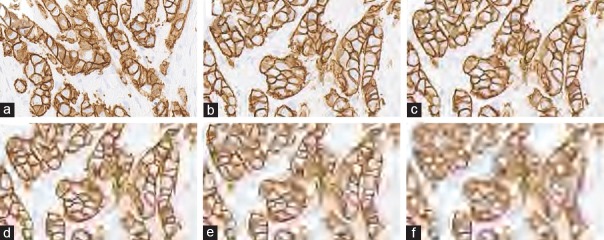
Acquired images of each breast cancer HER2 stain were successively compressed in JPEG2000 (JP2) ranging from compression rates of 3200–200 [Figure 3].
Figure 3.
Different compression rates. (a) Original image, (b-f) images with a compression rate of 200, 400, 1200, 2200, and 3200, respectively
Blurring simulation
Image alterations were undertaken to simulate image blurring caused by lens diffraction and focus. Blurred images were generated using circle blurring mask with a different radius as in the following equation:

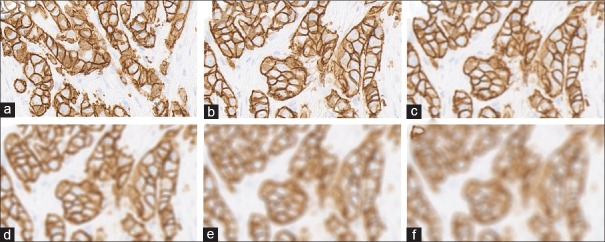
Where R∈(1,20). Masks with a large radius lead to a stronger blurred effect, while masks with a small radius result in a weaker blurred effect. Examples of images with blurred masks at different radii are demonstrated in Figure 4.
Figure 4.
Human epidermal growth factor receptor 2 3+ breast cancer with different blurring effects. (a) Original image, (b-f) images generated by blurring masks with a radius of 1, 5, 9, 14, and 18, respectively
Image analysis
For all original and subsequent serially altered images, a HER2 score was obtained using the exact same breast cancer ROI, HER2 image algorithm (Visiopharm, Hoersholm, Denmark), and computer. This included an analysis of 1375 images for brightness, 1045 images for contrast, 1100 images for compression, and 1100 images to evaluate the influence of blurring. No changes were made to the locked-down algorithm. The results of the image analysis were recorded in an Excel spreadsheet and analyzed for any trends relative to image adjustments. For the purpose of this study, as in clinical practice, images with scores equal to 0 or 1 were both considered as negative. Therefore, all results were classified into the following three categories: negative (HER2 score = 0 or 1+), ambiguous (HER2 score = 2+), and positive (HER2 score = 3+).
RESULTS
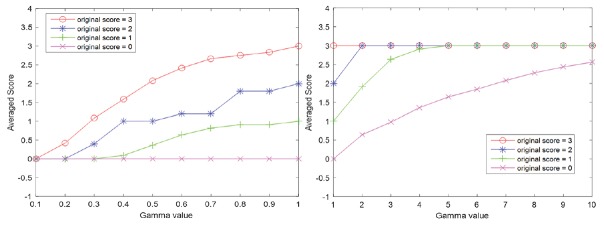
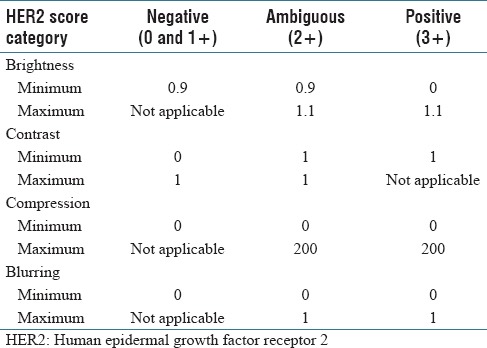
HER2 scores obtained by image analysis decreased in parallel with adjustments that resulted in increased brightness, greater compression ratios, and increased blurring [Table 1]. However, HER2 scores increased with greater image contrast. Cases that had HER2 scores of 0 were the least affected by any of the image adjustments. As illustrated in Figure 5, alterations for brightness had robust influences on all HER2 scores. Based on Figure 6, it can be observed that the effect of contrast on HER2 score was robust for negative cases when the gamma value was smaller than 1 and it was robust for positive HER2 cases when the gamma value was larger than 1. HER2 cases with ambiguous (2+) scores were most sensitive to contrast as image parameter adjustments caused scoring mistakes as soon as the gamma value was changed. Figure 7 indicates how image compression affects the scores for those cases with any HER2 immunohistochemical staining (i.e., for cases with 1+, 2+, and 3+ scores). Similarly, Figure 8 indicates how blurring affects HER2 scores for those cases with immunoreactivity. Cutoff values for adjusted image parameters in relation to their impact on HER2 score are provided in Table 2. The values that appear to have the least impact on HER2 score are brightness of ±5%, contrast with gamma of 1, compression ratio of 200, and blurring having a radius of 1 pixel.
Table 1.
Impact of adjusted image parameters on human epidermal growth factor receptor 2 image analysis scores

Figure 5.
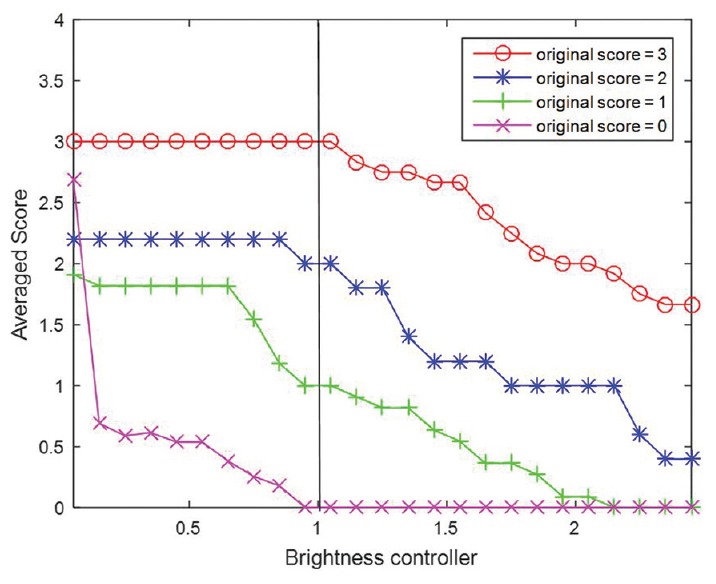
Plots of average score with increasing brightness controller. Brightness controller equal to 0 denotes the original (unaltered) images
Figure 6.
Plots of average score for contrast adjustment are shown with increasing gamma value. Gamma value equal to 1 denotes the original (unaltered) images. Left: Gamma value range is [0, 1]; Right: Gamma value range is [1, 10]
Figure 7.
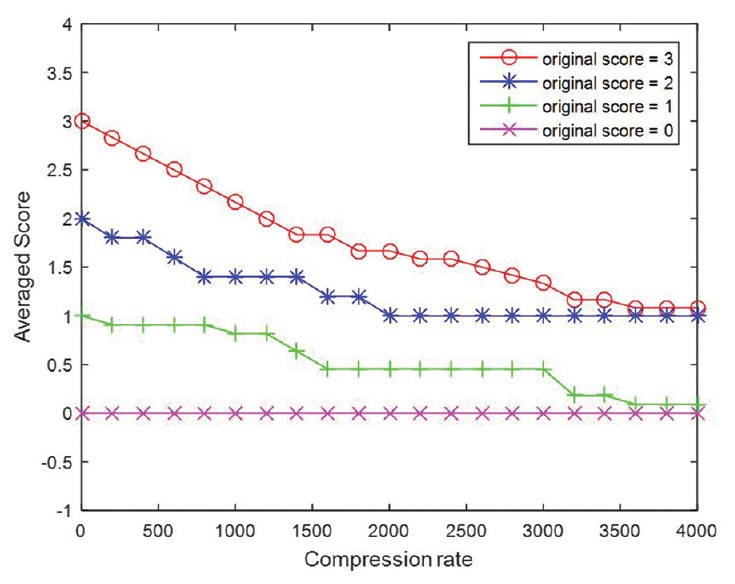
Plots of average score with increasing compression rate. Compression rate equal to 0 denotes the original images
Figure 8.
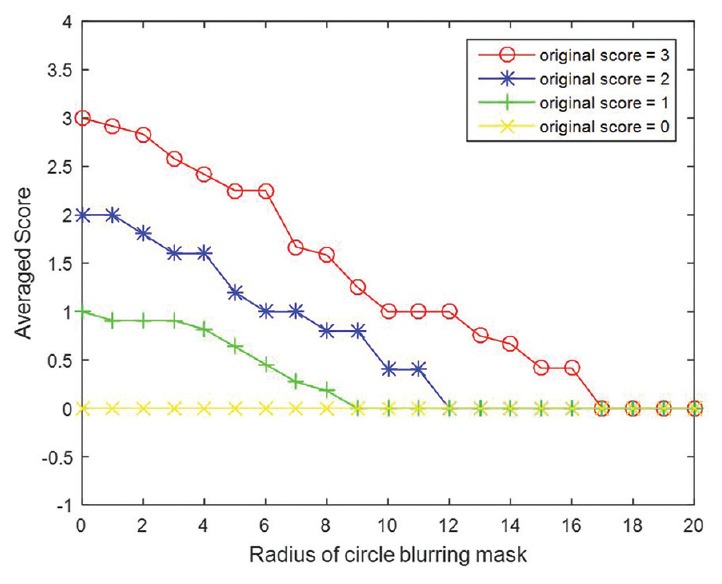
Plots of averaged score with increasing radius of blurring mask. Radius equal to 0 denotes the original images
Table 2.
Cutoff values for each adjusted image parameter related to minimum and maximum impact on human epidermal growth factor receptor 2 score
CONCLUSION
This experiment shows that variations in image brightness, contrast, compression, and blurring can all have major influences on image analysis results. Such parameter changes can accordingly result in either under- or over-scoring, in this case of HER2, when employing QIA. Krupinski et al. showed that whole-slide images may be compressible to relatively high levels (to at least 32:1) before impacting human diagnostic interpretation.[12] Although our data demonstrate that image compression can affect HER2 scores, Nicolosi et al. showed that the accuracy of CD34+ microvessel density counts did not differ when performed on JPEG versus TIFF digital images.[13] The impact of the other tested parameters on image analysis outcomes has not been well documented in the literature. Alterations of specific image parameters may occur unintentionally (e.g., when preselecting image acquisition criteria on a scanner device) or knowingly (e.g., with end-user image enhancements, such as performed with Photoshop). This may happen with static snapshots involving ROI or entire whole-slide images. These changes may also occur focally or globally.[14] For example, changes in the light source of scanning devices may alter image brightness and contrast. To reduce storage needs, or easily transmit files, images may be compressed when saving. The presence of dirt, excess mounting medium, or other embellishments of glass slides may affect focus causing blurring and poor-quality images.
This study focused on an algorithm that quantifies membrane staining. Further analysis is necessary to determine if there is a similar effect of preanalytical variables on nuclear and cytoplasmic image algorithms. In this study, static JPEG image snapshots were created from whole-slide images. Therefore, these reported findings are likely independent of the whole-slide image file format. Nevertheless, it would be of interest for this study to be repeated using whole-slide images comparing different scanners. Besides the aforementioned image parameters and the impact that their variation may have on the end result of image analysis, there are several other parameters (e.g., color) not tested in this study that could potentially have similar deleterious effects. Standardization of image analysis is therefore recommended to minimize the undesirable impact that such variations may have on data output. Standardization of preanalytic factors (e.g., tissue fixation, section thickness, stain platform) is equally important. Regular calibration and performance monitoring of image acquisition deices (e.g., up-to-date scanner maintenance) and image algorithms (e.g., calibration using controls for each stain run/batch) can further help mitigate potential errors when using image analysis. The upcoming guideline on QIA of HER2 being developed by the College of American Pathologists will hopefully help pathology laboratories address this important problem and thereby improve the validation, precision, and accuracy of HER2 scoring when performed by image analysis.
Financial support and sponsorship
Nil.
Conflicts of interest
There are no conflicts of interest.
Acknowledgment
This work was presented in part at the Pathology Informatics Summit in Pittsburgh, USA, on May 23–26, 2016. CL and GKR were supported in part by NIH grant NCI CA188938.
Footnotes
Available FREE in open access from: http://www.jpathinformatics.org/text.asp?2017/8/1/39/214170
REFERENCES
- 1.Pantanowitz L, Rimm D. Imaging and quantitative immunohistochemistry. In: Dabbs DJ, editor. Diagnostic Immunohistochemistry: Theranostic and Genomic Applications. 4th ed. Philadelphia: Saunders Elsevier; 2014. pp. 877–84. [Google Scholar]
- 2.Lloyd MC, Allam-Nandyala P, Purohit CN, Burke N, Coppola D, Bui MM. Using image analysis as a tool for assessment of prognostic and predictive biomarkers for breast cancer: How reliable is it? J Pathol Inform. 2010;1:29. doi: 10.4103/2153-3539.74186. [DOI] [PMC free article] [PubMed] [Google Scholar]
- 3.Brügmann A, Eld M, Lelkaitis G, Nielsen S, Grunkin M, Hansen JD, et al. Digital image analysis of membrane connectivity is a robust measure of HER2 immunostains. Breast Cancer Res Treat. 2012;132:41–9. doi: 10.1007/s10549-011-1514-2. [DOI] [PubMed] [Google Scholar]
- 4.Lange H. Digital pathology: A regulatory overview. Lab Med. 2011;42:587–91. [Google Scholar]
- 5.Stålhammar G, Fuentes Martinez N, Lippert M, Tobin NP, et al. Digital image analysis outperforms manual biomarker assessment in breast cancer. Mod Pathol. 2016;29:318–29. doi: 10.1038/modpathol.2016.34. [DOI] [PubMed] [Google Scholar]
- 6.Vandenberghe ME, Scott ML, Scorer PW, Söderberg M, Balcerzak D, Barker C. Relevance of deep learning to facilitate the diagnosis of HER2 status in breast cancer. Sci Rep. 2017;7:45938. doi: 10.1038/srep45938. [DOI] [PMC free article] [PubMed] [Google Scholar]
- 7.Leo P, Lee G, Shih NN, Elliott R, Feldman MD, Madabhushi A. Evaluating stability of histomorphometric features across scanner and staining variations: Prostate cancer diagnosis from whole slide images. J Med Imaging (Bellingham) 2016;3:047502. doi: 10.1117/1.JMI.3.4.047502. [DOI] [PMC free article] [PubMed] [Google Scholar]
- 8.Keay T, Conway CM, O'Flaherty N, Hewitt SM, Shea K, Gavrielides MA. Reproducibility in the automated quantitative assessment of HER2/neu for breast cancer. J Pathol Inform. 2013;4:19. doi: 10.4103/2153-3539.115879. [DOI] [PMC free article] [PubMed] [Google Scholar]
- 9.Laurinaviciene A, Dasevicius D, Ostapenko V, Jarmalaite S, Lazutka J, Laurinavicius A. Membrane connectivity estimated by digital image analysis of HER2 immunohistochemistry is concordant with visual scoring and fluorescence in situ hybridization results: Algorithm evaluation on breast cancer tissue microarrays. Diagn Pathol. 2011;6:87. doi: 10.1186/1746-1596-6-87. [DOI] [PMC free article] [PubMed] [Google Scholar]
- 10.Joblove GH, Greenberg D. Color spaces for computer graphics. Comput Graph. 1978;12:20–5. [Google Scholar]
- 11.Gonzalez R, Woods R. Digital Image Processing. 3rd ed. Upper Saddle River, New Jersey: Pearson/Prentice Hall; 2008. p. 110. [Google Scholar]
- 12.Krupinski EA, Johnson JP, Jaw S, Graham AR, Weinstein RS. Compressing pathology whole-slide images using a human and model observer evaluation. J Pathol Inform. 2012;3:17. doi: 10.4103/2153-3539.95129. [DOI] [PMC free article] [PubMed] [Google Scholar]
- 13.Nicolosi JS, Yoshida AO, Sarian LO, Silva CA, Andrade LA, Derchain SF, et al. Image compression impact on quantitative angiogenesis analysis of ovarian epithelial neoplasms. Appl Immunohistochem Mol Morphol. 2012;20:91–5. doi: 10.1097/PAI.0b013e31821c501a. [DOI] [PubMed] [Google Scholar]
- 14.Pritt BS, Gibson PC, Cooper K. Digital imaging guidelines for pathology: A proposal for general and academic use. Adv Anat Pathol. 2003;10:96–100. doi: 10.1097/00125480-200303000-00004. [DOI] [PubMed] [Google Scholar]


