Abstract
Aims
Mutations of cardiac sarcomere genes have been identified to cause HCM, but the molecular mechanisms that lead to cardiomyocyte hypertrophy and risk for sudden death are uncertain. The aim of this study was to examine HCM disease mechanisms at play during cardiac differentiation of human HCM specific pluripotent stem cells.
Methods and results
We generated a human embryonic stem cell (hESC) line carrying a naturally occurring mutation of MYPBC3 (c.2905 + 1 G > A) to study HCM pathogenesis during cardiac differentiation. HCM-specific hESC-derived cardiomyocytes (hESC-CMs) displayed hallmark aspects of HCM including sarcomere disarray, hypertrophy and impaired calcium impulse propagation. HCM hESC-CMs presented a transient haploinsufficiency of cMyBP-C during cardiomyocyte differentiation, but by day 30 post-differentiation cMyBP-C levels were similar to control hESC-CMs. Gene transfer of full-length MYBPC3 during differentiation prevented hypertrophy, sarcomere disarray and improved calcium impulse propagation in HCM hESC-CMs.
Conclusion(s)
These findings point to the critical role of MYBPC3 during sarcomere assembly in cardiac myocyte differentiation and suggest developmental influences of MYBPC3 truncating mutations on the mature hypertrophic phenotype.
Keywords: Cardiomyopathy, Hypertrophy, Stem cells, Cardiac differentiation, Optical mapping, Stem cell derived cardiomyocytes
1. Introduction
Hypertrophic cardiomyopathy (HCM) is the most common autosomal dominant-inherited form of heart disease in the world and affects an estimated 1 in 500 [1–3]. HCM is caused by mutations in genes encoding cardiac sarcomere proteins and leads to cardiac hypertrophy, risk for sudden cardiac death and heart failure [4]. Most mutations causing HCM are of sarcomeric proteins including MYBPC3 and MYH7 [5]. MYBPC3 encodes cardiac myosin binding protein-C (cMyBP-C) which is myosin-associated protein regulating myocardial contraction [6–8], sarcomere development and intermolecular spatial organization [9–11]. The link between these mutations, cardiomyocyte hypertrophy and arrhythmias in HCM is currently unclear.
The majority of MYBPC3 mutations are splice site donor/acceptor or other insertion/deletion mutations that produce reading frame shifts, premature stop codons and ultimately truncated proteins [12]. However, analyses of cardiac tissue from HCM patients carrying truncation MYBPC3 mutations have failed to detect expression of the truncated peptide(s) [5,13–16]. Accordingly, cMyBP-C haploinsufficiency has been proposed as the primary disease mechanism in symptomatic patients [13,17]. However, this is controversial, because recent data show normal levels of cMyBP-C in myocardial tissue from patients with heterozygous truncating mutations of MYBPC3 [15]. Mice homozygous for a truncating MYBPC3 mutation develop dilated cardiomyopathy [18], but heterozygous knock-in and knock-out models have shown a very mild and late phenotype onset with partial compensatory upregulation of cMyBP-C [6,19]. A knock-in mouse model with an exon 30 truncating MYBPC3 mutation has normal levels of total cMyBP-C expression and normal cardiac morphology [19], but Barefield et al. [18] recently found that transaortic banding induced cardiac stress induces transient haploinsufficiency of cMyBP-C in this model. At this time, it remains unclear whether haploinsufficiency is responsible for either initiation or progression of HCM in humans [12,20].
To address this question, we developed the first human embryonic stem cell line (hESC) carrying a natural MYBPC3 mutation causative of HCM, other groups have reprogramed induced pluripotent cell lines carrying mutations on MYH7 and MyBPC3 [21–24]. We tested the hypotheses that there is MYBPC3 haploinsufficiency during cardiac differentiation and that hESC derived cardiomyocytes (hESC-CMs) carrying c.2905 + 1 G > A mutation in MYPBC3 recapitulate the hallmarks of the adult human phenotype including sarcomere/myocyte disarray, fiber and single cardiomyocyte hypertrophy and calcium homeostasis impairment. These hypotheses were tested with comparison of cardiac directed differentiation of HCM and normal hESC lines at different time points of differentiation, and with adenovirus-assisted acute transfer of wild-type MYBPC3 gene during cardiac differentiation. Our findings support that c.2905 + 1 G > A mutation in MYPBC3 induces a transient haploinsufficiency of cMyBP-C3 associated to hallmarks of HCM phenotype that can be prevented with acute gene transfer of wild-type MYBPC3. Furthermore, our findings support that disease specific human stem cell-derived cardiomyocytes represents an important model to elucidate novel mechanisms of pathogenesis for HCM.
2. Methods
Details of hESC lines derivation and characterization, cardiac differentiation, analysis of protein expression and localization, qRTPCR, optical mapping of intracellular calcium and statistical analysis can be found in the Online Supplement. The cell line carrying the mutation is referred as UM38-2 PGD-HCM and control lines as UM14-2 and UM22-2.
3. Results
3.1. Derivation and characterization of human embryonic stem cells
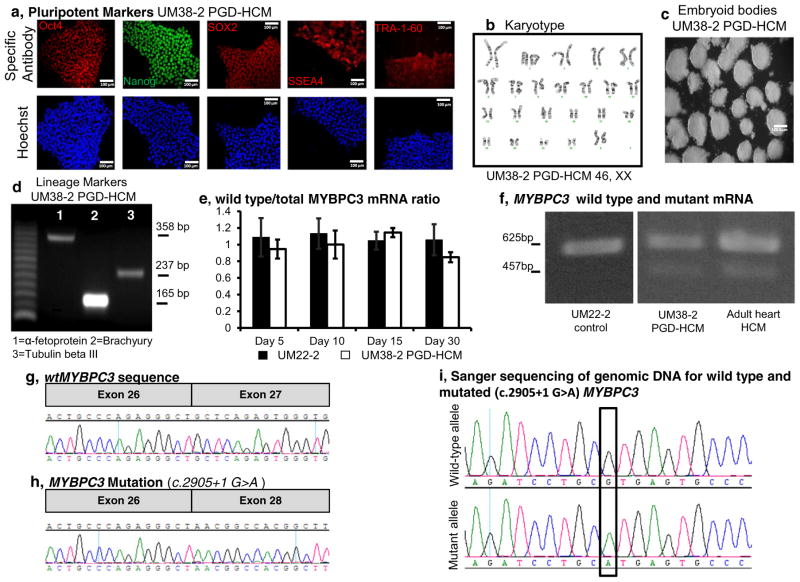
Newly derived and stablished hESC lines expressed pluripotency markers Oct4, Nanog, SOX2, SSEA4 and TRA-1-60 (Fig. 1a, Supplementary Fig. 1) and had normal karyotype (Fig. 1b, Supplemental Fig. 1f). Embryoid bodies of UM14-2, UM22-2 and UM38-2 PGD-HCM transcribed endoderm, mesoderm and ectoderm markers (Fig. 1c and d; and Supplementary Fig. 1g) and the 3 lines were successfully differentiated into cardiomyocytes.
Fig. 1.
HCM disease specific hESC line characterization and cardiac directed differentiation. a, Immunostaining for pluripotent stem cell markers. b, UM38-2 PGD-HCM cells have normal karyotype. c, UM38-2 PGD-HCM cells formed EBs and d, EBs express genetic markers of all three germ layers. e, qRT-PCR demonstrates proportional expression of wild-type MYBPC3 in relation to total MYBPC3 mRNA. f, RT-PCR observation of wild-type and c.2905 + 1 G > A mutation mRNA in UM22-2 and UM38-2 hESC-CMs, and a myectomy sample isolated from a patient carrying the same mutation. g&h, cDNA sequencing of exon 27 flanking regions confirms exon skipping in the disease cell line. i, the heterozygous mutation was also confirmed by sequencing of genomic DNA of UM38-2 PGD-HCM.
3.2. hESC cardiac directed differentiation and mutant MYBPC3 transcript
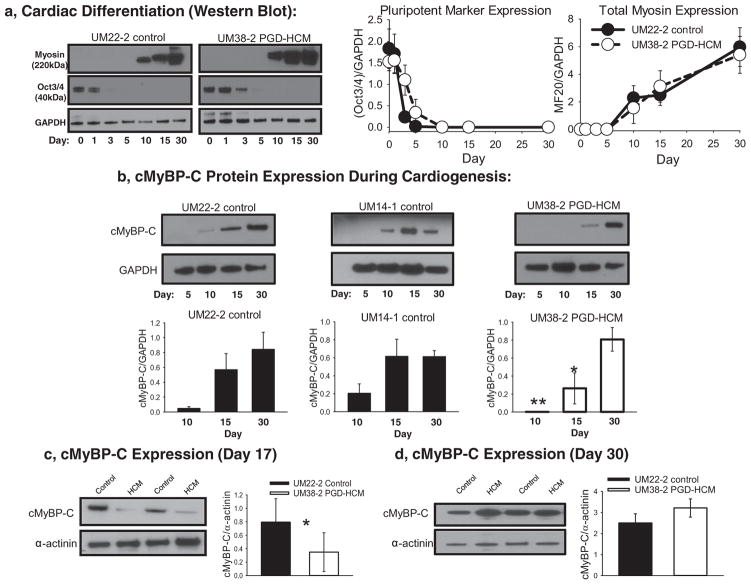
Western blot analysis (Fig. 2a) shows time-dependent reduction of Oct3/4 during cardiac differentiation. Concomitantly Fig. 2a shows that sarcomeric myosin II expression is detected by day 10 of the protocol, and continuously increase up to day 30.
Fig. 2.
cMyBP-C expression during cardiac directed differentiation. a, Western blot analysis of the expression of Oct3/4 and the muscle specific myosin II during cardiac directed differentiation in a control (UM22-2) and HCM cell lines (UM38-2). Quantification of Oct3/4 or myosin II expression relative to GAPDH (n = 3 differentiation experiments). b, Total cMyBP-C expression was determined during the cardiac directed differentiation process. In two different control cell lines cMyBP-C was detected as early as day 10 of differentiation. However, in the UM38-2 PGD-HCM cell line cMyBP-C was not detected at day 10, was less than controls on day 15 and was not different from controls on day 30. (** p = 0.002, *p = 0.004 UM14-1 and UM22-2 controls vs HCM, One-way ANOVA uncorrected Fisher’s LSD, n = 3 separate experiments). c, In separate experiments total cMyBP-C expression was quantified relative to α-actinin to normalize for any variations in differentiation efficiency on day 17(*unpaired t-test, P = 0.04, n = 6 differentiation experiments). d, On day 30 total cMyBP-C expression levels in the HCM cells were not different from control. Data were expressed as mean ± standard deviation.
PCR amplification of cDNA from UM38-2 PGD-HCM demonstrated two different MYBPC3 transcripts (Fig. 1f). Nucleotide sequencing of amplicon from UM38-2 PGD-HCM cardiomyocytes (Fig. 1f) confirmed that exon 27 is skipped during splicing of the mutant allele (Fig. 1g and h). This results in creation of a stop codon without introduction of novel sequence (Fig. 1h). The wild-type MYBCP3 transcript accounted for over 90% of the total MYBPC3 mRNA as determined by differential qrtPCR across days 5, 10, 15 and 30 of directed differentiation for the UM38-2 PGD-HCM line (Fig. 1e). This mutant mRNA transcript loss is similar to that observed in adult heart tissue harboring the identical mutation (Fig. 1f and [15]).
3.3. cMyBP-C protein expression during cardiac directed differentiation
cMyBP-C protein expression was detected as early as of day 10 of cardiac directed differentiation in control hESC lines (UM22-2 and UM14-1) and expression levels continued to increase up to day 30 (Fig. 2b), similar to the trend observed for total sarcomeric myosin (Fig. 2a). However, there was no detectable expression of cMyBP-C on day 10 of cardiac differentiation in the HCM hESC-CM (UM38-2 PGD-HCM, Fig. 2b), thus indicating a haploinsufficiency of full length protein. Despite the lack of cMyBP-C expression, these cardiomyocytes did express myosin and began to contract spontaneously at the same time in the differentiation process as control cardiomyocytes. cMyBP-C full length protein was detectable in the HCM line by day 15, but at a reduced amount compared to the control lines. However, by day 30 there were similar amounts of full length cMyBP-C expression in all cell lines (Fig. 2b). This result was apparent when cMyBP-C was normalized to GAPDH (Fig. 2b) or to a cardiomyocyte specific marker (α-actinin, Fig. 2c&d). This analysis suggests that reduced cMyBP-C protein expression early during cardiac directed differentiation in the hESC model is compensated by day 30 with restoration of cMyBP-C to normal amounts. In earlier work, a human heart tissue sample containing the c.2905 + 1 G > A mutation showed reduced cMyBP-C protein abundance compared to controls, but average cMyBP-C protein abundance across all human heart tissue samples with truncating MYBPC3 mutations was not significantly lower than in controls [15]. To determine whether the difference between the hESC-CM model and the human heart tissue data for the c.2905 + 1 G > A mutation is mutation-specific or due to inter-individual difference, we analyzed a newly acquired human tissue sample with the c.2905 + 1 G > A mutation and compared to the sample from Helms et al. and to donor heart controls. Using freshly homogenized sample, we found again a 41% reduction in cMyBP-C protein level from the previously studied individual, but no reduction in cMyBP-C protein in the newly acquired sample with the identical mutation (Supplemental Fig. 2).
3.4. hESC-CM hypertrophy, sarcomere and cellular structure analysis
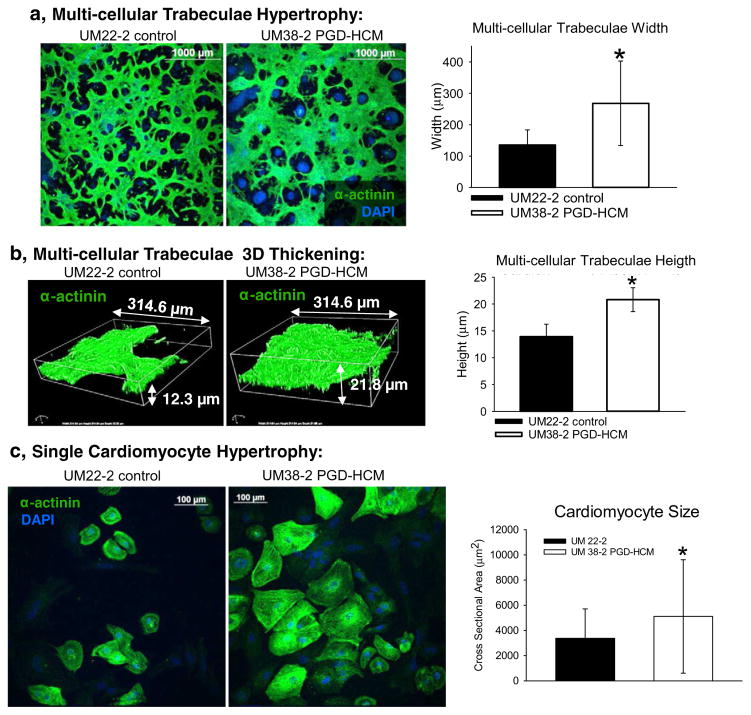
Multi-cellular trabeculae width and thickness were greater in HCM hESC-CMs compared to time matched derivation from control hESC-CMs (Fig. 3a&b). Cardiomyocytes from UM38-2 PGD-HCM had apparent hypertrophy at the single cell level compared to hESC-CMs from the UM22-2 control cell line (Fig. 3c, day 36 hESC-CMs).
Fig. 3.
Hypertrophic cardiomyopathy structural phenotype in the UM38-2 PGD HCM cell line obtained from 3 independent differentiations. a, Immunostaining for α-actinin 17 days after induction of differentiation. Average width of multicellular trabeculae obtained after differentiation was greater in the UM38-2 PGD-HCM CMs compared to the control (268.2 ± 119.5 μm, n = 144 vs. 135.2 ± 47.9 μm, n = 119 fibers *Student’s t-test p = 1 × 10⁻¹⁰). b, Average 3D thickness of multicellular trabeculae obtained after differentiation was greater in the UM38-2 PGD-HCM cultures compared to the UM22-2 control CMs (20.8 ± 2.2 μm, n = 13 vs. 13.9 ± 2.34 μm, n = 13 *Student’s t-test P = 6.5 × 10⁻⁸). c, Single cell hypertrophy was apparent in the UM38-2 PGD HCM cardiomyocytes as well (day 36, cross sectional area: 5114.41 ± 4505.83 μm2, n = 421 individual HCM CMs vs. 3367.85 ± 2344.98 μm2, n = 267 individual control CMs, * Student t-test, p = 0.001). Data were expressed as mean ± standard deviation.
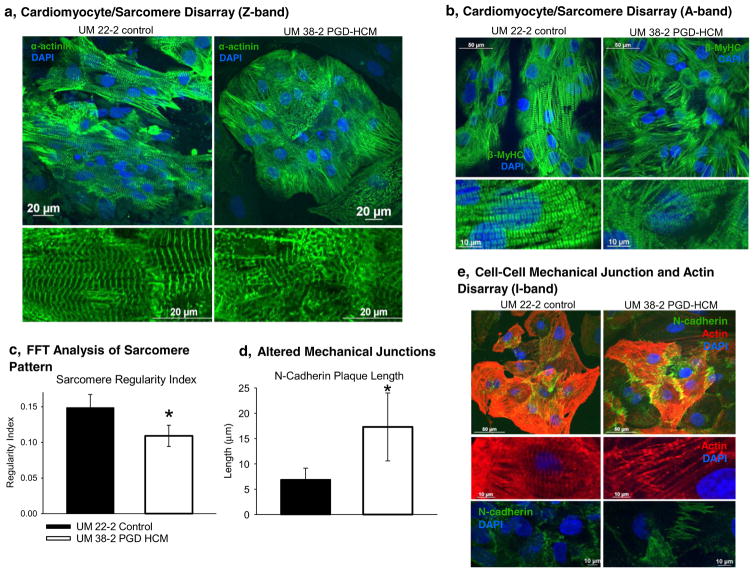
Additionally, we observed both sarcomere disarray and cell-cell junction disarray in HCM hESC-CMs (Fig. 4). In the HCM hESC-CMs sarcomere disarray was apparent when staining for the Z-band (Fig. 4a, α-actinin), for the A-band (Fig. 4b, β-MyHC) and for the I-band (Fig. 4e, actin). The average length of continuous myofibrils was also shorter in the UM38-2 PGD-HCM CMs (Supplemental Fig. 3). Fast Fourier Transform (FFT) analysis of the Z-band staining indicated lower regularity index (less organization) in the disease hESC-CMs (Fig. 4c). Examples of the FFT analysis of 60× confocal images are in the supplemental figures (Supplemental Figs. 4 and 5). Sarcomere disarray persisted over time in culture even up to day 69 where I-band disarray was observed on I-bands (Supplemental Fig. 6). Average length of the N-cadherin plaques (Supplemental Fig. 7) was longer in the HCM hESC-CMs, indicative of cell-cell mechanical junctions disorganization (Fig. 4d–e), as described in an animal model of HCM [25].
Fig. 4.
Cardiomyocyte and sarcomere disarray in the UM38-2 PGD HCM cell line. a, Examination of the Z-band (α-actinin) organization reveals sarcomere disarray in UM38-2 PGD HCM cardiomyocytes. b, Sarcomere disarray is also apparent in A-band (β-MyHC) immunostaining in the HCM cells. c, Fast Fourier Transform (FFT) analysis of the Z-band indicates that HCM cardiomyocytes have a lower regularity index, which reflects sarcomere disarray (0.11 ± 0.014, n = 10 vs. 0.15 ± 0.018, n = 10 *Student’s t-test, P = 6.0 × 10⁻⁵). d, Average length (transverse length at cell-cell junction) of the N-cadherin plaques reveals altered mechanical junctions in the HCM CMs (17.3 ± 6.71 μm, n = 78 CMs vs. 6.88 ± 2.2 μm, n = 57 CMs, *Student’s t-test, P = 1.0 × 10⁻⁹). e, I-band immunostaining (actin) shows sarcomere disarray and staining for N-cadherin shows altered cell-cell junction formation in the HCM CMs. Data were expressed as mean ± standard deviation.
3.5. Calcium transients and arrhythmias in HCM hESC-CMs
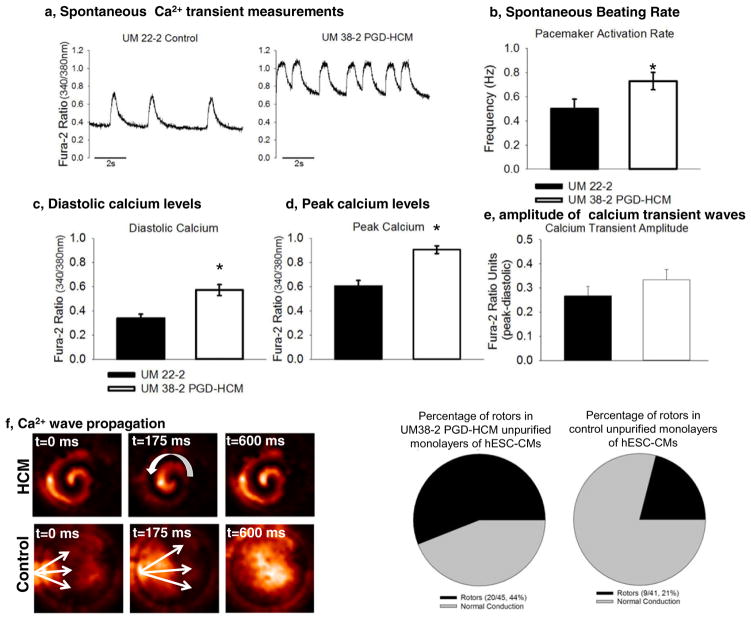
Intracellular calcium homeostasis has been shown to be dysregulated in HCM cardiomyocytes [21,26–28]. Cardiomyocytes from UM38 PGD-HCM had a significantly higher frequency of calcium transients than the control line (Fig. 5b). Additionally, the calcium diastolic levels and peak were greater in HCM cardiomyocytes (Fig. 5c & 5d); however, calcium transient amplitude was not affected (Fig. 5e).
Fig. 5.
Calcium transient waves in unpurified hESC-CMs. a, Unpurified cultures of hESC-CMs were submitted to optical mapping with Fura-2. b, Transient calcium waves frequency was higher in hESC-CMs from UM38-2 PGD-HCM (n = 15, 0.72 Hz ± 0.26) than in UM22-2 (n = 15, 0.5 ± 0.3 Hz; p = 0.03). c, Diastolic calcium levels were elevated in HCM hESC-CMs (n = 15, 0.57 ± 0.16) in comparison to those from UM22-2 (n = 15, 0.33 ± 0.16; p = 0.001). d, UM38-2 PGD-HCM cardiomyocytes also exhibited higher peak of calcium (n = 15, 0.9 ± 0.11) in comparison to UM22-2 cardiomyocytes (n = 15, 0.6 ± 0.17; p = 0.0001). e, Calcium waves amplitude was similar between groups (UM38-2 PGD-HCM n = 15, 0.33 ± 0.15, and UM22-2 n = 15, 0.26 ± 0.15; p = 0.18). f, Examples of rotors and continuous propagation of calcium waves in HCM hESC-CMs. Frequency of rotors was significantly higher in HCM-CMs (n = 45, 44%) than in the control line(n = 41, 21%; p = 0.0001). Data were expressed as mean ± standard deviation.
Seventeen days after differentiation initiation hESC-CMs monolayers presented stable rotors and/or continuous propagation of calcium waves (Fig. 5f, Supplemental videos 1 and 2). Proportion of hESC-CM monolayers with arrhythmic re-entry propagation (rotors) was greater in the HCM unpurified monolayers in comparison to control cells (Fig. 5g). We hypothesized that the pro-arrhythmia mechanism may be either due to HCM cardiomyocytes’ idiosyncrasies and/or altered intercellular communication between hESC-CMs and non-CMs in the unpurified monolayers. We therefore performed further optical mapping of calcium impulse propagation in purified hESC-CMs and found marked slowing of conduction velocity but absence of rotors (see, below).
3.6. Full length human MYBPC3 gene transfer during early cardiomyogenesis prevents HCM phenotype in hESC-CMs
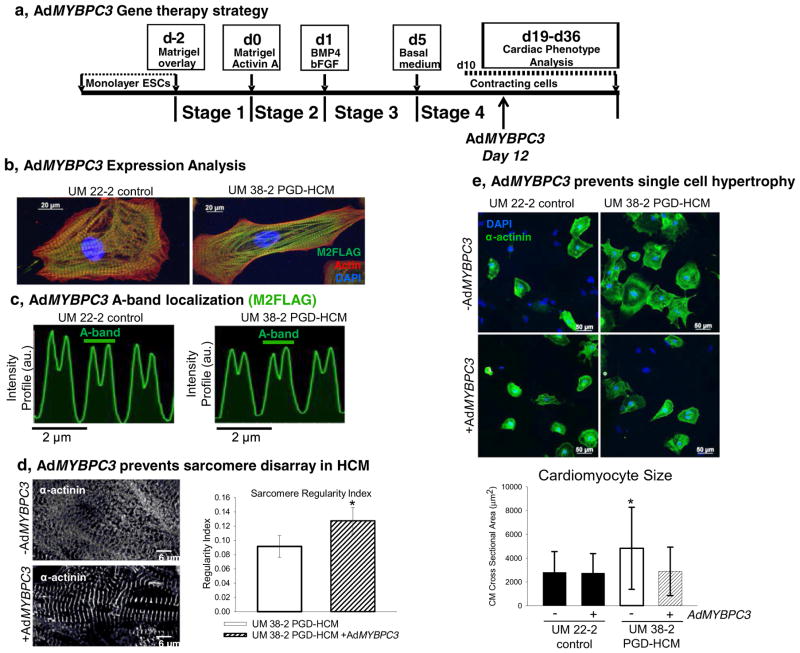
We tested the hypothesis that the HCM phenotype is caused by transient haploinsufficiency of cMyBP-C protein with adenoviral gene transfer of the full length human MYBPC3 gene (AdMYBPC3) on day 12 of the differentiation process (fig. 6a). Western blot analyses suggest that UM38-2 PGD-HCM hESC-CMs produced more M2-Flag tagged adenoviral cMyBP-C than UM22-2 hESC-CMs (Supplemental Fig. 8b and c).
Fig. 6.
Acute gene transfer of full length wtMYBPC3 in early cardiac directed differentiation prevents sarcomere disarray and cellular hypertrophy. a, AdMYBPC3 (250 moi) was applied to restore levels of cMyBP-C 12 after initiation of cardiac-directed differentiation. b, Full length cMyBP-C expression in hESC-CMs shown by M2-FLAG immunolocalization. c, Virus-delivered cMyBP-C localized correctly to each half of the sarcomeric A-band (~1.6 μm). d, AdMYBPC3 gene transfer prevented sarcomere disarray in HCM hESC-CMs, indicated in the picture as well as in the FFT analysis (regularity index = 0.09 ± 0.015, n = 10 vs. 0.13 ± 0.018, n = 9 after virus treatment, student t-test, *P = 0.0002). e, AdMYBPC3 gene transfer prevents CM hypertrophy compared to untreated UM38-2 PGD-HCM CMs (no treatment cell size = 4828.71 ± 3452.21 μm2, n = 193 vs. AdMYBPC3-treated cell size = 2888.83 ± 2047.93 μm2, n = 209). AdMYBPC3 gene transfer had no effect on UM22-2 CMs size (no treatment cell size = 2813.24 ± 1737.63 μm2, n = 211 vs. AdMYBPC3-treated cell size = 2744.38 ± 1639.60 μm2, n = 305). ***indicates significant difference from all other means, One-way ANOVA, Tukey’s multiple comparison test, p < 0.0001. Data were expressed as mean ± standard deviation.
We speculate that the lower level of endogenous cMyBP-C at this early time point in cardiac differentiation (Fig. 2c) may allow greater relative sarcomeric incorporation of the adenoviral cMyBP-C.
Importantly, Fig. 6b&c show proper A-band localization of the virus-delivered cMyBP-C in each half of the A-band, consistent with the normal spatial localization of this protein [7,29]. Examination of sarcomere structure 7 days after adenoviral infection revealed that MYBPC3 gene transfer promoted sarcomere organization in the disease cell line (Fig. 6d). Furthermore, single cardiomyocyte hypertrophy was also prevented by MYBPC3 gene delivery (Fig. 6e, 14 days after gene transfer).
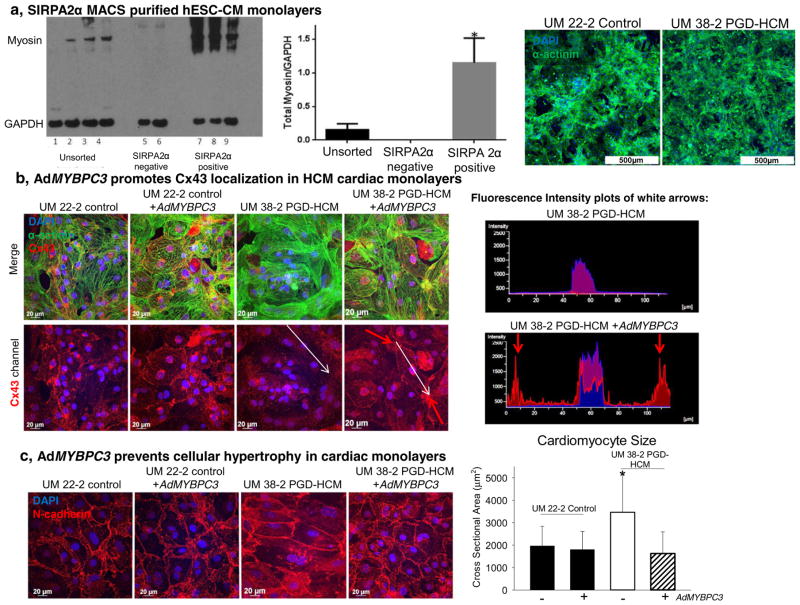
Finally we determined the effect of AdMYBPC3 gene transfer on the structural and functional phenotype of highly purified hESC-CM monolayers (Fig. 7a) plated on matrigel coated PDMS for improved hESC-CM maturation. [30,31] Immunofluorescent staining for connexin 43(Cx43) revealed that AdMYBPC3 treatment normalized gap junction formation and localization at the cell-cell connection sites (Fig. 7b). Cx43 was absent at the cell junctions in the HCM hESC-CM monolayers, but significantly accumulated at cardiomyocyte-to-cardiomyocyte connection sites following AdMYBPC3 treatment. Additionally, AdMYBPC3 gene transfer prevented hypertrophy in HCM hESC-CM monolayers (Fig. 7c).
Fig. 7.
AdMYBPC3 gene transfer prevents HCM phenotype in purified hESC-CM monolayers. a, SIRPA based magnetic activated cell sorting enriched the cell population expressing myosin used to form high-purity cardiomyocyte monolayers. b, Cx43 immunostaining shows lack of gap junctional protein in the HCM hESC-CM monolayers. However, AdMYBPC3 gene transfer promotes Cx43 expression and localization in the UM38-2 PGD-HCM monolayers. A fluorescence intensity plot of the white arrows demonstrates Cx43 localization at the cell-cell borders in the AdMYBPC3-treated group. c, N-cadherin expression is localized at the cell-cell borders was used to quantify CM size in each group. Untreated UM38-2 PGD-HCM CMs were larger than all other groups (3566.54 ± 1669.2 μm2, n = 57 compared to UM38-2 PGD-HCM AdMYBPC3-treated = 1621.8 ± 969.5 μm2, n = 80 and control UM22-2 = 1966.4 ± 876.1 μm2, n = 52 and UM 22-2 AdMYBPC3 treated = 1805.5 ± 810.35 μm2, n = 80). One-way ANOVA followed by Tukey’s multiple comparison, *P < 0.0001. CMs monolayers were fixed on day 35 of the differentiation protocol. Data were expressed as mean ± standard deviation.
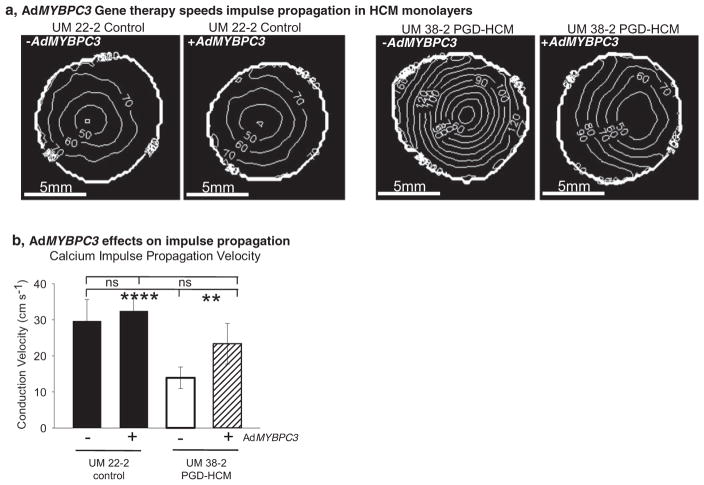
Isochronal maps in Fig. 8a indicate that impulse propagation in untreated HCM hESC-CM monolayers is ~50% slower than the control monolayers (Fig. 8b). AdMYBPC3 gene transfer improved impulse propagation in the HCM hESC-CM monolayers, which is indicated by increased spacing of the isochronal lines. Since monolayer conduction velocity depends in large part on cell-cell junctions, these results suggest that faster conduction velocity in the AdMYBPC3 gene transfer group may be associated with the observed normalization of Cx43 protein localization (Fig. 7b). Expression of SERCA2a does not appear to be involved in the rescue of affected phenotype (Supplemental Fig. 10).
Fig. 8.
Acute gene transfer of full length wtMYBPC3 speeds electrical impulse propagation in human purified HCM cardiac monolayers. a, Isochronal maps indicating activation times of pacemaker activations in four different experimental conditions. b, Quantification of calcium impulse conduction velocity shows that the untreated HCM monolayers had a significantly slower impulse conduction velocity than the other groups (untreated UM38-2 PGD-HCM = 13.9 ± 6.1 cm s−1, n = 6 compared to UM22-2 control untreated = 29.4 ± 6 cm s−1, n = 5 and UM22-2 control AdMYBPC3 treated = 32.4 ± 3.3 cm s−1, n = 5 and UM38-2 AdMYBPC3 treated = 23.4 ± 5.5 cm s−1, n = 5 monolayers). **** and ** denote significantly different means, One-way ANOVA, Newman-Keuls multiple comparisons test, α = 0.01, ns = not significant. Data were expressed as mean ± standard deviation.
4. Discussion
To date there have been no studies to understand the complex HCM pathogenesis occurring during cardiomyocyte development [32]. This is in part due to difficult and scarce access to human fetal material during the early stages of heart formation, which can be partially circumvented with in vitro cardiomyocyte differentiation. In this context, derivation and maintenance of pluripotent stem cells carrying native or induced mutation is fundamental [21–24].
By developing and using a hESC line harboring a MYBPC3 mutation we were able to study and define the earliest elements of the cardiomyocyte response to a sarcomere gene mutation, the primary hypertrophic stimulus. Our data indicate that the c.2905 + 1 G > A mutation of MYBPC3 produces a transient haploinsufficiency of full length cMyBP-C during early cardiomyogenesis in vitro (Fig. 2). Importantly this reduced cMyBP-C expression occurs while other myofilament proteins such as myosin are being expressed, cardiac sarcomeres formed and cells are beginning to contract. It is interesting to note that differences on levels of MYBPC3 cDNA were not noticeable. Further experimentation might be necessary to understand if cMyBP-C haploinsufficiency happens through a translational or post-translational mechanism.
However, by day 30 of directed differentiation, protein levels in the HCM line are not different from control cardiomyocytes, consistent with prior evidence from human heart tissue that there is compensatory up-regulation of cMyBP-C at least in some individuals [15]. Also, consistent with previous work [15], we observed inter-individual variability in cMyBP-C abundance in human heart tissue from individuals with c.2905 + 1 G > A mutation as indicated in Supplemental Fig. 2. Therefore, our data suggest either that hypertrophic remodeling may be induced at a very early stage by haploinsufficiency before adequate compensation for cMyBP-C occurs, or, alternatively, that dominant negative mechanisms may propagate disease pathogenesis despite adequate cMyBP-C levels.
We therefore tested the hypothesis that decreased levels of cMyBP-C during differentiation is responsible for cardiac hypertrophy and disarray in the early disease stage by acute gene transfer of wild-type human MYBPC3 during early cardiac-directed differentiation (Fig. 5). Expression of wild-type MYBPC3 during early cardiomyocyte differentiation prevented HCM structural (Figs. 6 and 7) and functional phenotypes (Fig. 8) in hESC-CM HCM similar to the observations of Mearini et al. [33]. Neonatal adenoviral reposition of wild-type cMyBP-C in transgenic mice carrying frameshift mutations in MYBPC3 prevented HCM phenotype and had long-term effects on cardiovascular health. [33] Complementarily to the reposition of MYBPC3 wild type to mutant cells, shRNA-mediated knock down of cMyBP-C expression in fully differentiated single cardiomyocytes recapitulated a contractile dysfunction observed in single cardiomyocytes derived from patient specific induced pluripotent lines without altering cell size [24] and may support a temporal role of cMYBP-C insufficiency for full display of HCM phenotype, or simply that multicellular preparations should be considered for observation of the main HCM hallmarks in vitro.
Collectively these data suggest that a transient haploinsufficiency in cMyBP-C protein expression may trigger early cellular and sub-cellular processes that incite a cascade of events ultimately leading to the mature form of disease with cardiac hypertrophy later in life and that can be aggravated by other factors, like dysregulation in endothelin-1 levels [23]. Other mechanisms related to ongoing production of truncated mutant proteins may also influence disease progression in the fully developed heart.
Similar alterations in cardiomyocyte biology were also reported in a zebrafish HCM model at the earliest stages of heart development and trigger secondary mechanisms such as calcium flux dysregulation predisposing to an arrhythmias [34]. Becker et al. [34] recapitulated human HCM with disruption of sarcomerogenesis and sarcomere disarray in zebrafish using morpholino antisense oligonucleotides targeting the exon 13 splice donor site in the cardiac troponin T gene (tnnt2). After recovery from morpholino treatment and restoration of normal tnnt2 expression, sarcomere disarray resolved suggesting that the structural abnormalities were reversible with cessation of mutant transcript expression. However, in a mammalian HCM model with persistent expression of mutant protein, myocyte and sarcomeric disarray persisted despite of pharmacologic reversal of the cardiac hypertrophy and fibrosis [35].
Recent evidence suggests that abnormal calcium handling underlies HCM pathology in a patient-specific induced pluripotent stem cell model with a MYH7 mutation [21,22]. Abnormal intracellular calcium homeostasis was also disrupted in the MYBPC3-mutation hESC-CM HCM model presented here (Fig. 5), suggesting a common pathogenic pathway with the MYH7 mutation model. [21,22] Additional investigation on the impact of cMyBP-C on calcium regulated proteins should be performed to determine because the functional rescue of AdMYBPC3 treated UM38-2 HCM does not seem to be related to change in the expression of SERCA2a (Supplemental Fig. 10). Furthermore, the MYBPC3-mutation hESC-CM monolayers presented rotors, which are an in vitro form of re-entry arrhythmia and data from purified monolayers showed slow conduction in HCM monolayers. The purified monolayers were plated on matrigel coated PDMS to enhance the maturation state of hESC-CMs [31], a common concern in the field that has been also addressed by others [24]. Also, this cell culture technique may decrease the variability observed in unpurified samples in which cardiomyocytes in different stages of differentiation co-exist with non-cardiomyocyte.
Therefore data suggests that HCM cardiomyocytes may be pro-arrhythmic in a multicellular environment, as is the case for the in vivo organ. Further, it is clearly evident in humans with HCM that arrhythmias only very rarely present in childhood, but rather most commonly occur in adulthood. Intrinsic cellular abnormalities in calcium handling, cell-cell connection abnormalities altering impulse propagation, and a subsequent final pathogenic mechanism, such as fibrosis development, may all ultimately combine to cause clinical arrhythmias in patients.
In summary, using a human embryonic stem cell model, we were able to demonstrate that MYBPC3-mutant HCM cardiomyocytes presented transient cMyBP-C haploinsufficiency associated with fundamental structural abnormality during early cardiac differentiation that triggers hypertrophy and creates an arrhythmogenic substrate.
Supplementary Material
Supplemental figure 1. a–d, Laser assisted derivation of hESC lines. e–g, Pluripotent stem cell characterization
Supplemental figure 2. Western blot analysis of cMyBP-C abundance in two human HCM heart tissue samples with the same c.2905+1 G>A mutation as the hESC-HCM model compared to healthy heart tissue from 3 donor heart controls. The human HCM samples came from surgical myectomy samples from individuals with typical HCM with severe asymmetric septal hypertrophy and left ventricular outflow tract obstruction. The HCM 1 sample comes from the same individual as previously published(15) who was 48 years old at the time of myectomy; the HCM 2 sample comes from a 17-year old individual who was a second-degree relative. HCM samples were averaged from 9 replicates each and the donor heart controls from 7 replicates.
Supplemental figure 3. Sarcomere structure in the UM38-2 PGD-HCM CMs compared to control. a, α-actinin staining of control CMs on day 17 of directed differentiation. b, time matched α-actinin immunostaining of UM38-2 PGD-HCM CMs. Nuclei are stained blue using DAPI. c, a 7 × 7 grid placed over the digital images was used to measure the length of each myofibril that made contact with adjacent evenly spaced dots on the grid. For six independent images of each control and HCM CMs 12–23 myofibrils/slide were measured. Average control myofibril length was 30.1±2.5μm, n=5 vs. 16.5±1.3μm, n=6 for UM 38-2 PGD HCM CMs. *P=0.006, student’s t-test.
Supplemental figure 4. Fast Fourier Transform (FFT) analysis of UM 22-2 control sarcomeres. FFT was performed on intensity profiles in the top third, middle and bottom third of each image. Average regularity index was calculated for each image based on the three values.
Supplemental figure 5. Fast Fourier Transform (FFT) analysis of UM 38-2 PGD-HCM sarcomeres. FFT was performed on intensity profiles in the top third, middle and bottom third of each image. Average regularity index was calculated for each image based on the three values.
Supplemental figure 6. Sarcomere structure in day 69 CMs shows the maintenance of sarcomere disorganization in the UM 38-2 PGD-HCM CMs. I band was stained using antibody again sarcomeric actin, UM 38-2 PGD HCM CMs have disorganized actin filaments.
Supplemental figure 7. N-cadherin plaque length measurement. Immunostaining of unpurified hESC-CM monolayers was performed with staining for Actin and N-cadherin, nuclei are blue (DAPI). The bottom panels show how N-cadherin plaque length was measured. In opposing connected cardiomyocytes (sarcomere actin +) the length of the N-cadherin immunocomplex was measured at 3 different locations and an average was made for each cell-cell junction. Example measurements are indicated by the white arrows.
Supplemental figure 8. cMyBP-C protein expression analysis after AdMYBPC3 gene transfer. adMYBPC3 was applied to differentiating CMs on day 12 and samples were collected for western bot analysis 2 days later (a) and 5 days later (a,b). UM 22-2 CMs were used as the control cell line. c, Quantification of M2-Flag/cMyBPC expression relative to control (p=0.001). Western blots for detection of M2-Flag and cMyBP-C were performed with a dual color detection system to allow precise determination of protein abundance.
Supplemental figure 9. a, wtcMyBP-C localization in the sarcomeric A-band. 7 days following gene transfer, M2 FLAG immunolocalization is found in each half of the A-band. Gene transfer promoted actin filament organization in the HCM disease cell line. b, AdMYBPC3 gene transfer prevented hypertrophy in the UM 38-2 PGD-HCM group. Data included here supplements quantification in figure 5 of main text. Here the cell size of the UM 14-1 control CMs that are time matched are included as an additional control. (UM 14-1 CM CSA=2,532.3±252.5μm2, n=119).
Supplemental figure 10. Western blot for detection of SERCA2a normalized to cardiac actin. Treatment with AdMYBPC3 did not altered significantly altered SERCA2a expression UM22-2 control, neither UM38-2 HCM
Acknowledgments
This work has been supported by grants from the University of Michigan Frankel Cardiovascular Center and Taubman Medical Institute, the Lefkofsky Family Foundation, the Charles Woodson Acceleration Award, the Fondation Leducq and NHLBI grants P01-HL87226 and R01122352.
Footnotes
Supplementary data to this article can be found online at http://dx.doi.org/10.1016/j.yjmcc.2016.09.004.
References
- 1.Maron BJ, Maron MS, Semsarian C. Genetics of hypertrophic cardiomyopathy after 20 years: clinical perspectives. J Am Coll Cardiol. 2012;60(8):705–715. doi: 10.1016/j.jacc.2012.02.068. [DOI] [PubMed] [Google Scholar]
- 2.Maron BJ, Gardin JM, Flack JM, Gidding SS, Kurosaki TT, Bild DE. Prevalence of hypertrophic cardiomyopathy in a general population of young adults: echocardiographic analysis of 4111 subjects in the CARDIA study. Circulation. 1995 Aug 15;92(4):785–789. doi: 10.1161/01.cir.92.4.785. (1995) [DOI] [PubMed] [Google Scholar]
- 3.Dhandapany PS, Sadayappan S, Xue Y, Powell GT, Rani DS, Nallari P, et al. A common MYBPC3 (cardiac myosin binding protein C) variant associated with cardiomyopathies in South Asia. Nat Genet. 2009;41(2):187–191. doi: 10.1038/ng.309. http://dx.doi.org/10.1038/ng.309. [DOI] [PMC free article] [PubMed] [Google Scholar]
- 4.Geisterfer-Lowrance AAT, Kass S, Tanigawa G, Vosberg HP, McKenna W, Seidman CE, et al. A molecular basis for familial hypertrophic cardiomyopathy: a β cardiac myosin heavy chain gene missense mutation. Cell. 1990;62(5):999–1006. doi: 10.1016/0092-8674(90)90274-i. [DOI] [PubMed] [Google Scholar]
- 5.Harris SP, Lyons RG, Bezold KL. In the thick of it: HCM-causing mutations in myosin binding proteins of the thick filament. Circ Res. 2011 Mar 18;108(6):751–764. doi: 10.1161/CIRCRESAHA.110.231670. (2011) [DOI] [PMC free article] [PubMed] [Google Scholar]
- 6.Harris SP, Bartley CR, Hacker TA, McDonald KS, Douglas PS, Greaser ML, et al. Hypertrophic cardiomyopathy in cardiac myosin binding protein-C knockout mice. Circ Res. 2002 Mar 22;90(5):594–601. doi: 10.1161/01.res.0000012222.70819.64. (2002) [DOI] [PubMed] [Google Scholar]
- 7.Herron TJ, Rostkova E, Kunst G, Chaturvedi R, Gautel M, Kentish JC. Activation of myocardial contraction by the N-terminal domains of myosin binding protein-C. Circ Res. 2006 May 26;98(10):1290–1298. doi: 10.1161/01.RES.0000222059.54917.ef. (2006) [DOI] [PubMed] [Google Scholar]
- 8.Herron TJ, Korte FS, McDonald KS. Power output is increased after phosphorylation of myofibrillar proteins in rat skinned cardiac myocytes. Circ Res. 2001 Dec 7;89(12):1184–1190. doi: 10.1161/hh2401.101908. (2001) [DOI] [PubMed] [Google Scholar]
- 9.Gautel M, Fürst DO, Cocco A, Schiaffino S. Isoform transitions of the myosin binding protein C family in developing human and mouse muscles: lack of isoform transcomplementation in cardiac muscle. Circ Res. 1998 Jan 23;82(1):124–129. doi: 10.1161/01.res.82.1.124. (1998) [DOI] [PubMed] [Google Scholar]
- 10.Hartzell HC, Glass DB. Phosphorylation of purified cardiac muscle C-protein by purified cAMP-dependent and endogenous Ca2+-calmodulin-dependent protein kinases. J Biol Chem. 1984 Dec 25;259(24):15587–15596. (1984) [PubMed] [Google Scholar]
- 11.Bennett P, Craig R, Starr R, Offer G. The ultrastructural location of C-protein, X-protein and H-protein in rabbit muscle. J Muscle Res Cell Motil. 1986 Dec 01;7(6):550–567. doi: 10.1007/BF01753571. (1986) [DOI] [PubMed] [Google Scholar]
- 12.Marston S. How do MYBPC3 mutations cause hypertrophic cardiomyopathy? J Muscle Res Cell Motil. 2012;33(1):75–80. doi: 10.1007/s10974-011-9268-3. [DOI] [PubMed] [Google Scholar]
- 13.Marston S, Copeland ON, Jacques A, Livesey K, Tsang V, McKenna WJ, et al. Evidence from human myectomy samples that MYBPC3 mutations cause hypertrophic cardiomyopathy through haploinsufficiency. Circ Res. 2009 Jul 31;105(3):219–222. doi: 10.1161/CIRCRESAHA.109.202440. (2009) [DOI] [PubMed] [Google Scholar]
- 14.Carrier L. Organization and sequence of human cardiac myosin binding protein C gene (MYBPC3) and identification of mutations predicted to produce truncated proteins in familial hypertrophic cardiomyopathy. Circ Res. 1997;80(3):427–434. [PubMed] [Google Scholar]
- 15.HAS, DFM, Coleman D, BSN, GAA, Pagani F, et al. Sarcomere mutation-specific expression patterns in human hypertrophic cardiomyopathy. Circ Cardiovasc Genet. 2014 Aug 1;7(4):434–443. doi: 10.1161/CIRCGENETICS.113.000448. (2014) [DOI] [PMC free article] [PubMed] [Google Scholar]
- 16.Vignier N, Schlossarek S, Fraysse B, Mearini G, Kramer E, Pointu H, et al. Nonsense-mediated mRNA decay and ubiquitin-proteasome system regulate cardiac myosin-binding protein C mutant levels in cardiomyopathic mice. Circ Res. 2009 Jul 31;105(3):239–248. doi: 10.1161/CIRCRESAHA.109.201251. [DOI] [PubMed] [Google Scholar]
- 17.Rottbauer W, Gautel M, Zehelein J, Labeit S, Franz WM, Fischer C, et al. Novel splice donor site mutation in the cardiac myosin-binding protein-C gene in familial hypertrophic cardiomyopathy. Characterization of cardiac transcript and protein. J Clin Invest. 1997;100(2):475–482. doi: 10.1172/JCI119555. [DOI] [PMC free article] [PubMed] [Google Scholar]
- 18.Barefield D, Kumar M, Gorham J, Seidman JG, Seidman CE, de Tombe PP, et al. Haploinsufficiency of MYBPC3 exacerbates the development of hypertrophic cardiomyopathy in heterozygous mice. J Mol Cell Cardiol. 2015;79(0):234–243. doi: 10.1016/j.yjmcc.2014.11.018. [DOI] [PMC free article] [PubMed] [Google Scholar]
- 19.McConnell BK, Jones KA, Fatkin D, Arroyo LH, Lee RT, Aristizabal O, et al. Dilated cardiomyopathy in homozygous myosin-binding protein-C mutant mice. J Clin Investig. 1999;104(9):1235–1244. doi: 10.1172/JCI7377. [DOI] [PMC free article] [PubMed] [Google Scholar]
- 20.Strande JL. Haploinsufficiency MYBPC3 mutations: another stress induced cardiomyopathy? Let’s take a look! J Mol Cell Cardiol. 2015;79(0):284–286. doi: 10.1016/j.yjmcc.2014.12.008. [DOI] [PubMed] [Google Scholar]
- 21.Lan F, Lee Andrew S, Liang P, Sanchez-Freire V, Nguyen Patricia K, Wang L, et al. Abnormal calcium handling properties underlie familial hypertrophic cardiomyopathy pathology in patient-specific induced pluripotent stem cells. Cell Stem Cell. 2013;12(1):101–113. doi: 10.1016/j.stem.2012.10.010. [DOI] [PMC free article] [PubMed] [Google Scholar]
- 22.Han L, Li Y, Tchao J, Kaplan AD, Lin B, Mich-Basso J, et al. Study familial hypertrophic cardiomyopathy using patient-specific induced pluripotent stem cells. Cardiovasc Res. 2014 Nov 1;104(2):258–269. doi: 10.1093/cvr/cvu205. [Research Support, N.I.H., Extramural Research Support, Non-U.S. Gov’t] [DOI] [PMC free article] [PubMed] [Google Scholar]
- 23.Tanaka A, Yuasa S, Mearini G, Egashira T, Seki T, Kodaira M, et al. Endothelin-1 induces myofibrillar disarray and contractile vector variability in hypertrophic cardiomyopathy-induced pluripotent stem cell-derived cardiomyocytes. J Am Heart Assoc. 2014 Dec;3(6):e001263. doi: 10.1161/JAHA.114.001263. [DOI] [PMC free article] [PubMed] [Google Scholar]
- 24.Birket MJ, Ribeiro MC, Kosmidis G, Ward D, Leitoguinho AR, van de Pol V, et al. Contractile defect caused by mutation in MYBPC3 revealed under conditions optimized for human PSC-cardiomyocyte function. Cell Rep. 2015 Oct 27;13(4):733–745. doi: 10.1016/j.celrep.2015.09.025. [Research Support, Non-U.S. Gov’t] [DOI] [PMC free article] [PubMed] [Google Scholar]
- 25.Masuelli L, Bei R, Sacchetti P, Scappaticci I, Francalanci P, Albonici L, et al. β-Catenin accumulates in intercalated disks of hypertrophic cardiomyopathic hearts. Cardiovasc Res. 2003 Nov 1;60(2):376–387. doi: 10.1016/j.cardiores.2003.08.005. (2003) [DOI] [PubMed] [Google Scholar]
- 26.Fraysse B, Weinberger F, Bardswell SC, Cuello F, Vignier N, Geertz B, et al. Increased myofilament Ca2+ sensitivity and diastolic dysfunction as early consequences of Mybpc3 mutation in heterozygous knock-in mice. J Mol Cell Cardiol. 2012 Jun;52(6):1299–1307. doi: 10.1016/j.yjmcc.2012.03.009. [DOI] [PMC free article] [PubMed] [Google Scholar]
- 27.van Dijk SJ, Paalberends ER, Najafi A, Michels M, Sadayappan S, Carrier L, et al. Contractile dysfunction irrespective of the mutant protein in human hypertrophic cardiomyopathy with normal systolic function. Circ Heart Fail. 2012 Jan;5(1):36–46. doi: 10.1161/CIRCHEARTFAILURE.111.963702. [DOI] [PubMed] [Google Scholar]
- 28.HTJ, Devaney E, Mundada L, Arden E, Day S, Guerrero-Serna G, et al. Ca2+-independent positive molecular inotropy for failing rabbit and human cardiac muscle by α-myosin motor gene transfer. FASEB J. 2010 Feb 1;24(2):415–424. doi: 10.1096/fj.09-140566. (2010) [DOI] [PMC free article] [PubMed] [Google Scholar]
- 29.Craig R, Offer G. The location of C-protein in rabbit skeletal muscle. Proc R Soc London, Ser B. 1976;192(1109):451–461. doi: 10.1098/rspb.1976.0023. [DOI] [PubMed] [Google Scholar]
- 30.Dubois NC, Craft AM, Sharma P, Elliott DA, Stanley EG, Elefanty AG, et al. SIRPA is a specific cell-surface marker for isolating cardiomyocytes derived from human pluripotent stem cells. Nat Biotechnol. 2011;29(11):1011–1018. doi: 10.1038/nbt.2005. http://dx.doi.org/10.1038/nbt.2005. [DOI] [PMC free article] [PubMed] [Google Scholar]
- 31.Herron TJ, Da Rocha AM, Campbell C, Ponce-Balbuena D, Willis C, Guerrero-Serna G, et al. Extracellular matrix mediated maturation of human pluripotent stem cell derived cardiac monolayer structure and electrophysiological function. Circ A&E. 2016 doi: 10.1161/CIRCEP.113.003638. (in press) [DOI] [PMC free article] [PubMed] [Google Scholar]
- 32.Moretti A, Laugwitz K-L, Dorn T, Sinnecker D, Mummery C. Pluripotent stem cell models of human heart disease. Cold Spring Harb Perspect Med. 2013 Nov 1;3(11) doi: 10.1101/cshperspect.a014027. (2013) [DOI] [PMC free article] [PubMed] [Google Scholar]
- 33.Mearini G, Stimpel D, Geertz B, Weinberger F, Kramer E, Schlossarek S, et al. Mybpc3 gene therapy for neonatal cardiomyopathy enables long-term disease prevention in mice. Nat Commun. 2014;5:5515. doi: 10.1038/ncomms6515. [DOI] [PubMed] [Google Scholar]
- 34.Becker JR, Deo RC, Werdich AA, Panàkovà D, Coy S, MacRae CA. Human cardiomyopathy mutations induce myocyte hyperplasia and activate hypertrophic pathways during cardiogenesis in zebrafish. Dis Models & Mechanisms. 2011 May 1;4(3):400–410. doi: 10.1242/dmm.006148. (2011) [DOI] [PMC free article] [PubMed] [Google Scholar]
- 35.Lombardi R, Rodriguez G, Chen SN, Ripplinger CM, Li W, Chen J, et al. Resolution of established cardiac hypertrophy and fibrosis and prevention of systolic dysfunction in a transgenic rabbit model of human cardiomyopathy through thiol-sensitive mechanisms. Circulation. 2009 Mar 17;119(10):1398–1407. doi: 10.1161/CIRCULATIONAHA.108.790501. (2009) [DOI] [PMC free article] [PubMed] [Google Scholar]
Associated Data
This section collects any data citations, data availability statements, or supplementary materials included in this article.
Supplementary Materials
Supplemental figure 1. a–d, Laser assisted derivation of hESC lines. e–g, Pluripotent stem cell characterization
Supplemental figure 2. Western blot analysis of cMyBP-C abundance in two human HCM heart tissue samples with the same c.2905+1 G>A mutation as the hESC-HCM model compared to healthy heart tissue from 3 donor heart controls. The human HCM samples came from surgical myectomy samples from individuals with typical HCM with severe asymmetric septal hypertrophy and left ventricular outflow tract obstruction. The HCM 1 sample comes from the same individual as previously published(15) who was 48 years old at the time of myectomy; the HCM 2 sample comes from a 17-year old individual who was a second-degree relative. HCM samples were averaged from 9 replicates each and the donor heart controls from 7 replicates.
Supplemental figure 3. Sarcomere structure in the UM38-2 PGD-HCM CMs compared to control. a, α-actinin staining of control CMs on day 17 of directed differentiation. b, time matched α-actinin immunostaining of UM38-2 PGD-HCM CMs. Nuclei are stained blue using DAPI. c, a 7 × 7 grid placed over the digital images was used to measure the length of each myofibril that made contact with adjacent evenly spaced dots on the grid. For six independent images of each control and HCM CMs 12–23 myofibrils/slide were measured. Average control myofibril length was 30.1±2.5μm, n=5 vs. 16.5±1.3μm, n=6 for UM 38-2 PGD HCM CMs. *P=0.006, student’s t-test.
Supplemental figure 4. Fast Fourier Transform (FFT) analysis of UM 22-2 control sarcomeres. FFT was performed on intensity profiles in the top third, middle and bottom third of each image. Average regularity index was calculated for each image based on the three values.
Supplemental figure 5. Fast Fourier Transform (FFT) analysis of UM 38-2 PGD-HCM sarcomeres. FFT was performed on intensity profiles in the top third, middle and bottom third of each image. Average regularity index was calculated for each image based on the three values.
Supplemental figure 6. Sarcomere structure in day 69 CMs shows the maintenance of sarcomere disorganization in the UM 38-2 PGD-HCM CMs. I band was stained using antibody again sarcomeric actin, UM 38-2 PGD HCM CMs have disorganized actin filaments.
Supplemental figure 7. N-cadherin plaque length measurement. Immunostaining of unpurified hESC-CM monolayers was performed with staining for Actin and N-cadherin, nuclei are blue (DAPI). The bottom panels show how N-cadherin plaque length was measured. In opposing connected cardiomyocytes (sarcomere actin +) the length of the N-cadherin immunocomplex was measured at 3 different locations and an average was made for each cell-cell junction. Example measurements are indicated by the white arrows.
Supplemental figure 8. cMyBP-C protein expression analysis after AdMYBPC3 gene transfer. adMYBPC3 was applied to differentiating CMs on day 12 and samples were collected for western bot analysis 2 days later (a) and 5 days later (a,b). UM 22-2 CMs were used as the control cell line. c, Quantification of M2-Flag/cMyBPC expression relative to control (p=0.001). Western blots for detection of M2-Flag and cMyBP-C were performed with a dual color detection system to allow precise determination of protein abundance.
Supplemental figure 9. a, wtcMyBP-C localization in the sarcomeric A-band. 7 days following gene transfer, M2 FLAG immunolocalization is found in each half of the A-band. Gene transfer promoted actin filament organization in the HCM disease cell line. b, AdMYBPC3 gene transfer prevented hypertrophy in the UM 38-2 PGD-HCM group. Data included here supplements quantification in figure 5 of main text. Here the cell size of the UM 14-1 control CMs that are time matched are included as an additional control. (UM 14-1 CM CSA=2,532.3±252.5μm2, n=119).
Supplemental figure 10. Western blot for detection of SERCA2a normalized to cardiac actin. Treatment with AdMYBPC3 did not altered significantly altered SERCA2a expression UM22-2 control, neither UM38-2 HCM


