

Abstract
Polymeric nanoparticles (NPs) are decorated with various types of molecules to control their functions and interactions with specific cells. We previously used polydopamine (pD) to prime-coat poly(lactic-co-glycolic acid) (PLGA) NPs and conjugated functional ligands onto the NPs via the pD coating. In this study, we report tannic acid (TA) as an alternative prime coating that is functionally comparable to pD but does not have drawbacks of pD such as optical properties and interference of ligand characterization. TA forms a stable and optically inert coating on PLGA NPs, which can accommodate albumin, chitosan, and folate-terminated polyethylene glycol to control the cell-NP interactions. Moreover, TA coating allows for surface loading of polycyclic planar aromatic compounds. TA is a promising reactive intermediate for surface functionalization of polymeric NPs.
Keywords: Tannic acid, polymeric nanoparticles, surface functionalization, drug delivery
Graphical Abstract
1. Introduction
Polymeric nanoparticles (NPs) are widely pursued as a target-specific carrier of anti-cancer drugs. NP surface is modified with functional compounds to control their interactions with specific cells or to provide the NPs with additional functions. However, it is technically challenging to functionalize the NPs because most polymeric NPs have a limited number of reactive groups on the surface. Typically, surface modification of polymeric NPs is done by chemical reactions involving coupling agents and exhaustive purification steps, which are detrimental to drug retention in NPs. Surface-modified NPs may also be produced with prefunctionalized polymers, but ligand conjugation may change the properties of original polymers to compromise drug encapsulation. As a potential solution to these challenges, mussel-inspired surface modification method has received increasing attention in recent years. Polydopamine (pD), formed by oxidative polymerization of dopamine at alkaline pH, deposits on surfaces and binds with amine- or thiol-terminated compounds to form a functional coating.1 Due to the simplicity and versatility, dopamine self-polymerization method has been applied to various types of inorganic and organic substrates.2 We have previously shown that poly(lactic-co-glycolic acid) (PLGA) NPs could be functionalized with various ligands such as folate, TAT peptide, chitosan, synthetic polymers,3–5 and iron oxide particles6 via the pD coating.
Nevertheless, several drawbacks limit broader application of the pD-based surface modification technique: First, the dark-colored pD coating absorbs a broad spectrum of light and thus alters optical properties of NPs.7, 8 This can be a substantial impediment to applications involving optical detection or evaluation of pD-based NPs. Second, abundant amine groups in pD interfere with quantification of functionalized ligands such as proteins and peptides and make it difficult to characterize the NPs. Third, dopamine polymerization requires alkaline conditions which can be detrimental to the activity of encapsulated drugs or the stability of polymer structures. In addition, the high cost and potential concern for residual bioactivity of dopamine may hinder commercial translation of the pD-based nanocarriers.
Recently, several plant-derived polyphenolic compounds have been identified as alternative surface modifiers.9 Similar to pD, plant phenols and polyphenols such as tannic acid (TA), pyrogallol, and epigallocatechins gallate bind to organic and inorganic surfaces and provide reactive layers.9–11 These polyphenols interact with each other via covalent and noncovalent interactions to form oligomers, deposit on solid surfaces, and accommodate thiol- or amine-terminated molecules.9 They are inexpensive, non-toxic, and able to form coatings at neutral pH and, thus, avoid most of the aforementioned shortcomings of pD coating.12 TA is particularly promising due to the efficiency of coating formation and the versatility of molecular interactions. TA undergoes oxidation-induced oligomerization at pH 7 to form a colorless coating with similar thickness as pD.9 Each TA molecule has 25 hydroxyl groups to facilitate hydrogen bond interactions with other molecules.13 TA coating is negatively charged at neutral pH due to a large number of galloyl groups14 and can thus interact with cationic molecules via electrostatic interactions. Moreover, multiple aromatic rings of TA mediate interactions with hydrophobic molecules. With combinations of intermolecular interactions, TA coating is expected to attract a wide range of ligand molecules, thereby serving as a versatile platform for surface functionalization.
TA has been utilized in many biomedical applications. TA was used to stabilize collagen chains via hydrogen bonding and hydrophobic interactions and protect the collagen structures from enzymatic degradation.15–17 TA can also crosslink DNA via interactions with phosphate groups18 or PEG via hydrogen bonds,19 forming a mucoadhesive and biodegradable hydrogel for biomedical applications. In addition, TA was used as a polyanion component in Layer-by-Layer (LbL) particle or film formulations20–23 or to modify the surface of inorganic NPs such as gold, 24–26 cobalt ferrite,27 and silica.28 However, TA has not been fully investigated as a reactive layer for surface modification of polymeric NPs.
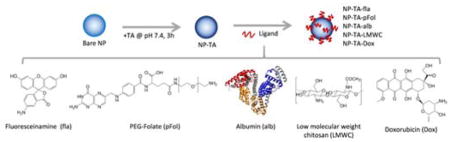
In this study, we investigate the potential of TA to serve as a reactive surface coating for polymeric NPs. We hypothesize that TA will form a non-toxic and optically inert coating that can incorporate diverse groups of molecules to provide additional functionality to polymeric NPs. We first determine the properties of TA-coated PLGA NPs (NP-TA) and conjugate with fluoresceinamine (small molecule), folate-conjugated and amine-terminated PEG (synthetic polymer), albumin (protein), and chitosan (polysaccharide) on NPs via TA. In addition, aromatic or heteroaromatic compounds are loaded on the NP surface based on their affinity for TA coating. The surface-modified NPs are characterized with respect to their interactions with target cells. Our results demonstrate that TA provides a versatile platform to conjugate functional ligands and load aromatic compounds on polymeric NPs.
2. Materials and methods
2.1. Materials
PLGA (150 kDa, LA:GA=85:15, ‘PLGA150’), PLGA-FITC (AV01, 7 kDa, LA:GA=50:50, ‘PLGA*’), PLGA-rhodamine B (AV011, 30kDa, LA:GA=50:50, ‘PLGA#’) were purchased from Akina Inc. (West Lafayette, IN, USA). Fluorescently-labeled polystyrene (PS*) NPs (Fluoresbrite) with carboxylate end groups and an average diameter of 200 nm and polyvinyl alcohol (PVA) with a molecular weight (MW) of 6,000 Da were purchased from Polysciences, Inc. (Warrington, PA, USA). Folate-conjugated and amine-terminated PEG (5 kDa, pFol) were purchased from Nanocs Inc. (New York, NY, USA). Tannic acid, fluoresceinamine HCl, chitosan (90–150 kDa), rhodamine B, proflavine, human serum albumin, and PVA (MW 30,000–70,000 Da) were purchased from Sigma-Aldrich (St. Louis, MO, USA). Doxorubicin hydrochloride salt was purchased from LC Labs (Woburn, MA, USA). Dopamine HCl was purchased from Alfa-Aesar (Ward Hill, MA, USA). Pierce BCA protein assay and CBQCA protein assay kit were purchased from Thermo Scientific (Waltham, MA, USA). (3-(4,5-Dimethylthiazol-2-yl)- 2,5-diphenyltetrazolium bromide) (MTT) was purchased from Invitrogen (Eugene, OR, USA). Hoechst 33342 was purchased form Life Technologies (Carlsbad, CA, USA). LMWC was prepared by degrading chitosan as previously described.29
2.2. Preparation of PLGA NPs and TA- or pD-coated NPs (NP, NP-TA, NP-pD)
PLGA NPs were prepared via the single emulsion-solvent evaporation method. Briefly, 100 mg of PLGA, PLGA*, or PLGA# were dissolved in dichloromethane (DCM, 10 mL for PLGA, and 5 mL for PLGA* or PLGA#) and emulsified in 20 mL of water containing 4% PVA (MW 6,000 Da) using a Vibra-Cell probe sonicator (Sonics, Newtown, CT, USA) at 45% amplitude with a 4-s on and 2-s off duty cycle. The emulsion was dispersed in 30 mL of water, stirred for 2 h, and evaporated for 30 min to remove DCM. PLGA NPs were collected by centrifugation at 33,000 rcf and washed 3 times with water to remove trace DCM and PVA. PLGA NPs, PLGA* NPs, and PLGA# NPs were called NP, NP*, and NP#, respectively.
For the preparation of TA-coated PLGA NPs (NP-TA), the purified PLGA NPs were dispersed to 0.5 mg/mL in bicine buffer (100 mM, pH 7.4) containing 0.07 mg/mL of TA. For the pD- coated NPs (NP-pD), PLGA NPs were dispersed to 1 mg/mL in Tris buffer (10 mM, pH 8.5) containing 1 mg/mL of dopamine HCl. These NPs were incubated in each solution for 3 h at room temperature with stirring, collected by centrifugation and washed once with water.
2.3. Determination of TA content
The presence of TA on NP surface was visually confirmed with AgNO3 according to the literature.9 Bare NP or NP-TA were incubated overnight in 100 mM AgNO3 aqueous solution with shaking and collected by centrifugation. The NPs were washed once with water to remove excess AgNO3 and observed with a FEI Tecnai T20 transmission electron microscope (OR, USA). NPs were negatively stained with 1% phosphotungstic acid.
The TA coating on NP surface was quantified by the bicinchoninic acid (BCA) assay. NP-TA was incubated in the BCA working reagent for 1 h at 37 °C. A supernatant was separated from the suspension by centrifugation, and its absorbance was read at 562 nm using a SpectraMax M3 microplate reader (Molecular Device, Sunnyvale, CA). The TA content in NP-TA was determined based on the absorbance difference between the NP-TA and bare NP and a calibration curve drawn with standard TA solutions. Alternatively, the TA content was determined indirectly by measuring the TA concentration before and after incubation with NPs and subtracting the remaining TA from the originally used TA.
2.4. Stability of TA coating
To determine whether the TA coating remained stable in aqueous medium, 0.5 mg of NP-TA was dispersed in 1 mL of water or phosphate buffer (pH 7.4, 0.2 M) and shaken at 37 °C for 24 h. NP-TA were collected by centrifugation at 16,000 rcf for 45 minutes, and the TA content in the collected NPs was determined by the BCA assay. Initial TA content was determined with another set of NP-TA that had been dispersed in water and immediately centrifuged.
To predict the stability of the TA coating in blood, NP-TA were dispersed in PBS or in 50% fetal bovine serum (FBS) diluted with PBS at a concentration of 1 mg/mL and incubated at 37 °C with gentle shaking. After 24 h, NP-TA were collected by centrifugation and washed with DI water to remove FBS. The collected NP-TA were incubated overnight in 100 mM AgNO3 solution with shaking with monitoring the color change due to the TA-induced Ag reduction.
2.5. Cytotoxicity of TA and NP-TA
NIH/3T3 fibroblasts (ATCC, Manassas, VA, USA) were cultured in Dulbecco’s modified Eagle medium (DMEM) supplemented with 10% fetal calf serum and 100 units/ml of penicillin and 100 μg/ml of streptomycin. The cells were seeded in 96-well plate at a density of 10,000 cells per well, grown overnight, and treated with free TA at a final concentration of 1–80 μg/mL or NP-TA at a final concentration of 0.01–100 μg/mL for 72 h. The MTT reagent and stop/solubilization solution were sequentially added with a 3.5 h interval. The concentration of solubilized formazan was measured at 529 nm using a SpectraMax M3 microplate reader. The cell viability was normalized to the absorbance of non-treated control cells.
2.6. Effect of TA coating on fluorescence intensity of NPs
To compare the effect of coating materials on fluorescence intensity of NP, NP# or PS* NP were incubated in TA solution (pH 7.4, 100 mM bicine buffer) or dopamine solution (pH 8.5, 10 mM Tris buffer) of different concentrations. The NP suspensions were sampled at different time points, and their fluorescence intensities were measured with a SpectraMax M3 microplate reader (λex/λem = 540 nm/620 nm for NP#; λex/λem = 441nm/486 nm for PS* NP).
2.7. Surface functionalization of NP-TA
The surface of NP-TA or NP-pD was modified with different ligands, such as fluoresceinamine (fla), folate-conjugated and amine-terminated PEG (pFol), albumin, or low molecular weight chitosan (LMWC). Specifically, fla-conjugated NPs were prepared by incubating 0.4 mg of NP-TA or NP-pD in 1 mL of 15 μg/mL fla solution in Tris buffer (10 mM, pH 8.5, 15 μg/mL) for 40 min. PEG-folate (pFol)-conjugated NPs were prepared by incubating 2 mg of NP-TA in 1 mL of 4 mg/mL pFol solution (pH 7.4, 100 mM bicine buffer) for 30 min. Albumin-conjugated NPs were produced by incubating 2 mg of NP-TA or NP-pD in 5 mg/mL albumin solution in bicine buffer (100 mM, pH 7.4) or Tris buffer (10 mM, pH 8.5), respectively, for 3 h. LMWC-conjugated NPs were produced by incubating 1 mg of NP-TA or NP-pD in 1 mL of 0.4 mg/mL LMWC solution (pH 7.4) for 30 min. All NPs were purified by centrifugation, washed twice with water, freeze-dried and stored at 4 °C until used. The modified NPs were called NP-TA-fla or NP-pD-alb, etc, according to the coating (TA or pD) and the ligand (fla, pFol, albumin, or LMWC).
2.8. Ligand content in surface-functionalized NPs
Fla conjugated to NP-TA-fla was quantified indirectly. After incubation with NP-TA, fla solution was separated by centrifugation at 16,000 rcf, and the fla absorbance in the supernatant was measured at 497 nm using a SpectraMax M3 microplate reader and compared with the absorbance before the incubation. The fla content per NP was calculated as: (originally used fla - remaining fla)/NP-TA-fla.
The amount of pFol conjugated to NP-TA-pFol was quantified similarly. The supernatant was collected by centrifugation at 33,900 rcf, and pFol in the supernatant was quantified by HPLC (1100 series, Agilent Technologies, Palo Alto, CA, USA) equipped with an Ascentis C18 column (25 cm × 4.6 mm, particle size 5 μm) (Supelco, St. Louis, MO, USA). The mobile phase was a mixture of acetonitrile and water (40:60) and run at 0.5 mL/min. pFol was detected at 280 nm.
The albumin content in NP-TA-alb was determined directly using the CBQCA protein assay (Life Science, NY, USA), which determines the protein concentration based on the production of fluorescent products measurable at λex/λem=450 nm/550 nm via non-covalent interaction between CBQCA and primary aliphatic amines of proteins.30 NP-TA and NP-TA-alb were suspended in borate buffer (0.1 M, pH 9.3) to 10 mg/mL and analyzed with the CBQCA assay. The albumin content in NP-TA-alb was calculated based on the difference in fluorescence between NP-TA-alb and NP-TA and a calibration curve drawn with standard albumin solutions.
The LMWC content in NP-TA-LMWC was determined directly by the ninhydrin assay with some modification of the previously described method.29, 31 1.5 mg of NP-TA or NP-TA-LMWC were dispersed in 0.5 mL of water, mixed with 0.5 mL of a freshly prepared ninhydrin reagent, incubated in a boiling water bath for 20 min, and quenched on ice. Samples were then mixed with 0.5 mL of ethanol and centrifuged for 20 min at 16,000 rcf to separate a supernatant. The absorbance of the supernatant was measured at 570 nm. The LMWC content in NP-TA-LMWC was calculated based on the absorbance difference between NP-TA-LMWC and NP-TA and a calibration curve prepared with standard LMWC solutions treated in the same way.
2.9. Functionality of surface-functionalized NPs
NP-TA-pFol was evaluated with respect to the folate-mediated cellular uptake. KB carcinoma cells (ATCC) were seeded in a 24-well plate at a density of 50,000 cells per well and cultured overnight in folate-free RPMI 1640 medium complemented with 10% FBS, 100 units/mL penicillin and 100 μg/mL streptomycin. KB cells were incubated with 0.2 mg/mL of NP#, NP#-TA, or NP#-TA-pFol in 10% FBS-supplemented complete medium. To confirm that NP uptake was mediated by folate receptor, folic acid was added to the medium at a final concentration of 0.5 mM simultaneously with NP#-TA-pFol. After 3 h incubation, cells were harvested, and their fluorescence intensities were analyzed by a BD Accuri C6 Flow Cytometer (BD Bioscience, Bedford, MA,USA) with an FL-2 detector (λex/λem=585 nm/625 nm). A total of 10,000 gated events were acquired for each analysis. All experiments were performed in triplicate.
NP-TA-alb was evaluated by observing their translocation across the endothelial cell layer. A Transwell insert with a polycarbonate membrane filter (0.4 μm pore), pre-coated with collagen-I (Gibco, Carlsbad, CA, USA), was suspended over a well of a 12-well plate (Corning®, NY, USA). Human umbilical vein endothelial cells (HUVEC) were seeded in each insert at a density of 60,000 cells per insert. The apical and basolateral side were supplied with 0.5 mL and 1.5 mL of a complete EGM-2 medium (Lonza, Walkersville, MD, USA), respectively, and replaced with fresh medium every other day. Transepithelial electric resistance (TEER) across the Transwell was measured daily with an EVOM2™ Epithelial Voltohmmeter (World Precision Instruments, Sarasota, FL, USA) to test the integrity of HUVEC layer.32 When the TEER value reached a plateau (i.e., when the HUVEC layer was confluent, typically 9 days after seeding), 50 μg of bare NP* or NP*-TA-alb were added to the apical side of the Transwell and incubated for 6 h. Subsequently, media in apical and basolateral sides were collected, and their fluorescence intensity was measured using a Synergy 4 Multi-Mode Microplate Reader (BioTek, Winooski, VT). The NP* or NP*-TA-alb in the medium of each side was determined using calibration curves drawn with each type of NPs suspended in the complete EGM-2 medium.
NP-TA-LMWC was evaluated by their interaction with cells at acidic pH. NP-TA-LMWC were incubated with SKOV-3 human ovarian cancer cells (ATCC, Manassas, VA, USA) at different pHs, and their cellular uptake examined. SKOV-3 cells were grown in RPMI 1640 medium complemented with 10% FBS and 100 units/mL of penicillin and 100 μg/mL of streptomycin. The cells were seeded in 35-mm glass-bottomed dishes at 500,000 cells per dish. Next day, the culture medium was replaced with the medium containing 0.1 mg/mL of NP*-TA or NP*-TA-LMWC with pH pre-adjusted to 7.4 or 6.2. After 3 h incubation, the NPs were removed, and the cells were washed once with fresh medium at corresponding pH (7.4 or 6.2), treated with Hoechst 33342 nuclear staining dye for 20 min, and imaged with a Nikon-A1R confocal microscope (Nikon America Inc., NY, USA). The NPs were excited with a 488 nm laser (λem = 500–550 nm), and the nuclei with a 407 nm laser (λem = 425 to 475 nm).
2.10. Drug loading on NP-TA
Three aromatic or heteroaromatic compounds, doxorubicin (Dox), proflavine (Pfv), and rhodamine B (RhoB) were used to evaluate their affinity for the TA coating. A varying amount of NP-TA were mixed with a fixed level of Dox (8 μg), Pfv (2 μg) or RhoB (2 μg) in deionized (DI) water and incubated for 1 h at 37 °C. The supernatants were separated by centrifugation at 34,000 rcf for 30 min, and Dox, Pfv, and RhoB remaining in the supernatant was quantified by measuring the absorbance at 490 nm, 440 nm, and 550 nm, respectively. The amount of each compound bound to NP-TA was determined by subtracting the amount in the supernatant from the initially used amount. The loading content was defined as the amount of a compound bound to NP-TA/the mass of NP-TA. Cytotoxicity of NP-TA-Dox was evaluated with MCF7 human breast cancer cell line and 4T1 murine breast cancer cell line by the MTT assay. Briefly, the cells were grown in RPMI 1640 medium supplemented with FBS and antibiotics and seeded in a 96-well plate at a density of 15,000 (MCF7) or 10,000 (4T1 cells) per well. After overnight, the cells were treated with free Dox, NP-TA, or NP-TA-Dox for 6 h or 48 h. MTT assay was performed after additional 42 h incubation in the treatment-free medium following the 6 h treatment or immediately after the 48 h treatment.
2.11. NP characterization
The size and zeta potential of all NPs were measured with a Malvern Zetasizer Nano ZS90 (Worcestershire, UK). NP morphology was observed by TEM. An NP suspension (~1 mg/mL) was spotted on formvar-coated carbon grid (400 mesh), negatively stained with 2% uranyl acetate, and visualized with a FEI Tecnai T20 transmission electron microscope.
3. Results
3.1. Preparation and characterization of NP-TA
Size and zeta potential of NPs used in this study are summarized in Table 1. Of note, the particle sizes measured by DLS are generally larger than those estimated by TEM (range: 80–158 nm, average diameter: 110 nm) due to the varying degrees of aggregation following repeated washing and centrifugation. NP-TA that had been freeze-dried and redispersed in phosphate buffer showed an average particle size of 224 nm in diameter with a PI of 0.19, which indicates mid-range polydispersity.33 Unlike dark NP-pD suspension, NP-TA suspension had no detectable color, similar to bare NP (Fig. 1b). Despite the similar appearance, NP-TA showed a more negative charge than bare NP indicating the presence of galloyl (trihydroxyphenyl) groups of TA coating. Under TEM, NP-TA showed a thin wrinkled layer on the surface in contrast to the smooth surface of bare NP (Fig. 1c). The TA coating was also confirmed by Ag deposition. NP-TA incubated in AgNO3 showed characteristic brown color unlike bare NP treated identically (Fig. 1d insets), which indicated the formation of metallic Ag due to the redox reaction between Ag+ and TA. The metallic Ag deposition was shown as electron-dense aggregates on the NP-TA surface by TEM (Fig. 1d). Bare NP incubated with AgNO3 did not show such deposition. The thin TA layer did not significantly contribute to the particle size according to DLS. TA was quantified by BCA assay, based on the TA-induced reduction of cupric ions to cuprous ions forming a colored complex with BCA.34 The TA content in NP-TA was estimated to be 2.8 ± 0.3 wt% by the direct measurement and 3.2 ± 0.6 wt% by the indirect method.
Table 1.
Size and zeta potential of NPs
| Name | Description | Z-average (d, nm) | Polydispersity index (PI) a | Zeta potential (mV) b |
|---|---|---|---|---|
| NP | Bare PLGA NPs | 207 ± 28 (n=6) | 0.13 ± 0.02 (n=6) | −4.2 ± 0.9 (n=4) |
| NP-TA | TA-coated NPs | 224 ± 30 (n=3) | 0.19 ± 0.04 (n=3) | −19.2 ± 5 (n=5) |
| NP-pD | pD-coated NPs | 216 ± 30 (n=9) | 0.21 ± 0.13 (n=7) | −7.1 ± 1.8 (n=6) |
| NP-TA-pFol | PEG-folate-conjugated NP-TA | 155.4 ± 0. 5 (n=3) | 0.10 ± 0.04 (n=3) | −4.6 ± 0.3 (n=3) |
| NP-TA-alb | Albumin-conjugated NP-TA | 196 ± 30 (n=7) | 0.15 ± 0.06 (n=7) | −11.5 ± 3.3 (n=5) |
| NP-TA-LMWC | LMWC-conjugated NP-TA | 215 ± 5 (n=3) | 0.18 ± 0.15 (n=3) | −5.2 ± 0.4 (n=3) |
PI, an estimate of the width of the particle size distribution, obtained from the cumulant analysis as described in the International Standard on DLS ISO 13321:1996 and ISO 22412:2008 (Malvern DLS technical note MRK1764-01). PI < 0.1 is considered monodisperse, and >0.7 very broad.33, 35
Zeta potential measured in phosphate buffer (2.2 or 5 mM, pH 7.4), except for NP-TA-LMWC, which was measured in MES buffer (5 mM, pH 6.2)
Fig. 1.

(a) Structure of tannic acid (TA). (b) Appearance of suspensions of bare NP (NP), NP-TA, and NP-pD. All samples contain 1.7 mg/mL NPs. (c) Transmission electron microscopy (TEM) images of NP and NP-TA (negatively stained with 2% uranyl acetate). (d) NP and NP-TA after incubation in 100 mM AgNO3 solution. The presence of TA is indicated by the brown color of NP suspension (inset) due to the deposition of metallic Ag. Electron-dense metallic Ag is seen as dark deposits on NP-TA surface in the TEM image (negatively stained with 1% phosphotungstic acid).
3.2. Stability and cytotoxicity of NP-TA
NP-TA maintained 70% of their TA coating after 24 h incubation in water at 37 °C (Fig. 2a). The 30% loss accounts for the loosely bound TA. The same level of TA was maintained in 0.2 M phosphate buffer, indicating that salts in the buffer did not affect the TA coating. The particle size of NP-TA remained constant over 24 h in phosphate buffer (10 mM, pH 7.4) at 37 °C (Fig. 2b). After incubation in 50% FBS for 24 h, NP-TA maintained the same size distribution (Supporting Fig. 1) and the TA coating, confirmed by the development of brown color in AgNO3 solution (Fig. 2c). Free TA or TA-coating did not induce cytotoxicity in NIH/3T3 fibroblasts for 72 h (Fig. 3). There was no significant difference between NP-TA and bare NP at all concentration levels tested.
Fig. 2.
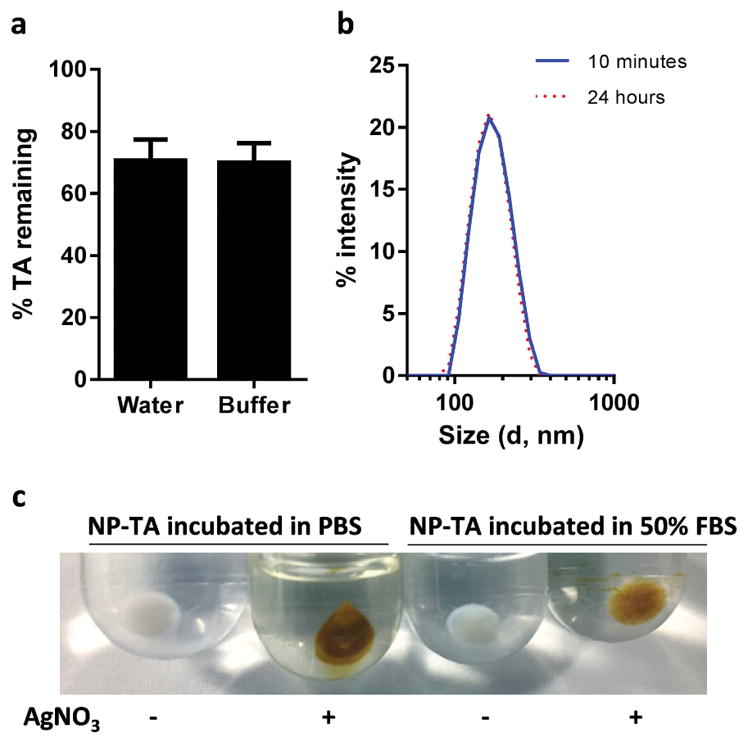
(a) Stability of TA coating: % TA remaining after incubation of NP-TA in water or phosphate buffer (pH 7.4, 0.2 M) for 24 h at 37 °C. (b) Particle size distribution of NP-TA after incubation in phosphate buffer (pH 7.4, 10 mM) at 37 °C for 10 min and 24 h. (c) Pellets of NP-TA after incubation with (+) or without (-) AgNO3. NP-TA were incubated in PBS or 50% FBS for 24 h and washed with DI water prior to the AgNO3 treatment.
Fig. 3.

Cytotoxic effect of (a) free TA and (b) NP and NP-TA on NIH/3T3 fibroblasts after 72 h of exposure.
3.3. Effect of TA coating on fluorescence intensity of NPs
The fluorescence intensity of NP# was examined during the incubation in TA or dopamine solutions. NP# suspended in TA solution maintained constant fluorescence over 3 h (Fig. 4a). In contrast, NP# in dopamine solution showed rapid decrease in fluorescence intensity in 3 h as pD deposited on the NP surface (Fig. 4b). The extent of fluorescence change increased with the dopamine concentration. The same trend was seen with PS* NP (Supporting Fig. 2). This result shows that TA coating does not interfere with the optical properties of core NPs unlike pD coating.
Fig. 4.
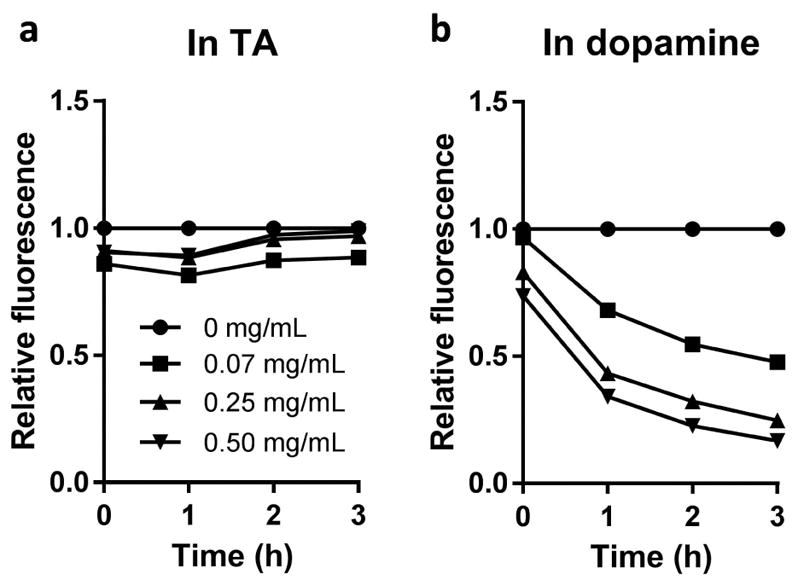
Changes in fluorescence intensity of NP# incubated in different concentrations of (a) TA solution (pH 7.4, 100 mM bicine buffer) or (b) dopamine solution (pH 8.5, 10 mM Tris buffer). Fluorescence intensity at each time point was normalized to that of the NP# solution with no TA or dopamine.
3.4. Surface functionalization of NP-TA
To test the feasibility of TA coating as an adhesive layer for NP functionalization, we modified NP-TA with various model ligands such as fla, pFol, albumin, and LMWC, and examined their properties and ligand-specific functionalities. Fla was chosen as a model small molecule ligand, readily conjugated to NP-pD via amine in our previous study 3. NP-TA showed a comparable fla conjugation efficiency as NP-pD: fla contents in NP-TA-fla and NP-pD-fla were 0.22 ± 0.06 wt% (0.21 ± 0.06 fla per nm2) and 0.17 ± 0.02 wt% (0.16 ± 0.01 fla per nm2), respectively.
NP-TA-pFol showed a smaller size than NP-TA by DLS because pFol layer helped disperse the NPs in water. NP-TA-pFol showed a less negative charge than NP-TA as the negative TA surface was shielded by pFol. When pFol was added to NP-TA varying the quantity, the pFol incorporated to 1 mg NP-TA reached a plateau at 50 μg (Fig. 5a), i.e., 5 wt%, indicating that 0.2 pFol molecules were incorporated per nm2 at most. At this density, the mean distance (D) between two neighboring PEG molecules was estimated to be 2.26 nm according to the calculation by Yuan et al.36 With a D smaller than RF (6 nm, the Flory radius of pFol), pFol chains on the surface of NP-TA-pFol were considered to have a brush-like conformation.37 The functionality of NP-TA-pFol was evaluated based on NP uptake by KB cells. NP#-TA-pFol showed higher cellular uptake by KB cells than bare NP# or NP#-TA (Fig. 5b). The uptake was inhibited by free folic acid (0.5 mM), indicating that NP#-TA-pFol uptake by KB cells was mediated by the folate receptor. A slight increase in cellular uptake of NP#-TA may be due to the non-specific interaction of NP#-TA with KB cells.
Fig. 5.
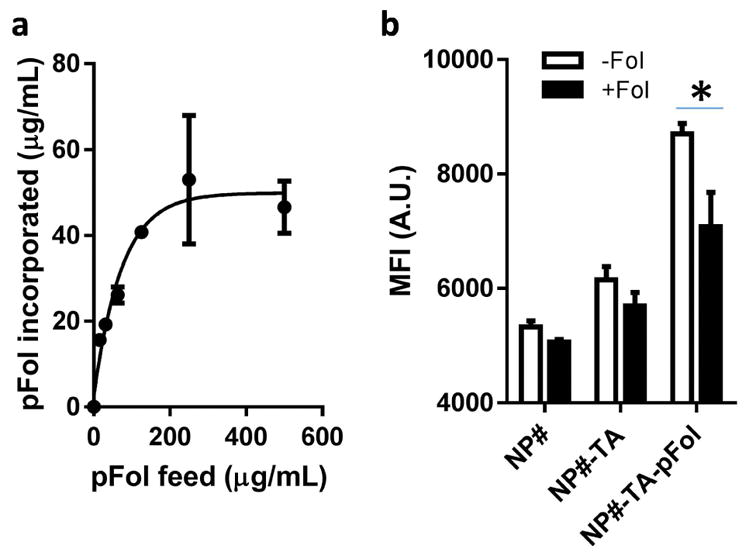
(a) Relationship between pFol feed vs. incorporated amount of pFol on NP-TA. Data are expressed as averages and standard deviations of 3 identically and independently prepared batches. (b) Mean fluorescence intensity (MFI, arbitrary unit) of KB cells incubated with NP#, NP#-TA, and NP#-TA-pFol with and without extra folic acid (0.5 mM). Data are expressed as averages and standard deviations of 3 measurements of a representative data set. *: p<0.01 by the Sidak’s multiple comparisons test.
NP-TA-alb had a similar size as NP-TA but showed a less negative charge than NP-TA due to the albumin coverage. The albumin content in NP-TA-alb was 1.1 ± 0.5 wt%, which translates to 0.44 ± 0.2 albumin per 100 nm2 (Fig. 6a). In contrast, NP/alb, in which albumin was physisorbed to bare NP, had 0.4 ± 0.07 wt% albumin, i.e., 0.15 ± 0.03 albumin per 100 nm2. This confirms the essential role of TA as an adhesive layer to conjugate albumin. To test the functionality of surface-conjugated albumin, we examined the translocation of NP*-TA-alb across the HUVEC layer. HUVEC formed a confluent monolayer in 9 days as determined by TEER measurement (Supporting Fig. 3). Compared to bare NP, NP-TA-alb remained less on the apical side and translocated more to the basolateral side (Fig. 6b), indicating that the surface-bound albumin helped transport the NPs across the HUVEC layer.
Fig. 6.
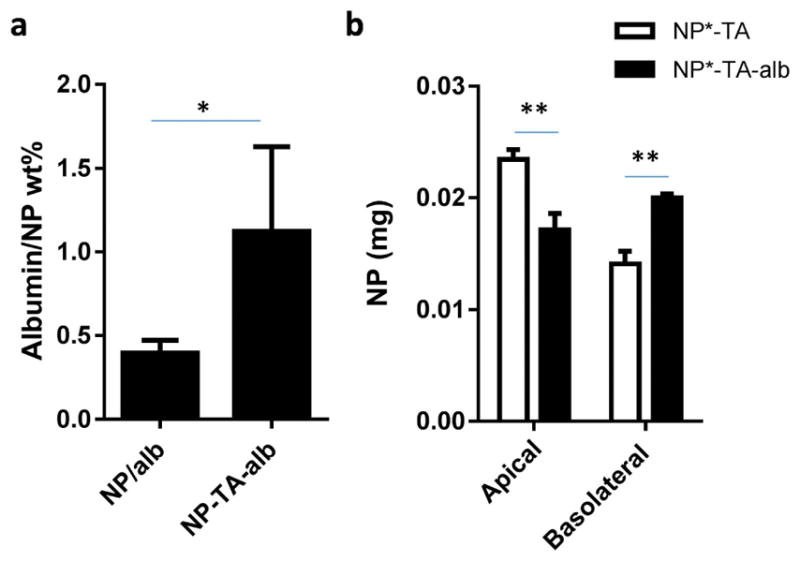
(a) Albumin contents in NP/alb (albumin physisorbed to NP, n=5) and NP-TA-alb (albumin bound to NP via TA coating, n=8). Data are expressed as averages ± standard deviation. *: p<0.05 by two-tailed t-test. (b) The effect of the surface-bound albumin on NP migration across HUVEC layer. **: p<0.01by Sidak’s multiple comparisons test.
NP-TA-LMWC showed a negative charge (−5.2 mV) at pH 7.4 and positive charge (9.9 mV) at pH 6.2 unlike NP-TA that showed negative charges at both pHs (Fig. 7a), indicating the presence of pH-sensitive LMWC on the surface. The LMWC content in NP-TA-LMWC was 6.9 ± 0.6 wt% (corresponding to 0.4 LMWC/nm2), comparable to that of NP-pD-LMWC (4.7 ± 3 wt%).4 NP-TA-LMWC showed the pH-dependent cellular interactions (Fig. 7b). Neither NP-TA nor NP-TA-LMWC showed interactions with SKOV-3 cells at pH 7.4 for 3 h. On the other hand, NP-TA-LMWC were observed on the cell membrane and some in the cytoplasm of SKOV-3 cells at pH 6.2, presumably via electrostatic interactions with the negatively-charged cell membrane (Fig. 7b).4, 29 NP-TA remained much less interactive with cells at pH 6.2.
Fig. 7.

(a) Zeta potential of NP-TA and NP-TA-LMWC at pH 7.4 and 6.2. (b) Cellular uptake of NP*-TA and NP*-TA-LMWC by SKOV-3 cells after 3 h of incubation at pH 7.4 or 6.2.
3.5. Drug loading on TA layer
Due to the large number of aromatic functional groups in TA layer, NP-TA were expected to have high affinity for aromatic compounds. To test this, we incubated NP-TA with Dox, Pfv, and RhoB containing polycyclic planar aromatic structures and quantified the compounds bound to NP-TA. All three compounds adsorbed to NP-TA conferring characteristic colors (Fig. 8a). The pellets retained the color after repeated washing and centrifugation, and the supernatants showed no detectable color, indicating the persistence of the compound/NP-TA binding. In contrast, pellets of bare NP incubated with these compounds did not show any color. The amount of Dox and Pfv bound to NP-TA linearly increased with the amount of NP-TA, corresponding to a constant compound/NP ratio (0.93 wt% for Dox/NP-TA and 0.49 wt% for Pfv/NP-TA). On the other hand, the amount of RhoB bound to NP-TA reached a plateau with the increase of NP-TA, showing an ever-decreasing RhoB/NP ratio (Fig. 8a).
Fig. 8.

(a) Loading of compounds with polycyclic planar aromatic structures on NP-TA. The wells contain supernatants of NP-TA suspension incubated with Dox, Pfv, or RhoB. The amount of each compound is fixed at 8 μg (Dox) or 2 μg (Pfv, RhoB), and the amount of NP-TA is varied. Compound loaded = compound initially used – compound in the supernatant. Compound/NP = Compound loaded/NP used. Data are expressed as averages and standard deviations of 3 independently and identically performed tests. Cytotoxicity of NP-TA-Dox (black column) and free doxorubicin (open column) in (b) MCF7 and (c) 4T1 cells. Cells were exposed to treatments for 6h and incubated for additional 42h in the treatment-free medium (6h+42h) or incubated with the treatment for 48h (48h) prior to the MTT assay. Dotted lines indicate cell viability after treatment with NP-TA equivalent to the highest level of NP-TA-Dox. n= 3 replicates. *: p<0.05; **: p< 0.01 by Sidak’s multiple comparisons test.
Bioactivity of Dox loaded on NP-TA was evaluated at 3 levels in MCF7 and 4T1 breast cancer cell lines varying the exposure time (6 h and 48 h). In MCF7 cells, NP-TA-Dox showed greater toxicity than free Dox counterpart except for 1 μM Dox level after 48 h, where the cells were mostly dead (Fig. 8b). 4T1 cells showed no difference in responses to the two treatments irrespective of the exposure time (Fig. 8c).
4. Discussions
Surface properties of NPs affect their biodistribution and interactions with target cells.38 The pD coating proved to be a simple and easy way of controlling NP surface chemistry, enabling versatile functionalization of PLGA NPs which had practically non-reactive surface.3–6 However, pD also has drawbacks such as color, price, and potential concern for the residual bioactivity; thus, we have explored TA as an alternative coating for NP functionalization. TA is 10 times larger than dopamine in molecular size (1701.2 Da vs. 189.6 Da) and readily oligomerizes at neutral pH and a relatively low concentration (0.07 mg/mL). TA assembly occurs more efficiently when Fe3+ is used as a crosslinker,39 but we opt not to use Fe3+ crosslinker because the TA-Fe coordination complex has dark color that we try to avoid in this study.
The oligomerized TA formed a coating on PLGA NPs, which was confirmed by the characteristic negative charge, deposition of metallic Ag after incubation in AgNO3, and the wrinkled layer seen in TEM. The TA coating remained stable in 0.2M phosphate buffer and 50% FBS for at least 24 h and did not induce additional toxicity, as expected from the GRAS (Generally Recognized as Safe) status of TA.40 The TA coating did not have discernible color or affect the fluorescence intensity of NPs unlike pD. TA was as effective as pD in functionalizing NPs, allowing for the conjugation of a small molecule (fla), polymeric ligand (pFol), protein (albumin), and polysaccharide (LMWC). Moreover, the TA coating enabled the loading of aromatic compounds such as Dox, Pfv, and RhoB on the NP surface, which may be potentially useful for the delivery of combination therapy or development of theranostic NPs.
TA can interact with other molecules via various mechanisms including electrostatic interactions, hydrogen bonding, and hydrophobic interactions. TA deposition on PLGA NPs may have been mediated by its interaction with residual PVA on the NP surface. It is known that a fraction of PVA used as an emulsifier remains on the NPs despite multiple washing.41 Shin et al. showed that PVA interacts with polyphenolic compounds such as dopamine via hydrogen bond.42 We also found that PVA interacts with TA in the same manner forming a complex that can be detected based on UV absorbance (Supporting Fig. 4). Once deposited on the NP surface, TA interacts with various functional ligands via aforementioned mechanisms. Similar to pD, TA also reacts with thiols and amines via Michael addition or Schiff base reactions due to the abundant di- or trihydroxyphenyl groups.2, 43 Therefore, the efficiency of functionalization may vary with the size, charge, and functional groups of the ligands. Among the tested molecules, LMWC was most efficiently conjugated (0.4 LMWC/nm2), which may be attributable to the abundant primary amines and linear structure. Albumin conjugation (0.5 albumin/100 nm2) was not as efficient as LMWC due to its large size and globular conformation that may limit the access of reactive functional groups to TA coating.
pFol, LMWC, and albumin conjugated via TA coating brought the expected functionality to NPs. pFol promoted NP-TA-pFol uptake by KB cells via folate receptor-mediated endocytosis as it did for NP-pD-pFol.3 LMWC mediated pH-sensitive interaction of NP-TA-LMWC and cancer cells. We have previously reported that LMWC layer conjugated to NPs via pD provides a unique pH-sensitive charge profile, which selectively allows for cell-NP interactions at mildly acidic pH.4, 29 Similar to NP-pD-LMWC, NP-TA-LMWC interacted with SKOV-3 cells at pH 6.2 but not at pH 7.4, indicating that they will spare tissues in normal physiological pH but interact with cells in acidic tumor microenvironment to enhance drug delivery to tumors. Albumin enhanced NP-TA-alb transport across the HUVEC layer. As a long-circulating plasma protein involved in transendothelial transport of nutrients and drugs,44, 45 albumin has been explored as a native stealth coating of NPs46, 47 or to promote transport of NPs across endothelial cells.48 In NP-TA-alb, the surface-bound albumin allowed the NPs to better reach the basolateral side across the HUVEC layer than NP-TA, consistent with the role of albumin as a transendothelial transporter.49 These results support that TA coating is as versatile as pD coating in functionalizing non-reactive PLGA NP surface.
Another useful feature of TA coating is that it can bind to drugs or imaging agents with polycyclic planar aromatic structures. Dox, Pfv, and RhoB were loaded on NP-TA with high affinity yet notable difference in loading efficiency. With Dox and Pfv, the loading increased linearly with NP-TA, whereas RhoB loading on NP-TA showed an upper limit. This difference may be attributed to their structures. In addition to the planar aromatic group, Dox and Pfv have primary amine groups that can be covalently conjugated to TA coating, but RhoB does not. Moreover, Dox and Pfv are cationic in neutral pH with pKa values of 7.34, 8.46, and 9.46 (Dox)50 and 8.06 (Pfv),51 which provide an additional driving force to interact with anionic TA, whereas RhoB remains zwitterionic at pH above the pKa value of 3.1.52 (Although the pH was not adjusted, DI water used for the incubation was neither strongly acidic nor basic; thus, the charge difference between the compounds is valid.) Given the potential for covalent conjugation between TA coating and the aminosugar moiety of Dox, we asked if such interaction would compromise antiproliferative activity of Dox. We compared the activity of free Dox and NP-TA bound Dox and found that NP-TA-Dox was more effective than free Dox in MCF7 cells and similar to free Dox in 4T1 cells. The greater activity of NP-TA-Dox shown in MCF7 cells after 6 h exposure suggests potential interactions between NP-TA-Dox and MCF7 cells. TA has been suggested as a ligand of peroxisome-proliferator-activated receptor-gamma (PPARγ),53 which belongs to the same nuclear hormone receptor superfamily as estrogen receptors (ER) and shares common coactivators with ER.54 This suggests that TA may be a potential ligand of ER. In fact, polyphenols related to TA are known to bind to ER55, 56 and provide dose-dependent anti-proliferative effect to ER-positive cancer cells.56 Therefore, it is possible that the NP-TA-Dox interaction with ER-positive MCF7 cells enhanced the binding and retention of Dox after the 6 h exposure and induced greater toxicity during the post-treatment incubation. ER-negative 4T1 cells did not respond to NP-TA-Dox better than to free Dox. On the other hand, the cytotoxicity measured after 48 h exposure needs to be explained differently, because the cells were exposed to the same amount of Dox in both treatments during the entire incubation period. In this case, the greater toxicity of NP-TA-Dox may be attributed to the stability of Dox bound to NP-TA relative to free Dox, which has a short half-life in biological fluid at 37 °C.57 4T1 cells showed a similar trend as MCF7 cells although the difference was insignificant. In any cases, the effect of NP-TA itself would be negligible because it showed <20% effect at the highest level of NPs. Taken together, the results support that Dox bound to NP-TA maintains the biological activity and benefits from the binding with respect to cellular retention and/or stability.
5. Conclusions
TA coating can be used as an inexpensive and effective alternative to pD coating. TA coating is optically inert unlike pD but as simple and versatile as pD in functionalizing PLGA NPs. The NP functionalized with pFol, albumin, and LMWC via TA showed enhanced interactions with target cells based on ligand-specific mechanisms. Given the strong interactions between TA and planar aromatic compounds, TA can also help develop drug combination carriers or theranostic NPs. TA is a promising intermediate for surface modification of polymeric NPs.
Supplementary Material
Acknowledgments
This work was supported by NIH R01 EB017791. We acknowledge the fellowship supports from the Egyptian Government Ministry of Higher Education Missions Sector to S.A.A. and the China Scholarship Council Fellowship to F.M. We also thank Joonyoung Park for the assistance with the ninhydrin assay.
Footnotes
Supporting Information: Supporting Figures are available free of charge via the Internet at http://pubs.acs.org.
References
- 1.Lee H, Dellatore SM, Miller WM, Messersmith PB. Mussel-inspired surface chemistry for multifunctional coatings. Science. 2007;318(5849):426–430. doi: 10.1126/science.1147241. [DOI] [PMC free article] [PubMed] [Google Scholar]
- 2.Liu Y, Ai K, Lu L. Polydopamine and its derivative materials: Synthesis and promising applications in energy, environmental, and biomedical fields. Chem Rev. 2014;114(9):5057–5115. doi: 10.1021/cr400407a. [DOI] [PubMed] [Google Scholar]
- 3.Park J, Brust TF, Lee HJ, Lee SC, Watts VJ, Yeo Y. Polydopamine-based simple and versatile surface modification of polymeric nano drug carriers. ACS Nano. 2014;8(4):3347–3356. doi: 10.1021/nn405809c. [DOI] [PMC free article] [PubMed] [Google Scholar]
- 4.Abouelmagd S, Ku YJ, Yeo Y. Low molecular weight chitosan-coated polymeric nanoparticles for sustained and ph-sensitive delivery of paclitaxel. J Drug Target. 2015;23(7–8):725–735. doi: 10.3109/1061186X.2015.1054829. [DOI] [PMC free article] [PubMed] [Google Scholar]
- 5.Gullotti E, Park J, Yeo Y. Polydopamine-based surface modification for the development of peritumorally activatable nanoparticles. Pharm Res. 2013;30(8):1956–1967. doi: 10.1007/s11095-013-1039-y. [DOI] [PMC free article] [PubMed] [Google Scholar]
- 6.Park J, Kadasala NR, Abouelmagd SA, Castanares MA, Collins DS, Wei A, Yeo Y. Polymer–iron oxide composite nanoparticles for EPR-independent drug delivery. Biomaterials. 2016;101:285–295. doi: 10.1016/j.biomaterials.2016.06.007. [DOI] [PMC free article] [PubMed] [Google Scholar]
- 7.Qiang W, Li W, Li X, Chen X, Xu D. Bioinspired polydopamine nanospheres: A superquencher for fluorescence sensing of biomolecules. Chem Sci. 2014;5(8):3018–3024. [Google Scholar]
- 8.Quignard S, d’Ischia M, Chen Y, Fattaccioli J. Ultraviolet-induced fluorescence of polydopamine-coated emulsion droplets. ChemPlusChem. 2014;79(9):1254–1257. [Google Scholar]
- 9.Sileika TS, Barrett DG, Zhang R, Lau KHA, Messersmith PB. Colorless multifunctional coatings inspired by polyphenols found in tea, chocolate, and wine. Angew Chem Int Ed Engl. 2013;52(41):10766–10770. doi: 10.1002/anie.201304922. [DOI] [PMC free article] [PubMed] [Google Scholar]
- 10.Hong S, Yeom J, Song IT, Kang SM, Lee H, Lee H. Pyrogallol 2-aminoethane: A plant flavonoid-inspired molecule for material-independent surface chemistry. Adv Mater Interfaces. 2014;1:1400113. [Google Scholar]
- 11.Chung JE, Tan S, Gao SJ, Yongvongsoontorn N, Kim SH, Lee JH, Choi HS, Yano H, Zhuo L, Kurisawa M, Ying JY. Self-assembled micellar nanocomplexes comprising green tea catechin derivatives and protein drugs for cancer therapy. Nat Nanotechnol. 2014;9(11):907–912. doi: 10.1038/nnano.2014.208. [DOI] [PMC free article] [PubMed] [Google Scholar]
- 12.Barrett DG, Sileika TS, Messersmith PB. Molecular diversity in phenolic and polyphenolic precursors of tannin-inspired nanocoatings. Chem Commun. 2014;50(55):7265–7268. doi: 10.1039/c4cc02961e. [DOI] [PMC free article] [PubMed] [Google Scholar]
- 13.Liang H, Pei Y, Li J, Xiong W, He Y, Liu S, Li Y, Li B. pH-degradable antioxidant nanoparticles based on hydrogen-bonded tannic acid assembly. RSC Advances. 2016;6(37):31374–31385. [Google Scholar]
- 14.Ogasawara S, Asami H, Kimura Y, Kuroiwa S. Zeta-potential and surface charge density of tannic acid-treated nylon 6 fibers in acid dye solutions. Sen’i Gakkaishi. 1981;37(6):T241–T246. [Google Scholar]
- 15.Natarajan V, Krithica N, Madhan B, Sehgal PK. Preparation and properties of tannic acid cross-linked collagen scaffold and its application in wound healing. J Biomed Mater Res B Appl Biomater. 2013;101(4):560–567. doi: 10.1002/jbm.b.32856. [DOI] [PubMed] [Google Scholar]
- 16.Heijmen FH, du Pont JS, Middelkoop E, Kreis RW, Hoekstra MJ. Cross-linking of dermal sheep collagen with tannic acid. Biomaterials. 1997;18(10):749–754. doi: 10.1016/s0142-9612(96)00202-5. [DOI] [PubMed] [Google Scholar]
- 17.Jackson JK, Zhao J, Wong W, Burt HM. The inhibition of collagenase induced degradation of collagen by the galloyl-containing polyphenols tannic acid, epigallocatechin gallate and epicatechin gallate. J Mater Sci Mater Med. 2010;21(5):1435–1443. doi: 10.1007/s10856-010-4019-3. [DOI] [PubMed] [Google Scholar]
- 18.Shin M, Ryu JH, Park JP, Kim K, Yang JW, Lee H. DNA/tannic acid hybrid gel exhibiting biodegradability, extensibility, tissue adhesiveness, and hemostatic ability. Adv Funct Mater. 2015;25(8):1270–1278. [Google Scholar]
- 19.Shin M, Kim K, Shim W, Yang JW, Lee H. Tannic acid as a degradable mucoadhesive compound. ACS Biomater Sci Eng. 2016;2(4):687–696. doi: 10.1021/acsbiomaterials.6b00051. [DOI] [PubMed] [Google Scholar]
- 20.Shutava TG, Lvov YM. Nano-engineered microcapsules of tannic acid and chitosan for protein encapsulation. J Nanosci Nanotechnol. 2006;6(6):1655–1661. doi: 10.1166/jnn.2006.225. [DOI] [PubMed] [Google Scholar]
- 21.Lomova MV, Brichkina AI, Kiryukhin MV, Vasina EN, Pavlov AM, Gorin DA, Sukhorukov GB, Antipina MN. Multilayer capsules of bovine serum albumin and tannic acid for controlled release by enzymatic degradation. ACS Appl Mater Interfaces. 2015;7(22):11732–11740. doi: 10.1021/acsami.5b03263. [DOI] [PubMed] [Google Scholar]
- 22.Kozlovskaya V, Kharlampieva E, Drachuk I, Cheng D, Tsukruk VV. Responsive microcapsule reactors based on hydrogen-bonded tannic acid layer-by-layer assemblies. Soft Matter. 2010;6(15):3596–3608. [Google Scholar]
- 23.Kim BS, Lee HI, Min Y, Poon Z, Hammond PT. Hydrogen-bonded multilayer of ph-responsive polymeric micelles with tannic acid for surface drug delivery. Chem Commun. 2009:4194–4196. doi: 10.1039/b908688a. [DOI] [PMC free article] [PubMed] [Google Scholar]
- 24.Untener EA, Comfort KK, Maurer EI, Grabinski CM, Comfort DA, Hussain SM. Tannic acid coated gold nanorods demonstrate a distinctive form of endosomal uptake and unique distribution within cells. ACS Appl Mater Interfaces. 2013;5(17):8366–8373. doi: 10.1021/am402848q. [DOI] [PubMed] [Google Scholar]
- 25.Ye M, Tang L, Luo M, Zhou J, Guo B, Liu Y, Chen B. Size- and time-dependent alteration in metabolic activities of human hepatic cytochrome p450 isozymes by gold nanoparticles via microsomal coincubations. Nanoscale Res Lett. 2014;9(1):642. doi: 10.1186/1556-276X-9-642. [DOI] [PMC free article] [PubMed] [Google Scholar]
- 26.Sekowski S, Tomaszewska E, Soliwoda K, Celichowski G, Grobelny J. Interactions of hybrid gold-tannic acid nanoparticles with human serum albumin. Eur Biophys J. 2016 doi: 10.1007/s00249-016-1134-1. [DOI] [PubMed] [Google Scholar]
- 27.Altun S, Cakiroglu B, Ozacar M, Ozacar M. A facile and effective immobilization of glucose oxidase on tannic acid modified cofe2o4 magnetic nanoparticles. Colloids Surf B Biointerfaces. 2015;136:963–970. doi: 10.1016/j.colsurfb.2015.10.053. [DOI] [PubMed] [Google Scholar]
- 28.Xiong L, Bi J, Tang Y, Qiao SZ. Magnetic core-shell silica nanoparticles with large radial mesopores for sirna delivery. Small. 2016;12(34):4735–4742. doi: 10.1002/smll.201600531. [DOI] [PubMed] [Google Scholar]
- 29.Amoozgar Z, Park J, Lin Q, Yeo Y. Low molecular-weight chitosan as a ph-sensitive stealth coating for tumor-specific drug delivery. Mol Pharm. 2012;9(5):1262–1270. doi: 10.1021/mp2005615. [DOI] [PMC free article] [PubMed] [Google Scholar]
- 30.Jones LJ, Haugland RP, Singer VL. Development and characterization of the nanoorange protein quantitation assay: A fluorescence-based assay of proteins in solution. BioTechniques. 2003;34(4):850–854. 856, 858. doi: 10.2144/03344pt03. passim. [DOI] [PubMed] [Google Scholar]
- 31.Leane MM, Nankervis R, Smith A, Illum L. Use of the ninhydrin assay to measure the release of chitosan from oral solid dosage forms. Int J Pharm. 2004;271(1–2):241–249. doi: 10.1016/j.ijpharm.2003.11.023. [DOI] [PubMed] [Google Scholar]
- 32.Benson K, Cramer S, Galla H-J. Impedance-based cell monitoring: Barrier properties and beyond. Fluids Barriers CNS. 2013;10(1):1–11. doi: 10.1186/2045-8118-10-5. [DOI] [PMC free article] [PubMed] [Google Scholar]
- 33.Malvern Instruments Limited. Dynamic light scattering - common terms defined. 2014. p. MRK1764–01. [Google Scholar]
- 34.Marino DC, Sabino LZL, Armando J, Ruggiero AD, Moya HD. Analysis of the polyphenols content in medicinal plants based on the reduction of Cu(II)/bicinchoninic complexes. J Agric Food Chem. 2009;57(23):11061–11066. doi: 10.1021/jf902197p. [DOI] [PubMed] [Google Scholar]
- 35.International Organization for Standardization. [Date of access: April 8, 2016];ISO 22412:2008(en) Particle size analysis - Dynamic light scattering (DLS) https://www.iso.org/obp/ui/#iso:std:iso:22412:ed-1:v1:en.
- 36.Su Z, Niu J, Xiao Y, Ping Q, Sun M, Huang A, You W, Sang X, Yuan D. Effect of octreotide-polyethylene glycol(100) monostearate modification on the pharmacokinetics and cellular uptake of nanostructured lipid carrier loaded with hydroxycamptothecine. Mol Pharm. 2011;8(5):1641–1651. doi: 10.1021/mp100463n. [DOI] [PubMed] [Google Scholar]
- 37.Rabanel JM, Hildgen P, Banquy X. Assessment of PEG on polymeric particles surface, a key step in drug carrier translation. J Control Release. 2014;185:71–87. doi: 10.1016/j.jconrel.2014.04.017. [DOI] [PubMed] [Google Scholar]
- 38.Blanco E, Shen H, Ferrari M. Principles of nanoparticle design for overcoming biological barriers to drug delivery. Nat Biotechnol. 2015;33(9):941–951. doi: 10.1038/nbt.3330. [DOI] [PMC free article] [PubMed] [Google Scholar]
- 39.Ejima H, Richardson JJ, Liang K, Best JP, van Koeverden MP, Such GK, Cui J, Caruso F. One-step assembly of coordination complexes for versatile film and particle engineering. Science. 2013;341(6142):154–157. doi: 10.1126/science.1237265. [DOI] [PubMed] [Google Scholar]
- 40.Food and Drug Administration. [Date of access: August 8, 2016];Select Committee on GRAS Substances (SCOGS) Opinion: Tannic acid (hydrolyzable gallotannins) http://www.fda.gov/Food/IngredientsPackagingLabeling/GRAS/SCOGS/ucm261485.htm.
- 41.Sahoo SK, Panyam J, Prabha S, Labhasetwar V. Residual polyvinyl alcohol associated with poly (D,L-lactide-co-glycolide) nanoparticles affects their physical properties and cellular uptake. J Control Release. 2002;82(1):105–114. doi: 10.1016/s0168-3659(02)00127-x. [DOI] [PubMed] [Google Scholar]
- 42.Shin M, Kim HK, Lee H. Dopamine-loaded poly(D,L-lactic-co-glycolic acid) microspheres: New strategy for encapsulating small hydrophilic drugs with high efficiency. Biotechnol Prog. 2014;30(1):215–223. doi: 10.1002/btpr.1835. [DOI] [PubMed] [Google Scholar]
- 43.Pranantyo D, Xu LQ, Neoh KG, Kang E-T, Teo SL-M. Antifouling coatings via tethering of hyperbranched polyglycerols on biomimetic anchors. Industrial & Engineering Chemistry Research. 2016;55(7):1890–1901. [Google Scholar]
- 44.Komarova Y, Malik AB. Regulation of endothelial permeability via paracellular and transcellular transport pathways. Annu Rev Physiol. 2010;72:463–493. doi: 10.1146/annurev-physiol-021909-135833. [DOI] [PubMed] [Google Scholar]
- 45.Minshall RD, Malik AB. Transport across the endothelium: Regulation of endothelial permeability. Handb Exp Pharmacol. 2006;(176 Pt 1):107–144. doi: 10.1007/3-540-32967-6_4. [DOI] [PubMed] [Google Scholar]
- 46.Peng Q, Zhang S, Yang Q, Zhang T, Wei XQ, Jiang L, Zhang CL, Chen QM, Zhang ZR, Lin YF. Preformed albumin corona, a protective coating for nanoparticles based drug delivery system. Biomaterials. 2013;34(33):8521–8530. doi: 10.1016/j.biomaterials.2013.07.102. [DOI] [PubMed] [Google Scholar]
- 47.Peng Q, Wei XQ, Yang Q, Zhang S, Zhang T, Shao XR, Cai XX, Zhang ZR, Lin YF. Enhanced biostability of nanoparticle-based drug delivery systems by albumin corona. Nanomedicine (Lond) 2015;10(2):205–214. doi: 10.2217/nnm.14.86. [DOI] [PubMed] [Google Scholar]
- 48.Ye D, Dawson KA, Lynch I. A TEM protocol for quality assurance of in vitro cellular barrier models and its application to the assessment of nanoparticle transport mechanisms across barriers. Analyst. 2015;140(1):83–97. doi: 10.1039/c4an01276c. [DOI] [PubMed] [Google Scholar]
- 49.Larsen MT, Kuhlmann M, Hvam ML, Howard KA. Albumin-based drug delivery: Harnessing nature to cure disease. Mol Cell Ther. 2016;4:3. doi: 10.1186/s40591-016-0048-8. [DOI] [PMC free article] [PubMed] [Google Scholar]
- 50.National Center for Biotechnology Information. [Date of access: July 27, 2016];PubChem Compound Database. cid=31703, https://pubchem.ncbi.nlm.nih.gov/compound/31703.
- 51.National Center for Biotechnology Information. [Date of access: July 27, 2016];PubChem Compound Database. cid=7099, https://pubchem.ncbi.nlm.nih.gov/compound/7099.
- 52.Arbeloa IL, Ojeda PR. Molecular forms of rhodamine B. Chemical Physics Letters. 1981;79(2):347–350. [Google Scholar]
- 53.Cass CA, Burg KJ. Tannic acid cross-linked collagen scaffolds and their anti-cancer potential in a tissue engineered breast implant. J Biomater Sci Polym Ed. 2012;23(1–4):281–298. doi: 10.1163/092050610X550331. [DOI] [PubMed] [Google Scholar]
- 54.Jeong S, Yoon M. 17β-estradiol inhibition of PPARγ-induced adipogenesis and adipocyte-specific gene expression. Acta Pharmacol Sin. 2011;32(2):230–238. doi: 10.1038/aps.2010.198. [DOI] [PMC free article] [PubMed] [Google Scholar]
- 55.Goodin MG, Fertuck KC, Zacharewski TR, Rosengren RJ. Estrogen receptor-mediated actions of polyphenolic catechins in vivo and in vitro. Toxicol Sci. 2002;69(2):354–361. doi: 10.1093/toxsci/69.2.354. [DOI] [PubMed] [Google Scholar]
- 56.Damianaki A, Bakogeorgou E, Kampa M, Notas G, Hatzoglou A, Panagiotou S, Gemetzi C, Kouroumalis E, Martin PM, Castanas E. Potent inhibitory action of red wine polyphenols on human breast cancer cells. J Cell Biochem. 2000;78(3):429–441. doi: 10.1002/1097-4644(20000901)78:3<429::aid-jcb8>3.0.co;2-m. [DOI] [PubMed] [Google Scholar]
- 57.Maniez-Devos DM, Baurain R, Lesne M, Trouet A. Degradation of doxorubicin and daunorubicin in human and rabbit biological fluids. J Pharm Biomed Anal. 1986;4(3):353–365. doi: 10.1016/0731-7085(86)80057-7. [DOI] [PubMed] [Google Scholar]
Associated Data
This section collects any data citations, data availability statements, or supplementary materials included in this article.