Abstract
Women with high breast density are at increased risk of developing breast cancer. Breast density has usually been defined using mammography as the ratio of fibroglandular tissue to total breast area. Ultrasound tomography (UST) is an emerging modality that can also be used to measure breast density. UST creates tomographic sound speed images of the patient’s breast which is useful as sound speed is directly proportional to tissue density. Furthermore, the volumetric and quantitative information contained in the sound speed images can be used to describe the distribution of breast density. The work presented here measures the UST sound speed density distributions of 165 women with negative screening mammography. Frequency distributions of the sound speed voxel information were examined for each patient. In a preliminary analysis, the UST sound speed distributions were averaged across patients and grouped by various patient and density-related factors (e.g., age, body mass index, menopausal status, average mammographic breast density). It was found that differences in the distribution of density could be easily visualized for different patient groupings. Furthermore, findings suggest that the shape of the distributions may be used to identify participants with varying amounts of dense and non-dense tissue.
Keywords: Ultrasound tomography, Breast density, Density distribution, Sound speed
1. INTRODUCTION
Breast density has become an important factor in women’s health as it is well-established that women with high breast density are at an increased risk of developing breast cancer1, 2. Breast density has traditionally been measured using mammography. Initially, subjective visual assessments of breast density were made by qualified readers3, but computer assisted methods, such as CUMULUS4, and volumetric measures, such as Volpara5 and Quantra6, have also been used to measure breast density. No matter which method is used to measure mammographic density, women with the densest breasts are at a 4–6 fold increase in breast cancer risk relative to those with the fattiest breasts7.
Mammographic image are created by using the x-ray attenuation properties of breast tissue. Dense tissue attenuates more x-rays than fatty tissue, so dense tissue appears lighter on the final images while fatty tissue appears darker. The relative amounts of light and dark regions are what are used to determine mammographic breast density. The ratio of the amount of fibroglandular tissue relative to the total breast area is known as mammographic percent density (MPD). This measure of density treats breast tissue in a binary fashion; tissue is either entirely dense or entirely fatty. However, breast tissue is heterogeneously composed of regions of dense and non-dense tissue that are of varying densities.
Ultrasound tomography (UST) is an emerging breast imaging modality that produces quantitative measures of breast density8–10. It uses sound waves to produce three-dimensional images of breast tissue using the transmission and reflection properties of breast anatomy. A tissue transmission property that is useful for breast density measurements is tissue sound speed. The longitudinal sound speed of any material is given by:
where C is the bulk modulus and ρ is the density of material in question. Studies have shown that the bulk modulus of breast tissue scales with the cube of its density11–13. This suggests that for breast tissue, the sound speed has a direct relationship with density.
UST can be used to create maps of tissue sound speed throughout the entire volume of breast tissue. Each voxel in the final sound speed image therefore directly represents the tissue properties of a small volume of tissue. By analyzing the distribution of sound speed throughout the entire breast tissue, dense and fatty tissue can be defined in a more robust manner than is possible with mammography. This work will examine how sound speed is distributed in a group of women with negative mammographic screening results.
2. METHODS AND MATERIALS
As part of a larger ongoing study14, 165 women with negative mammographic screens have undergone UST scans. The UST hardware creates tomographic sound speed images of the breast from the chest wall to the nipple. These sound speed images were analyzed by one reliable reader (M. Sak) using a semi-automated method in ImageJ as previously described15, 16. Each slice containing breast tissue was manually segmented from the surrounding water bath using an elliptical approximation. This was required as the sound speed of water is intermediate to the range of sound speeds of breast tissue and therefore simple thresholding could not be used to separate breast tissue from water. Once segmentation was complete, the remaining voxels represent only breast tissue.
Sound speed images were created from the UST scans and the distribution of sound speed values for each participant was characterized in the form of a histogram of sound speed values. Each voxel of breast tissue in the UST sound speed image for each participant had a corresponding sound speed value that was recorded in a frequency distribution. Frequency distributions for each participant were captured along with many other participant characteristics such as age, weight, height and menopausal status. UST density measures such as mean sound speed and total breast volume along with mammographic density measures such as MPD and dense tissue area were also measured. These characteristics were used to rank the participant population into quartiles and the average sound speed distribution for each quartile was calculated.
3. RESULTS AND DISCUSSION
3.1 Examination of Individual Distributions
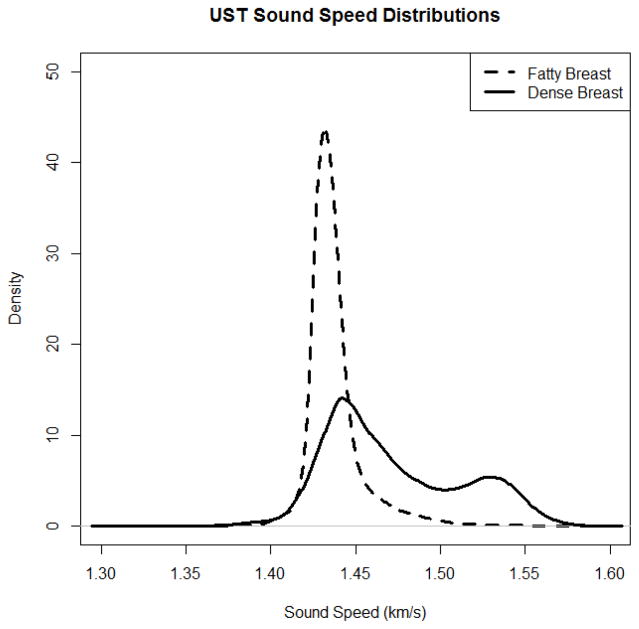
Figure 1 shows the UST sound speed distributions for two separate breasts; a breast representative of an extremely fatty breast and one representative of an extremely dense breast. Unsurprisingly, the distributions are noticeably different from each other. The distribution for the fatty breast has one peak that is positively skewed with a longer tail stretching into the higher sound speeds. The single peak represents the homogenous adipose content of the non-dense breast. Since dense breasts tend to be composed of regions of both dense and fatty tissue, distributions start appearing more bimodal and two peaks can easily be seen in the sound speed distribution. The peak at the lower sound speeds corresponds to fatty tissue, while the peak at the higher sound speed corresponds to dense tissue.
Figure 1.
The UST sound speed distributions for a fatty breast (dashed) and a dense breast (solid).
Dense breasts have higher mean sound speed values than fatty breasts. For the distribution of the fatty breast in Figure 1, the mean sound speed value of the entire breast corresponds very closely to the sound speed value at the single peak. In contrast, the presence of dense tissue in the dense breast causes the mean sound speed value to shift between the two observed peaks in the sound speed distribution. Previous work has shown that UST sound speed has an approximate range of values from 1.42 km/s to 1.52 km/s10. This range falls in between the sound speed peaks for fatty tissue and dense tissue shown in Figure 1.
3.2 UST Sound Speed Distributions Grouped According to Mammographic and UST Density Characteristics
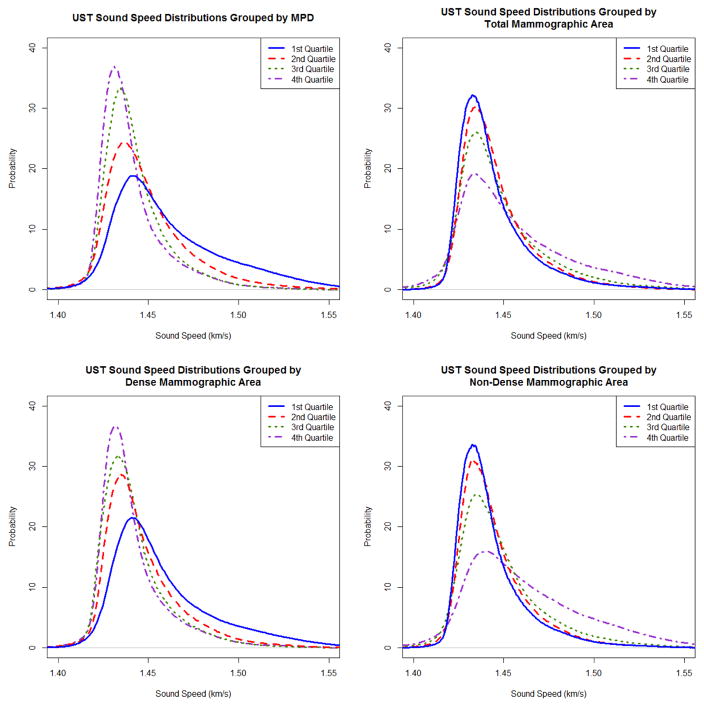
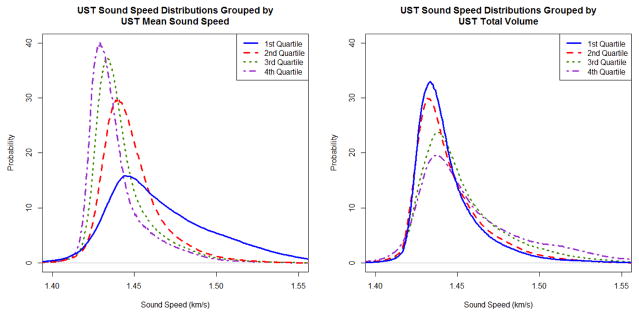
The mammographic density characteristics were MPD, total breast area, dense breast area and non-dense breast area. The UST density characteristics were mean sound speed and total breast volume. Figure 2 shows the plots of the average UST sound speed distribution for each quartile of participants when sorted by the mammographic characteristics of MPD, total breast area, dense breast area and non-dense breast area. Figure 3 shows the UST sound speed distributions for participants that were grouped according to the UST density characteristics of mean sound speed and total breast volume. Each quartile represents the average sound speed distribution of approximately 41 participants. The 1st quartile always represents the participants with the highest values of the characteristic being examined, while the 4th quartile represents those participants with the lowest values. The y-axis gives the relative probability of measuring a small volume of breast tissue with the specific sound speed. It is weighted in such a way that the entire area under the plot has a value of 1.
Figure 2.
Plots of the average UST sound speed distribution for all participants sorted by quartiles of (Top Left) mammographic percent density (MPD), (Top Right) total mammographic breast area, (Bottom Left) total dense mammographic breast area and (Bottom Right) total non-dense mammographic breast area.
Figure 3.
Plots of the average UST sound speed distribution for each quartile of participants grouped according to quartiles of their UST density characteristics of (Left) mean sound speed and (Right) total breast volume.
The results in Figure 2 and Figure 3 show that even when averaged over many different participants, differences in the distribution of sound speed can still be visualized easily. The participants with the densest breasts have distributions that are shaped noticeably different than those with the fattiest breasts. The differences are most pronounced when grouping according to MPD, mean sound speed and mammographic dense area. All three of these have been used to define breast density17, 18.
There is a clear pattern of change in the distribution as breast density increases. For low density breasts, the distribution is highly peaked and narrow with a small tail leading into the higher sound speeds that corresponds to the small amount of dense breast tissue present in the fatty breasts. As breast density increases the amount of non-dense tissue present decreases and therefore the low sound speed peak reduces in size, increases in width and the tail in the high sound speed regions increases in size. Although on average, the densest participants do not show a clear second peak in the distribution, the presence of dense tissue can clearly be seen.
The density characteristics of total mammographic area, non-dense mammographic area and total breast volume do show some changes among the quartiles. However, since these factors are only moderately correlated with breast density, the differences in the distributions between the quartiles are less pronounced. Generally, dense breasts tend to be smaller and composed of less non-dense breast tissue (see Appendix). Thus, the participants with larger breasts and larger amounts of fatty tissue are less likely to have large dense regions and have distributions that are more strongly peaked at lower values.
Tables that show the results of the mean values of each characteristic for each grouping are shown in the Appendix. The results there show that the densest breasts in this population tended to be smaller breasts, with the greatest amount of dense tissue. As breast size increased, the amount of non-dense tissue also increased but the amount of dense tissue stayed relatively constant. The dense tissue therefore had less of an effect in larger breasts, and the UST sound speed distributions tended to be more unimodal in groupings that corresponded to larger, fattier breasts.
3.3 UST Sound Speed Distributions Grouped According to Patient Characteristics
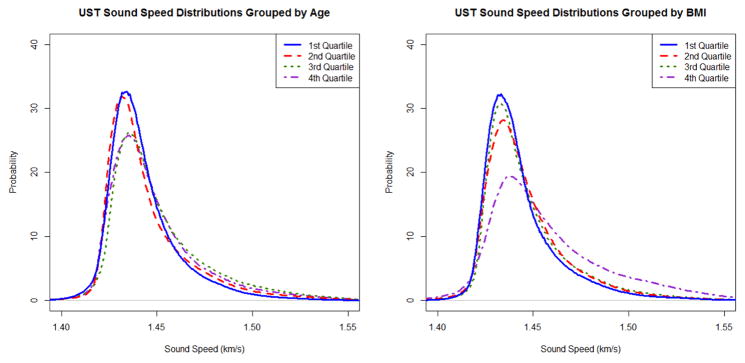
The participant characteristics that were recorded for each participant included age, BMI and menopausal status. The participant population was grouped into quartiles for age and BMI and the average UST sound speed distribution was calculated for each quartile. These results are shown in Figure 4 and are tabulated in the Appendix. The population was grouped into pre- and post-menopausal categories and the distribution for each menopausal status was also measured. These results are shown in Figure 5.
Figure 4.
Plots of the average UST sound speed distribution for participants grouped according to quartiles of (Left) age and (Right) BMI.
Figure 5.
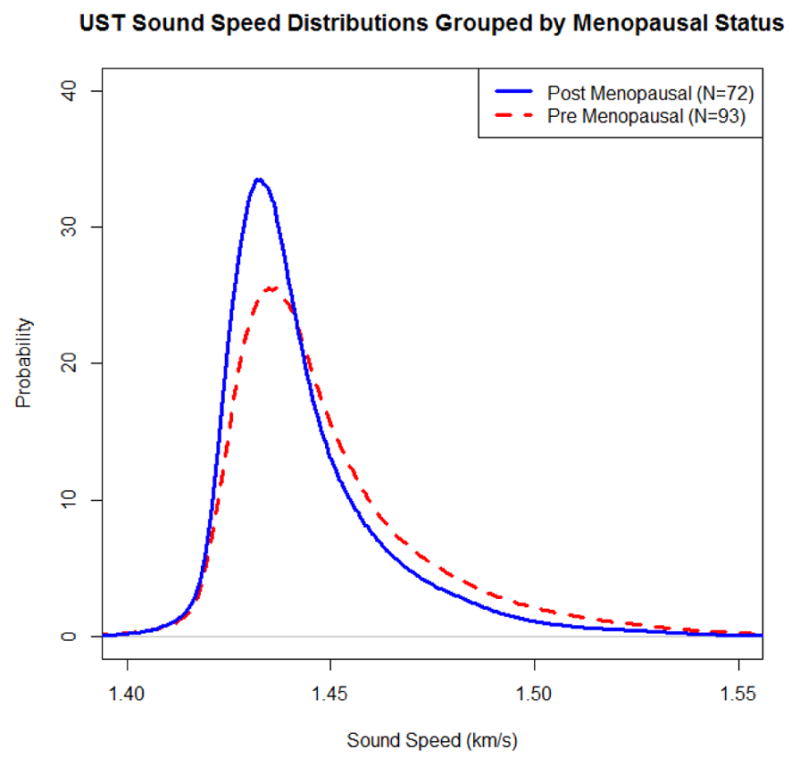
Plot of the average UST sound speed distribution for participants grouped according to their menopausal status.
Although age and BMI are known to moderately correlate with breast density19 and menopause has a pronounced effect on breast density, age and menopausal status do not appear to have large effects on the average UST sound speed distributions in this study population. When grouping by age, the youngest participants have roughly the same distribution as the oldest participants. The pre-menopausal group has a slightly different distribution than the post-menopausal group, with a slightly more pronounced high sound speed tail. However, these differences are much less pronounced than those seen when the participants were grouped according to their density characteristics. Only the participants with the lowest BMI had a noticeably different UST sound speed distribution. Participants with a low BMI are likely to have less fatty tissue present in their breast and relatively more dense tissue which would produce the resulting distribution.
4. CONCLUSIONS
Ultrasound tomography was used to create sound speed images of the breast. These images were then used to measure UST density distributions throughout the entire breast. Differences in the distribution of dense and non-dense tissue were visualized between women grouped according to participant and density related factors. The strongest differences in the shape of the distributions were visualized for this population when the densest breasts were grouped together. This generally occurred in smaller breasts with more dense tissue. This work shows that breast density is a complicated factor that can be more fully understood with a quantitative approach. Ongoing work will continue to examine further factors that may also influence the distribution of density throughout the breast.
Acknowledgments
The authors wish to thank Dr. Norman Boyd for his work analyzing all mammograms along with Mrs. Lisa Bey-Knight and Ms. Vivian Linke for research assistance. The authors are indebted to the participants in the Ultrasound Study of Tamoxifen for their outstanding cooperation and to the physicians, pathologists, nurses and technologists for their efforts in the field. This work was supported, in part, by the Intramural Research Program of the National Cancer Institute.
APPENDIX
Table 1.
Mean Value of Participant and Density Characteristics when Grouped by Quartiles of MPD
| Characteristic | 1st Quartile Mean Value | 2nd Quartile Mean Value | 3rd Quartile Mean Value | 4th Quartile Mean Value | p-value* |
|---|---|---|---|---|---|
|
| |||||
| Total Mammographic Area (cm2) | 160.5 | 209.5 | 235.6 | 300.6 | < 0.001 |
| Dense Mammographic Area (cm2) | 74.5 | 50.7 | 28.8 | 14.2 | < 0.001 |
| Non-Dense Mammographic Area (cm2) | 86.0 | 158.8 | 206.7 | 286.4 | < 0.001 |
| Mammographic Percent Density (%) | 48.5 | 24.0 | 12.4 | 4.9 | < 0.001 |
| Total Breast Volume (cm3) | 522.4 | 763.6 | 799.7 | 1018.3 | < 0.001 |
| Mean UST Sound Speed (km/s) | 1466.7 | 1449.5 | 1443.7 | 1441.3 | < 0.001 |
| Age (years) | 49.1 | 50.5 | 52.6 | 53.1 | 0.075 |
| BMI (kg/m2) | 26.7 | 29.1 | 32.8 | 36.2 | < 0.001 |
p-value calculated from ANOVA test
Table 2.
Mean Value of Participant and Density Characteristics when Grouped by Quartiles of Total Mammographic Area
| Characteristic Being Averaged | 1st Quartile Mean Value | 2nd Quartile Mean Value | 3rd Quartile Mean Value | 4th Quartile Mean Value | p-value* |
|---|---|---|---|---|---|
|
| |||||
| Total Mammographic Area (cm2) | 371.6 | 248.0 | 176.9 | 114.2 | < 0.001 |
| Dense Mammographic Area (cm2) | 43.2 | 40.5 | 43.9 | 40.0 | 0.928 |
| Non-Dense Mammographic Area (cm2) | 328.4 | 207.5 | 133.0 | 74.2 | < 0.001 |
| Mammographic Percent Density (%) | 11.5 | 16.7 | 25.1 | 35.9 | < 0.001 |
| Total Breast Volume (cm3) | 1253.3 | 842.2 | 633.1 | 390.7 | < 0.001 |
| Mean UST Sound Speed (km/s) | 1444.8 | 1446.8 | 1449.1 | 1460.1 | < 0.001 |
| Age (years) | 49.7 | 51.8 | 53.4 | 50.5 | 0.173 |
| BMI (kg/m2) | 36.9 | 33.2 | 29.5 | 25.5 | < 0.001 |
p-value calculated from ANOVA test
Table 3.
Mean Value of Participant and Density Characteristics when Grouped by Quartiles of Dense Mammographic Area
| Characteristic Being Averaged | 1st Quartile Mean Value | 2nd Quartile Mean Value | 3rd Quartile Mean Value | 4th Quartile Mean Value | p-value* |
|---|---|---|---|---|---|
|
| |||||
| Total Mammographic Area (cm2) | 227.4 | 219.0 | 207.4 | 253.6 | 0.206 |
| Dense Mammographic Area (cm2) | 87.3 | 43.5 | 25.0 | 12.5 | < 0.001 |
| Non-Dense Mammographic Area (cm2) | 140.1 | 175.4 | 182.3 | 241.2 | < 0.001 |
| Mammographic Percent Density (%) | 44.6 | 24.1 | 14.5 | 6.7 | < 0.001 |
| Total Breast Volume (cm3) | 760.8 | 764.9 | 727.2 | 855.1 | 0.655 |
| Mean UST Sound Speed (km/s) | 1464.3 | 1449.7 | 1444.2 | 1443.1 | < 0.001 |
| Age (years) | 48.1 | 50.6 | 51.8 | 54.8 | 0.002 |
| BMI (kg/m2) | 28.3 | 31.0 | 31.9 | 33.8 | 0.012 |
p-value calculated from ANOVA test
Table 4.
Mean Value of Participant and Density Characteristics when Grouped by Quartiles of Non-Dense Mammographic Area
| Characteristic Being Averaged | 1st Quartile Mean Value | 2nd Quartile Mean Value | 3rd Quartile Mean Value | 4th Quartile Mean Value | p-value* |
|---|---|---|---|---|---|
|
| |||||
| Total Mammographic Area (cm2) | 369.2 | 244.5 | 176.8 | 120.1 | < 0.001 |
| Dense Mammographic Area (cm2) | 34.7 | 36.9 | 43.0 | 52.8 | 0.038 |
| Non-Dense Mammographic Area (cm2) | 334.5 | 207.6 | 133.9 | 67.3 | < 0.001 |
| Mammographic Percent Density (%) | 8.8 | 14.3 | 22.8 | 43.1 | < 0.001 |
| Total Breast Volume (cm3) | 1226.9 | 847.3 | 662.5 | 382.9 | < 0.001 |
| Mean UST Sound Speed (km/s) | 1443.2 | 1445.2 | 1448.7 | 1463.6 | < 0.001 |
| Age (years) | 50.0 | 53.3 | 52.5 | 49.7 | 0.104 |
| BMI (kg/m2) | 37.4 | 33.0 | 29.8 | 25.0 | < 0.001 |
p-value calculated from ANOVA test
Table 5.
Mean Value of Participant and Density Characteristics when Grouped by Quartiles of UST Mean Sound Speed
| Characteristic Being Averaged | 1st Quartile Mean Value | 2nd Quartile Mean Value | 3rd Quartile Mean Value | 4th Quartile Mean Value | p-value* |
|---|---|---|---|---|---|
|
| |||||
| Total Mammographic Area (cm2) | 172.7 | 232.1 | 241.3 | 261.1 | < 0.001 |
| Dense Mammographic Area (cm2) | 71.0 | 46.1 | 26.4 | 24.6 | < 0.001 |
| Non-Dense Mammographic Area (cm2) | 101.7 | 186.0 | 214.9 | 236.5 | < 0.001 |
| Mammographic Percent Density (%) | 44.1 | 20.6 | 14.2 | 10.8 | < 0.001 |
| Total Breast Volume (cm3) | 529.4 | 816.9 | 854.4 | 906.0 | 0.001 |
| Mean UST Sound Speed (km/s) | 1470.5 | 1448.8 | 1443.3 | 1438.7 | < 0.001 |
| Age (years) | 48.8 | 51.4 | 50.7 | 54.4 | 0.013 |
| BMI (kg/m2) | 25.6 | 31.6 | 33.3 | 34.4 | < 0.001 |
p-value calculated from ANOVA test
Table 6.
Mean Value of Participant and Density Characteristics when Grouped by Quartiles of UST Total Volume
| Characteristic Being Averaged | 1st Quartile Mean Value | 2nd Quartile Mean Value | 3rd Quartile Mean Value | 4th Quartile Mean Value | p-value* |
|---|---|---|---|---|---|
|
| |||||
| Total Mammographic Area (cm2) | 324.1 | 251.0 | 205.5 | 129.7 | < 0.001 |
| Dense Mammographic Area (cm2) | 40.3 | 39.4 | 45.3 | 42.6 | 0.838 |
| Non-Dense Mammographic Area (cm2) | 283.8 | 211.6 | 160.3 | 87.1 | < 0.001 |
| Mammographic Percent Density (%) | 13.0 | 17.2 | 23.5 | 35.4 | < 0.001 |
| Total Breast Volume (cm3) | 1424.8 | 843.6 | 569.1 | 284.5 | < 0.001 |
| Mean UST Sound Speed (km/s) | 1443.8 | 1445.1 | 1452.2 | 1459.7 | < 0.001 |
| Age (years) | 50.6 | 51.0 | 52.3 | 51.5 | 0.788 |
| BMI (kg/m2) | 34.8 | 34.8 | 29.1 | 26.4 | < 0.001 |
p-value calculated from ANOVA test
Table 7.
Mean Value of Participant and Density Characteristics when Grouped by Quartiles of Participant Age
| Characteristic Being Averaged | 1st Quartile Mean Value | 2nd Quartile Mean Value | 3rd Quartile Mean Value | 4th Quartile Mean Value | p-value* |
|---|---|---|---|---|---|
|
| |||||
| Total Mammographic Area (cm2) | 214.7 | 236.6 | 212.3 | 244.0 | 0.404 |
| Dense Mammographic Area (cm2) | 27.9 | 42.1 | 48.7 | 48.8 | 0.007 |
| Non-Dense Mammographic Area (cm2) | 186.8 | 194.5 | 163.6 | 195.2 | 0.487 |
| Mammographic Percent Density (%) | 14.5 | 22.5 | 29.1 | 23.4 | 0.003 |
| Total Breast Volume (cm3) | 677.7 | 808.7 | 755.6 | 865.7 | 0.327 |
| Mean UST Sound Speed (km/s) | 1445.1 | 1448.9 | 1455.3 | 1451.6 | 0.011 |
| Age (years) | 62.6 | 53.4 | 47.7 | 42.0 | < 0.001 |
| BMI (kg/m2) | 32.1 | 31.1 | 30.1 | 31.7 | 0.696 |
p-value calculated from ANOVA test
Table 8.
Mean Value of Participant and Density Characteristics when Grouped by Quartiles of Participant BMI
| Characteristic Being Averaged | 1st Quartile Mean Value | 2nd Quartile Mean Value | 3rd Quartile Mean Value | 4th Quartile Mean Value | p-value* |
|---|---|---|---|---|---|
|
| |||||
| Total Mammographic Area (cm2) | 307.3 | 234.2 | 213.0 | 155.2 | < 0.001 |
| Dense Mammographic Area (cm2) | 35.8 | 40.9 | 40.7 | 49.9 | 0.224 |
| Non-Dense Mammographic Area (cm2) | 271.4 | 193.3 | 172.3 | 105.3 | < 0.001 |
| Mammographic Percent Density (%) | 12.5 | 19.7 | 21.2 | 35.8 | < 0.001 |
| Total Breast Volume (cm3) | 1045.3 | 909.1 | 735.5 | 428.5 | < 0.001 |
| Mean UST Sound Speed (km/s) | 1443.3 | 1447.1 | 1449.6 | 1460.8 | < 0.001 |
| Age (years) | 51.5 | 50.3 | 52.6 | 51.0 | 0.614 |
| BMI (kg/m2) | 42.0 | 32.8 | 28.0 | 22.4 | < 0.001 |
p-value calculated from ANOVA test
References
- 1.Huo CW, Chew GL, Britt KL, Ingman WV, Henderson MA, Hopper JL, Thompson EW. Mammographic density—a review on the current understanding of its association with breast cancer. Breast Cancer Research and Treatment. 2014;144(3):479–502. doi: 10.1007/s10549-014-2901-2. [DOI] [PubMed] [Google Scholar]
- 2.Pettersson A, Graff RE, Ursin G, Santos Silva Id, McCormack V, Baglietto L, Vachon C, Bakker MF, Giles GG, Chia KS, Czene K, Eriksson L, Hall P, Hartman M, Warren RML, Hislop G, Chiarelli AM, Hopper JL, Krishnan K, Li J, Li Q, Pagano I, Rosner BA, Wong CS, Scott C, Stone J, Maskarinec G, Boyd NF, van Gils CH, Tamimi RM. Mammographic Density Phenotypes and Risk of Breast Cancer: A Meta-analysis. Journal of the National Cancer Institute. 2014 doi: 10.1093/jnci/dju078. [DOI] [PMC free article] [PubMed] [Google Scholar]
- 3.Wolfe JN. Risk for breast cancer development determined by mammographic parenchymal pattern. Cancer. 1976;37(5):2486–2492. doi: 10.1002/1097-0142(197605)37:5<2486::aid-cncr2820370542>3.0.co;2-8. [DOI] [PubMed] [Google Scholar]
- 4.Byng JW, Boyd NF, Fishell E, Jong RA, Yaffe MJ. The quantitative analysis of mammographic densities. Physics in Medicine and Biology. 1994;39(10):1629. doi: 10.1088/0031-9155/39/10/008. [DOI] [PubMed] [Google Scholar]
- 5.Eng A, Gallant Z, Shepherd J, McCormack V, Li J, Dowsett M, Vinnicombe S, Allen S, dos-Santos-Silva I. Digital mammographic density and breast cancer risk: a case-control study of six alternative density assessment methods. Breast Cancer Res. 2014;16(5):439. doi: 10.1186/s13058-014-0439-1. [DOI] [PMC free article] [PubMed] [Google Scholar]
- 6.Ciatto S, Bernardi D, Calabrese M, Durando M, Gentilini MA, Mariscotti G, Monetti F, Moriconi E, Pesce B, Roselli A, Stevanin C, Tapparelli M, Houssami N. A first evaluation of breast radiological density assessment by QUANTRA software as compared to visual classification. The Breast. 2012;21(4):503–506. doi: 10.1016/j.breast.2012.01.005. [DOI] [PubMed] [Google Scholar]
- 7.Sak MA, Littrup PJ, Duric N, Mullooly M, Sherman ME, Gierach GL. Current and future methods for measuring breast density: a brief comparative review. Breast Cancer Management. 2015;4(4) doi: 10.2217/bmt.15.13. [DOI] [PMC free article] [PubMed] [Google Scholar]
- 8.Duric N, Littrup P, Babkin A, Chambers D, Azevedo S, Kalinin A, Pevzner R, Tokarev M, Holsapple E, Rama O, Duncan R. Development of ultrasound tomography for breast imaging: Technical assessment. Medical Physics. 2005;32(5):1375–1386. doi: 10.1118/1.1897463. [DOI] [PubMed] [Google Scholar]
- 9.Duric N, Littrup P, Poulo L, Babkin A, Pevzner R, Holsapple E, Rama O, Glide C. Detection of breast cancer with ultrasound tomography: First results with the Computed Ultrasound Risk Evaluation (CURE) prototype. Medical Physics. 2007;34(2):773–785. doi: 10.1118/1.2432161. [DOI] [PubMed] [Google Scholar]
- 10.Duric N, Boyd N, Littrup P, Sak M, Myc L, Li C, West E, Minkin S, Martin L, Yaffe M, Schmidt S, Faiz M, Shen J, Melnichouk O, Li Q, Albrecht T. Breast density measurements with ultrasound tomography: A comparison with film and digital mammography. Medical Physics. 2013;40(1):013501–12. doi: 10.1118/1.4772057. [DOI] [PMC free article] [PubMed] [Google Scholar]
- 11.Masugata H, Mizushige K, Senda S, Kinoshita A, Sakamoto H, Sakamoto S, Matsuo H. Relationship between myocardial tissue density measured by microgravimetry and sound speed measured by acoustic microscopy. Ultrasound in Medicine & Biology. 1999;25(9):1459–1463. doi: 10.1016/s0301-5629(99)00091-5. [DOI] [PubMed] [Google Scholar]
- 12.Mast TD. Empirical relationships between acoustic parameters in human soft tissues. Acoustics Research Letters Online. 2000;1(2):37–42. [Google Scholar]
- 13.Weiwad W, Heinig A, Goetz L, Hartmann H, Lampe D, Buchmann J, Millner R, Spielmann RP, Heywang-Koebrunner SH. Direct Measurement of Sound Velocity in Various Specimens of Breast Tissue. Investigative Radiology. 2000;35(12):721–726. doi: 10.1097/00004424-200012000-00005. [DOI] [PubMed] [Google Scholar]
- 14.Sak M, Duric N, Littrup P, Li C, Bey-Knight L, Sherman M, Boyd NF, Gierach G. Breast density measurements using ultrasound tomography for patients undergoing tamoxifen treatment. Proc SPIE8675, Medical Imaging 2013: Ultrasonic Imaging, Tomography, and Therapy. :8675. doi: 10.1117/12.2007146. [DOI] [PMC free article] [PubMed] [Google Scholar]
- 15.Sak MA. The role of tissue sound speed as a surrogate marker of breast density. Wayne State University; Ann Arbor: 2013. p. 225. [Google Scholar]
- 16.Khodr ZG, Sak MA, Pfeiffer RM, Duric N, Littrup P, Bey-Knight L, Ali H, Vallieres P, Sherman ME, Gierach GL. Determinants of the reliability of ultrasound tomography sound speed estimates as a surrogate for volumetric breast density. Medical Physics. 2015;42(10):5671–5678. doi: 10.1118/1.4929985. [DOI] [PMC free article] [PubMed] [Google Scholar]
- 17.Morrish OWE, Tucker L, Black R, Willsher P, Duffy SW, Gilbert FJ. Mammographic Breast Density: Comparison of Methods for Quantitative Evaluation. Radiology. 2015;275(2):356–365. doi: 10.1148/radiol.14141508. [DOI] [PubMed] [Google Scholar]
- 18.Bertrand KA, Scott CG, Tamimi RM, Jensen MR, Pankratz VS, Norman AD, Visscher DW, Couch FJ, Shepherd J, Chen YY, Fan B, Wu FF, Ma L, Beck AH, Cummings SR, Kerlikowske K, Vachon CM. Dense and Nondense Mammographic Area and Risk of Breast Cancer by Age and Tumor Characteristics. Cancer Epidemiology Biomarkers & Prevention. 2015;24(5):798–809. doi: 10.1158/1055-9965.EPI-14-1136. [DOI] [PMC free article] [PubMed] [Google Scholar]
- 19.Schetter S, Hartman T, Liao J, Richie J, Prokopczyk B, DuBrock C, Signori C, Hamilton C, Demers L, El-Bayoumy K, Manni A. Differential impact of body mass index on absolute and percent breast density: implications regarding their use as breast cancer risk biomarkers. Breast Cancer Research and Treatment. 2014;146(2):355–363. doi: 10.1007/s10549-014-3031-6. [DOI] [PubMed] [Google Scholar]


