

Abstract
Background
The aim of this study was to compare the microbiota community structure, assess differences in intestinal bacterial types, and identify metagenomic biomarkers for disparate stages of colorectal cancer formation.
Material/Methods
A total of 160 individuals were recruited: 61 cases with non-tumor colon were regarded as the normal group, 47 cases with histology-substantiated colorectal adenomas were regarded as the adenoma group, and 52 cases with invasive adenocarcinomas were regarded as the cancer group. Biopsy on the mucosa was performed on each subject. USEARCH was used to process the sequences data and generate OTUs. Gut mucosal microbiota from healthy controls, adenoma patients, and carcinoma patients were analyzed.
Results
Principal coordinate analysis of unweighted and weighted UniFrac distance showed a separation in composition of microbiota in the 3 groups. Bacteria with potential tumorigenesis, like Bacteroides fragilis and Fusobacterium, were more common in the carcinoma group, while some SCFA (short chain fatty acids) – producing microbes were enriched in the normal group. The commensal Escherichia were more abundant in adenoma patients.
Conclusions
Our study provides insights into possible function of gut microbiota in diagnosis and treatment of colorectal cancer. Some bacteria, such as Butyricicoccus, E. coli, and Fusobacterium, can be used as potential biomarkers for normal, adenoma, and cancer groups, respectively.
MeSH Keywords: Administration, Mucosal; Biological Markers; Colorectal Neoplasms; Microbiota
Background
Colorectal cancer (CRC) is one of the most common cancers worldwide. It is now the third most common cancer and the fourth leading cause of cancer-related mortality in the world, accounting for approximately 1.2 million new cases per year and approximately 600 000 deaths per year worldwide [1]. Although genetic predisposition is closely associated with some certain types of colorectal cancer, epidemiologic studies indicated that the Western lifestyle (such as in the USA) is the most important risk factor for this disease [2,3]. High rates of colorectal cancer are also related to age, sex, family history, excessive alcohol consumption, diets with high animal fat, and diets low in fruit and vegetable fiber [4].
Millions of microbiota exists in the gastrointestinal tract, and can be divided into 4 main categories: Firmicutes, Bacteroides, Actinobacteria, and Proteobacteria [5,6]. The complex gut microbiota plays an indispensable role in human health, as they interact with the immune system, maintain epithelial homeostasis, metabolize indigestible polysaccharides, and exclude potential pathogens from the human gut [7].
Colorectal cancer (CRC) screening greatly reduces CRC-related mortality and contributes to longer and healthier life [8]. The predictive biomarkers in CRC have received much attention in recent research [9–11]. However, fecal immunochemical tests cut-off levels still need to be optimized [12].
Recent studies have also elucidated specific traits in the gut microbiome associated with colorectal cancer and suggested that the microbiome may be useful in screening for colorectal cancer. Gut microbiota, combined with other noninvasive techniques, promises to provide highly effective tools for early colorectal cancer diagnosis and prevention [13].
The gut microbiota has been proved to be involved in the initiation and progression of colorectal cancer. Wang et al. [14] demonstrated that a structural difference observed in the fecal microbiota community of CRC patients was related with the non-cancerous population, and some microbiota belonging to the genera of Enterococcus, Escherichia/Shigella, Klebsiella, Streptococcus, and Peptostreptococcus were richer in CRC patients, while some microbiota belonging to the genus Roseburia and other butyrate-producing bacteria were less abundant in these patients. Some other studies found the genus Fusobacterium to be more predominant in colorectal adenoma and carcinoma tissues [15–17]. In addition, certain metagenomic contents and bacterial metabolites can also affect the development of CRC. For example, KEGG orthology (KO) modules for phosphotransferase systems, transporters for a number of different sugars, were overrepresented in healthy controls compared with adenoma samples or in adenoma compared with carcinoma samples, and modules for transporting the amino acids histidine, arginine, and lysine were enriched in carcinoma patients compared with adenoma patients in one study [18]. Due to the complicated ecosystem formed by intestinal microbiota, more investigation of colorectal cancer and intestinal microbiota is needed.
In this study, we used raw high-throughput 16S ribosomal RNA (rRNA) gene sequences data on the mucosal microbiome of 160 patients. We applied some advanced statistical tools, including linear discriminant analysis effect size (LEfSe) [19], to compare the microbiota community structure, assess differences in intestinal bacterial types between the groups, and identify metagenomic biomarkers for disparate stages of colorectal cancer formation.
Material and Methods
Data collection
The data collection of 16S ribosomal RNA (rRNA) gene sequences in this research came from a published paper in “The Journal of Nature Communication” dated October 2015 and downloaded from NCBI SRA database (BioProject ID: PRJNA280026) [20]. We recruited a total of 160 individuals: 61 cases with non-tumor colon were regarded as the normal group, 47 cases with histology-substantiated colorectal adenomas were regarded as the adenoma group, and 52 cases with invasive adenocarcinomas were regarded as the cancer group. Biopsy of the mucosa was performed for each subject. There were no significant differences in clinical parameters among the 3 groups except for age (60.13±5.99, 67.32±8.80, and 67.85±13.18 for normal, adenoma, and cancer groups, respectively) (p<0.001).
Microbial sequence processing and analysis
USEARCH was used to process the sequences data and generate OTUs. Briefly, after quality control steps for all the sequences, UPARSE [21] was applied to cluster sequences into OTUs with 95% similarity and select representative sequences for all the OTUs. After removing chimeras from these representative sequences using UCHIME [22], we classified them using Ribosomal Database Project (RDP) classifiers [23] against the Greengene database V201305 [24]. An 80% threshold value was used to assign to a taxonomic group if a representative sequence was longer than 250 bp; otherwise, we set the threshold value to 50%. Then, we removed the OTUs if they were classified as archaea or fungi. Finally, the annotated OTUs were assigned to phylotypes according to their consensus taxonomy.
Statistical analysis
α-diversity analysis (including the indexes of Chao1, Shannon, and Simpson) was performed using R language. Unweighted UniFrac and weighted UniFrac distance metrics analysis [25] was carried out using QIIME [26] and illustrated by principle coordinate analysis (PCoA). Permutational multivariate analysis of variance (PERMANOVA) [27] was preformed to access the dissimilarities between groups using the unweighted UniFrac and weighted UniFrac distance metrics. We did it with the vegan package in R (the function of ADONIS) [28]. The heatmap of genus information was constructed using the pheatmap package in R.
We also introduced linear discriminant analysis effect size (LEfSe) [19], which is a very useful method to find significant metagenome markers, to identify bacterial biomarkers for all 3 groups on the open website (http://huttenhower.sph.harvard.edu/galaxy). We set an α-value <0.05, and the threshold used to consider a discriminative feature for the logarithmic LDA score was set at >2.
Wilcoxon and Kruskal-Wallis rank tests were conducted in R, and the p values were adjusted using Benjamin-Hochberg method. A Benjamin-Hochberg q value <0.1 was considered to be significant.
Results
Summary of the study
A total of 1 012 335 16S rRNA sequences were obtained from the 160 samples, with an average of 6327 reads per sample in the whole cohort. The average number of reads per sample in the normal, adenoma, and cancer groups was 5547, 6968, and 6662, respectively.
We generated OTUs at 95% similarity level and the number of OTUs was 605, with 445 OTUs in the normal group, 417 OTUs in the adenoma group, and 482 OTUs in the cancer group.
Richness and diversity analysis
The Chao1 Richness Index, Shannon Index, and Simpson Diversity Index were used to describe the α diversity features of our bacterial community results. We found that the Chao1 Richness Index of the mucosal microbiota was significantly different in the 3 groups (Chao1 Richness Index for normal, adenoma, and cancer group were 66.4±32.6, 61.9±29.3, and 87.8±37.5, respectively, p=0.0006, Figure 1A), while the Shannon Index and Simpson Index in the 3 groups were not significantly different: the Shannon Index for normal, adenoma, and cancer groups were 2.36±0.84, 2.28±0.82, and 2.59±0.70, respectively, p=0.22 (Figure 1B), and the Simpson Index for normal, adenoma, and cancer groups were 0.22±0.21, 0.25±0.212, and 0.17±0.13, respectively, p=0.20 (Figure 1C) (Table 1).
Figure 1.

Analysis of Chao1 Richness Index, Shannon Index, and Simpson Diversity Index in different groups. (A) Boxplots of Chao1 Richness Index. (B) Boxplots of Shannon Diversity Index. (C) Boxplots of Simpson Diversity Index.
Table 1.
Richness and diversity analysis and bacteria at the phylum level in this study.
| Normal group n=61 | Adenoma group n=47 | Cancer group n=52 | |
|---|---|---|---|
| Chao1 Richness Index | 66.4±32.6 | 61.9±29.3 | 87.8±37.5 |
| Shannon Index | 2.36±0.84 | 2.28±0.82 | 2.59±0.70 |
| Simpson Index | 0.22±0.21 | 0.25±0.212 | 0.17±0.13 |
| Firmicutes | 33.86% | 32.44% | 41.87% |
| Fusobacteria | 9.57% | 5.22% | 17% |
| Proteobacteria | 31.19% | 39.92% | 13.34% |
| Bacteroides | 16.60% | 16.61% | 17.31% |
| Escherichia | 18.80% | 22.33% | 6.79% |
| Fusobacterium | 9.39% | 3.12% | 14.52% |
| Streptococcus | 6.76% | 5.06% | 8.69% |
Principal coordinate analysis (PCoA) based on the unweighted UniFrac distance metrics demonstrated that there was a separation in the mucosal bacteria communities between the 3 groups, which was confirmed by permutational multivariate analysis of variance (PERMANOVA) (ADONIS, normal-adenoma: R2=0.015, p=0.05; normal-cancer: R2=0.051, p=0.01; adenoma-cancer: R2=0.059, p=0.01) (Figure 2A). Similar results were observed in PCoA on the basis of weighted UniFrac distance metrics (Figure 2B).
Figure 2.

Variation in mucosal microbiota in normal, adenoma, and cancer patients demonstrated by PCoA plots. (A) The distinction of microbiota composition in unweighted analysis confirmed by PERMANOVA test. (B) The distinction of microbiota composition in weighted analysis confirmed by PERMANOVA test.
Taxa analysis at the phylum and genus levels
The abundance of different phyla and genera were assessed by taxonomic assignment of all sequences [14]. Among all bacteria at the phylum level, the predominant phyla were Bacteroidetes, Firmicutes, Fusobacteria, and Proteobacteria (Figure 3A). Further comparison of the relative abundances of different phyla showed that there was no significant difference for any phylum between the normal and adenoma groups. However, Firmicutes and Fusobacteria were enriched in the cancer group compared with the normal and adenoma groups (Firmicutes: 41.87% vs. 33.86% in cancer and normal groups, respectively, q=0.07; 41.87% vs. 32.44% in cancer and adenoma groups, respectively, q=0.05. Fusobacteria: 17% vs. 9.57% in cancer and normal groups, respectively, q=0.008; 17% vs. 5.22% in cancer and adenoma groups, respectively, q<0.001). Proteobacteria was relatively scarce in the cancer group compared with the normal and adenoma groups (13.34% vs. 31.19% vs. 39.92% in cancer, normal and adenoma groups, respectively, q<0.001 for both comparisons).
Figure 3.

Taxa analysis at the phylum and genus levels. (A) Proportions of main bacterial phyla in the 3 groups. (B) Relative abundances of some major genera across all samples. Each row represents 1 genus and each column represents 1 sample. The first row shows the groups of every sample (red). The clustering tree of samples was generated using euclidean distance with complete method. The color intensity of each genus is proportional to its relative abundance in each sample.
There was a total of 148 genera at the genus levels, and the dominant genera were: Bacteroides (16.60%, 16.61% and 17.31% in normal, adenoma and cancer group, respectively); Escherichia (18.80%, 22.33% and 6.79% in 3 groups, respectively); Fusobacterium (9.39%, 3.12% and 14.52% in 3 groups, respectively); and Streptococcus (6.76%, 5.06% and 8.69% in 3 groups, respectively) (Figure 3B) (Table 1).
Statistically, the relative abundances of Campylobacter, Dialister, Fusobacterium, Leptotrichia, Mogibacterium, Parvimonas, and Peptostreptococcus were significantly higher in cancer patients than in normal controls and adenoma patients. Higher levels of Acidomonas, Escherichia, Pseudomonas, and Sphingomonas were observed in the normal or adenoma groups compared with the cancer group. Blautia and Faecalibacterium were overrepresented in normal controls compared with the cancer group, whereas Lactobacillus was enriched in cancer patients compared with the normal group. Prevotella, a genus belonging to the phylum Bacteroidetes, was more abundant in the cancer group than in the adenoma group. Consistent with the outcomes of phylum levels, no significant difference in the genus levels was found between the normal and adenoma groups.
Identification of key taxa (biomarkers) responsible for structural diversion of the mucosa-associated microbiota
We used the linear discriminative analysis (LDA) effect size (LEfSe) biomarker discovery tool to assess which microbiota were driving divergence between different groups, using the parameters described above. Biomarker discovery was performed at all taxonomic levels. At the genus level, Acidomonas (LDA=3.8, p<0.01), Butyricicoccus (LDA=2.9, p=0.04), Micrococcus (LDA=3.1, p=0.04), and Sphingomonas (LDA=3.6, p<0.01) were the biomarkers for the normal group. Bacillus (LDA=3.5, p=0.05), Eikenella (LDA=2.5, p<0.01), Enhydrobacter (LDA=2.8, p<0.01), Escherichia (LDA=4.9, p<0.01), Klebsiella (LDA=3.7, p=0.04), Paenibacillus (LDA=3.3, p=0.01), Pseudomonas (LDA=3.9, p<0.01), Staphylococcus (LDA=4.1, p<0.01), and Trabulsiella (LDA=4.1, p=0.03) were the biomarkers for the adenoma group. In the cancer group, we observed 20 biomarkers. Eleven genera belonged to the phylum Firmicutes: Bulleidia (LDA=3.7, p=0.01); Catonella (LDA=2.8, p=0.02); Clostridium (LDA=3.5, p=0.05); Dialister (LDA=3.1, p<0.01); Granulicatella (LDA=4.0, p=0.04); Lactobacillus (LDA=3.3, p<0.01); Mogibacterium (LDA=3.2, p=0.01); Oscillospira (LDA=3.4, p=0.01); Parvimonas (LDA=4.4, p<0.01); Peptostreptococcus (LDA=4.0, p<0.01); and Streptococcus (LDA=4.3, p=0.03). Four genera belonged the phylum Bacteroidetes: Odoribacter (LDA=2.9, p=0.01); Paraprevotella (LDA=4.0, p<0.01); Porphyromonas (LDA=3.6, p=0.02); and Prevotella (LDA=4.1, p<0.01). Two belonged to Fusobacteria: Fusobacterium (LDA=4.7, p<0.01) and Leptotrichia (LDA=4.1, p<0.01). Two belonged to Proteobacteria: Campylobacter (LDA=4.1, p<0.01) and Desulfovibrio (LDA=3.1, p=0.02). One belonged to Spirochaetes: Treponema (LDA=3.4, p<0.01). Most of these microbiota had an LDA score higher than 3.0 (Figure 4).
Figure 4.
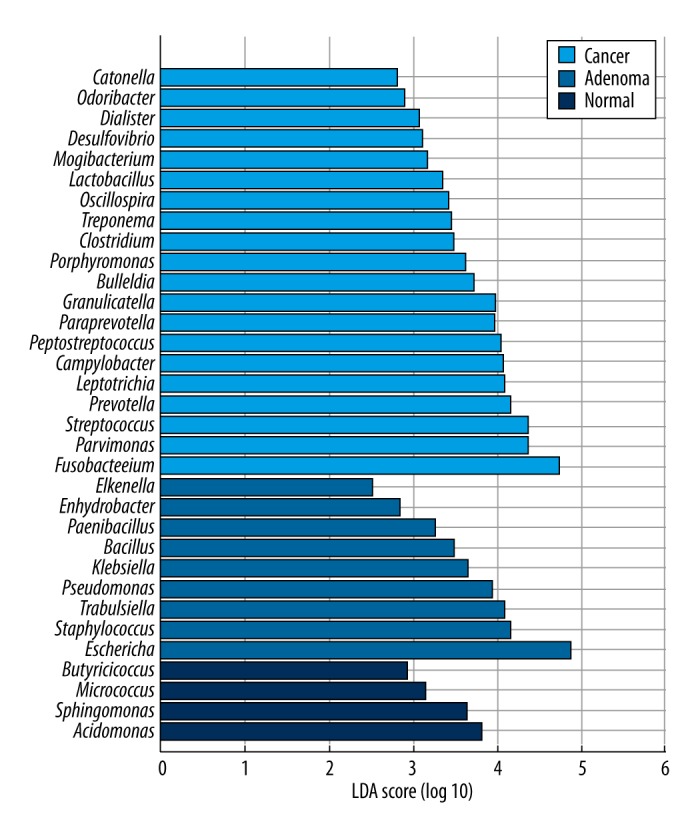
Linear discriminative analysis (LDA) effect size (LEfSe) analysis for taxonomic biomarkers on genus level in the 3 groups. Each color represents 1 group.
Discussion
Although the etiology of CRC is multifactorial and complex, there is increasing evidence that gut microbiota and their metabolism are closely linked to CRC development [29]. In our study, we revealed differing mucosa-associated microbiota structure with the development of CRC, which has been addressed by several other publications [20,30,31]. Similar microbial shift has also been reported in IBDs such as Crohn’s disease (CD) [17] and ulcerative colitis (UC) [32], as well as in diarrhea [33] and IBS [34].
Fusobacterium, a genus belonging to the phylum Fusobacteria, has been reported to be able to potentiate CRC. Kostic et al. [35] reported that a specific strain of Fusobacterium, F. nucleatum, increased tumor burden and selectively expanded myeloid-derived immune cells like CD11b+ myeloid cells and myeloid-derived suppressor cells (MDSCs) in ApcMin/+ mice. They also observed a strong correlation between F. nucleatum abundance and expression of proinflammatory markers such as COX-2, IL-8, IL-6, IL-1b, and TNF-α in the mouse experiments and human colon samples. Kostic et al. suggested that Fusobacteria create a proinflammatory microenvironment that is favorable for colorectal carcinogenesis through recruitment of tumor-infiltrating immune cells. Rubinstein et al. [36] showed the adhesin FadA, a virulence factor found in F. nucleatum [37], mediates the growth of CRC cells via activation of β-catenin signaling by binding to E-cadherin. Furthermore, the antitumor activity of immune cell can be inhibited by Fap2 protein of F. nucleatum via TIGIT (T cell immunoreceptor with Ig and ITIM domains), which in turn promotes CRC development [38]. In the present study, we observed a greater abundance of Fusobacterium in cancer tissues than in normal tissues (14.52% vs. 9.39%, respectively, q=0.02) and adenoma tissues (14.52% vs. 3.12%, respectively, q=0.00). Thus, the increased abundance of Fusobacterium could be linked with high risk of CRC. Some CRC-associated biomarkers, such as Parvimonas, Peptostreptococcus, and the species Porphyromonas endodontalis (LDA=3.3, p=0.002), were also identified in our study. These microbes can corporate with other bacteria of oral origin such as Fusobacterium to form a strong symbiotic network. Further studies on their potential oncogenic functions will reveal whether there are drivers or passengers in colorectal tumorigenesis [20].
Another CRC-related pathogen identified in our study is Bacteroides fragilis (LDA=4.6, p<0.01). Enterotoxigenic B. fragilis, a commensal in the human colon, triggers colitis and induces colonic tumors via a selective T helper type 17 (TH17) response [39]. Non-toxigenic B. fragilis can suppressing inflammatory response in animal experimental colitis models induced by Helicobacter hepaticus infection through a single microbial molecule (polysaccharide A, PSA) [40]. Thus, more detailed studies at the gene or strain level are required for a comprehensive understanding of gut microbes in the pathogenesis of CRC. Moreover, Prevotella, of the phylum Bacteroidetes, was enriched in the cancer group (3.57% of the total) compared with the normal (1.45% of the total) and adenoma groups (0.47% of the total). Although Prevotella is more common in non-Westerners, who prefer a plant-rich diet [41], and an increased level of Prevotella accompanied by some special dietary intervention creates a propitious condition for glucose metabolism [42], it is also relevant in some inflammatory conditions like arthritis [43]. Protein-rich diets tend to be rich in arginine and tryptophan. Arginine and tryptophan are linked by an entwined pathway in immunometabolism and their joint modulation could be an important target for effective immunotherapy in several diseases [44]. Further research is needed on the potential role of Prevotella in CRC.
One feature of the compositional imbalance in the gut microbiota of CRC patients is a depletion of some SCFA (short chain fatty acids)-producing microbes. SCFAs, including acetate, propionate, and butyrate, are absorbed rapidly by colonic epithelial cells [45]. Acetate enters the blood and is used primarily for lipogenesis by peripheral tissues, and propionate is mainly used by hepatocytes for the function of gluconeogenesis, while butyrate is a major energy source for colon cells [46–48]. These small molecules can help maintain normal function of colonic epithelial cells, exert an anti-inflammatory role, and inhibit tumor cell growth [49,50]. Notably, Faecalibacterium prausnitzii has shown a potential effect as a probiotic in the treatment of Crohn’s disease [51]. In our study, we detected a higher level of F. Prausnitzii (8.88% vs. 4.54%, respectively, q=0.03) and Blautia (5.96% vs. 2.78%, respectively, q=0.02) in the normal group than in the cancer group. Our data suggest a protective role of SCFA-producing bacteria in CRC.
Escherichia coli is one of the most abundant commensals in the human gut. It is reported that E. coli is associated with IBD [52]. In addition, certain E. coli strains that harbor the polyketide synthetase (pks) island are able to induce DNA damage, which in turn increases the mutation rate of infected cells and leads to tumor progression [53]. In our study, we detected a lower level of E. coli in cancer patients (6.76%) than in health controls (18.80%) and adenoma patients (22.33%). E. coli was a candidate adenoma-associated biomarker. These phenomena can partly be explained by the bacterial driver-passenger model for CRC, in which some drivers like E. coli colonize on the colonic mucosa of individuals susceptible to developing CRC, which changes the microenvironment in favor of adenoma-carcinoma processes, and then are outcompeted by passengers who are likely to flourish in the altered microenvironment [54].
Our study has certain limitations. We were unable to unravel the causal relationship between gut microbiota and CRC. Because we only collected data after diagnosis of colorectal tumor, the differences in bacterial composition could be a consequence of CRC. For example, there is always a lower pH in the tumor environment [55], and Walker et al. discovered that a tiny change in pH will cause massive fluctuations in gut microbes, including the genus Fusobacterium [56]. The genetic phenotype proved to be associated with the disease was not investigated in our study. Therefore, a better way to illustrate the roles of gut microbiota in CRC is through gut microbiota transplantation from healthy donors [57]. Due to interpersonal variations in gut microbiota, some mixed factors could not be balanced. The cancer patients in our study tended to be older than in the other 2 groups, and age has a fundamental influence on gut microbiota (e.g., older people tend to have a higher proportion of Bacteroides spp. and distinct abundance patterns of Clostridium groups) [58]. Diet, lifestyle, and genetics can also affect gut microbiome structure. Further studies controlling these factors are needed for a more comprehensive demonstration of the possible influence of intestinal microflora on CRC.
Conclusions
In conclusion, our study showed differences in gut microbial composition by comparing normal individuals with patients in 2 stages of CRC-adenoma and adenocarcinoma. We also identified some bacteria such as Butyricicoccus, E. coli, and Fusobacterium that can be used as potential biomarkers for normal, adenoma, and cancer groups, respectively.
Footnotes
Conflict of interest
None.
Source of support: Departmental sources
References
- 1.Ferlay J, Shin HR, Bray F, et al. GLOBOCAN 2008 – cancer incidence and mortality worldwide: IARC CancerBase No. 10. Lyon: International Agency for Research on Cancer; 2010. [accessed April 19, 2013]. http://globocan.iarc.fr. [Google Scholar]
- 2.Vogelstein B, Kinzler KW. The multistep nature of cancer. Trends Genet. 1993;9:138–41. doi: 10.1016/0168-9525(93)90209-z. [DOI] [PubMed] [Google Scholar]
- 3.Watson AJ, Collins PD. Colon cancer: A civilization disorder. Dig Dis. 2011;29:222–28. doi: 10.1159/000323926. [DOI] [PubMed] [Google Scholar]
- 4.Colorectal cancer risk factors. 2009. [accessed Feb 2, 2010]. http://www.cdc.gov/cancer/colorectal/basic_info/risk_factors.htm.
- 5.Qin J, Li R, Raes J, et al. A human gut microbial gene catalogue established by metagenomic sequencing. Nature. 2010;464:59–65. doi: 10.1038/nature08821. [DOI] [PMC free article] [PubMed] [Google Scholar]
- 6.Eckburg PB, Bik EM, Bernstein CN, et al. Diversity of the human intestinal microbial flora. Science. 2005;308:1635–38. doi: 10.1126/science.1110591. [DOI] [PMC free article] [PubMed] [Google Scholar]
- 7.Gill SR, Pop M, Deboy RT, et al. Metagenomic analysis of the human distal gut microbiome. Science. 2006;312:1355–59. doi: 10.1126/science.1124234. [DOI] [PMC free article] [PubMed] [Google Scholar]
- 8.Kuipers EJ. Colorectal cancer: Screening-one small step for mankind, one giant leap for man. Nat Rev Clin Oncol. 2014;11(1):5–6. doi: 10.1038/nrclinonc.2013.213. [DOI] [PubMed] [Google Scholar]
- 9.Dong SJ, Cai XJ, Li SJ, et al. The clinical significance of MiR-429 as a predictive biomarker in colorectal cancer patients receiving 5-fluorouracil treatment. Med Sci Monit. 2016;22:3352–61. doi: 10.12659/MSM.900674. [DOI] [PMC free article] [PubMed] [Google Scholar]
- 10.Uçmak F, Tuncel ET. Relationship between lesions in adenomatous polyp-dysplasia-colorectal cancer sequence and neutrophil-to-lymphocyte ratio. Med Sci Monit. 2016;22:4536–41. doi: 10.12659/MSM.898879. [DOI] [PMC free article] [PubMed] [Google Scholar]
- 11.Lv C, Zhao X, Gu H, et al. Involvement of activated Cdc42 kinase1 in colitis and colorectal neoplasms. Med Sci Monit. 2016;22:4794–802. doi: 10.12659/MSM.902274. [DOI] [PMC free article] [PubMed] [Google Scholar]
- 12.Toes-Zoutendijk E, van Leerdam ME, Dekker E, et al. Real-time monitoring of results during first year of dutch colorectal cancer screening program and optimization by altering fecal immunochemical test cut-off levels. Gastroenterology. 2017;152(4):767–75.e2. doi: 10.1053/j.gastro.2016.11.022. [DOI] [PubMed] [Google Scholar]
- 13.Narayanan V, Peppelenbosch MP, Konstantinov SR. Human fecal microbiome-based biomarkers for colorectal cancer. Cancer Prev Res (Phila) 2014;7(11):1108–11. doi: 10.1158/1940-6207.CAPR-14-0273. [DOI] [PubMed] [Google Scholar]
- 14.Wang T, Cai G, Qiu Y, et al. Structural segregation of gut microbiota between colorectal cancer patients and healthy volunteers. ISME J. 2012;6:320–29. doi: 10.1038/ismej.2011.109. [DOI] [PMC free article] [PubMed] [Google Scholar]
- 15.Kostic AD, Gevers D, Pedamallu CS, et al. Genomic analysis identifies association of Fusobacterium with colorectal carcinoma. Genome Res. 2012;22:292–98. doi: 10.1101/gr.126573.111. [DOI] [PMC free article] [PubMed] [Google Scholar]
- 16.Castellarin M, Warren RL, Freeman JD, et al. Fusobacterium nucleatum infection is prevalent in human colorectal carcinoma. Genome Res. 2012;22:299–306. doi: 10.1101/gr.126516.111. [DOI] [PMC free article] [PubMed] [Google Scholar]
- 17.Gevers D, Kugathasan S, Denson LA, et al. The treatment-naive microbiome in new-onset Crohn’sdisease. Cell Host Microbe. 2014;15:382–92. doi: 10.1016/j.chom.2014.02.005. [DOI] [PMC free article] [PubMed] [Google Scholar]
- 18.Feng Q, Liang S, Jia H, et al. Gut microbiome development along the colorectal adenoma-carcinoma sequence. Nat Commun. 2015;6:6528. doi: 10.1038/ncomms7528. [DOI] [PubMed] [Google Scholar]
- 19.Segata N, Izard J, Waldron L, et al. Metagenomic biomarker discovery and explanation. Genome Biol. 2012;12:R60. doi: 10.1186/gb-2011-12-6-r60. [DOI] [PMC free article] [PubMed] [Google Scholar]
- 20.Nakatsu G, Li X, Zhou H, et al. Gut mucosal microbiome across stages of colorectal carcinogenesis. Nat Commun. 2015;6:8727. doi: 10.1038/ncomms9727. [DOI] [PMC free article] [PubMed] [Google Scholar]
- 21.Edgar RC. UPARSE: Highly accurate OTU sequences from microbial amplicon reads. Nat Methods. 2013;10:996–98. doi: 10.1038/nmeth.2604. [DOI] [PubMed] [Google Scholar]
- 22.Edgar RC, Haas BJ, Clemente JC, et al. UCHIME improves sensitivity and speed of chimera detection. Bioinformatics. 2011;27:2194–200. doi: 10.1093/bioinformatics/btr381. [DOI] [PMC free article] [PubMed] [Google Scholar]
- 23.Wang Q, Garrity GM, Tiedje JM, et al. Naive Bayesian classifier for rapid assignment of rRNA sequences into the new bacterial taxonomy. Appl Environ Microbiol. 2007;73:5261–67. doi: 10.1128/AEM.00062-07. [DOI] [PMC free article] [PubMed] [Google Scholar]
- 24.DeSantis TZ, Hugenholtz P, Larsen N, et al. Greengenes, a chimera-checked 16S rRNA gene database and workbench compatible with ARB. Appl Environ Microbiol. 2006;72:5069–72. doi: 10.1128/AEM.03006-05. [DOI] [PMC free article] [PubMed] [Google Scholar]
- 25.Lozupone C, Knight R. UniFrac: A new phylogenetic method for comparing microbial communities. Appl Environ Microbiol. 2005;71:8228–35. doi: 10.1128/AEM.71.12.8228-8235.2005. [DOI] [PMC free article] [PubMed] [Google Scholar]
- 26.Caporaso JG, Kuczynski J, Stombaugh J, et al. QIIME allows analysis of high-throughput community sequencing data. Nat Methods. 2012;7:335–36. doi: 10.1038/nmeth.f.303. [DOI] [PMC free article] [PubMed] [Google Scholar]
- 27.McArdle BH, Anderson MJ. Fitting multivariate models to community data: A comment on distance-based redundancy analysis. Ecology. 2001;82:290–97. [Google Scholar]
- 28.Oksanen J, Blanchet FG, Kindt R, et al. Vegan: Community Ecology Package. 2011. http://CRAN.R-project.org.
- 29.Kostic AD, Chun E, Robertson L, et al. Fusobacterium nucleatum potentiates intestinal tumorigenesis and modulates the tumor-immune microenvironment. Cell Host Microbe. 2013;14:207–15. doi: 10.1016/j.chom.2013.07.007. [DOI] [PMC free article] [PubMed] [Google Scholar]
- 30.Chen W, Liu F, Ling Z, et al. Human intestinal lumen and mucosa-associated microbiota in patients with colorectal cancer. PLoS One. 2012;7(6):e39743. doi: 10.1371/journal.pone.0039743. [DOI] [PMC free article] [PubMed] [Google Scholar]
- 31.Allali I, Delgado S, Marron PI, et al. Gut microbiome compositional and functional differences between tumor and non-tumor adjacent tissues from cohorts from the US and Spain. Gut Microbes. 2015;3:161–72. doi: 10.1080/19490976.2015.1039223. [DOI] [PMC free article] [PubMed] [Google Scholar]
- 32.Walujkar SA, Dhotre DP, Marathe NP, et al. Characterization of bacterial community shift in human Ulcerative Colitis patients revealed by Illumina based 16S rRNA gene amplicon sequencing. Gut Pathogens. 2014;6:22. doi: 10.1186/1757-4749-6-22. [DOI] [PMC free article] [PubMed] [Google Scholar]
- 33.Pop M, Walker AW, Paulson J, et al. Diarrhea in young children from low-income countries leads to large-scale alterations in intestinal microbiota composition. Genome Biol. 2014;15:R76. doi: 10.1186/gb-2014-15-6-r76. [DOI] [PMC free article] [PubMed] [Google Scholar]
- 34.Kassinen A, Krogius-Kurikka L, Mäkivuokko H, et al. The fecal microbiota of irritable bowel syndrome patients differs significantly from that of healthy subjects. Gastroenterology. 2007;133:24–33. doi: 10.1053/j.gastro.2007.04.005. [DOI] [PubMed] [Google Scholar]
- 35.Kostic AD, Chun E, Robertson L, et al. Fusobacterium nucleatum potentiates intestinal tumorigenesis and modulates the tumor-immune microenvironment. Cell Host Microbe. 2013;14:207–15. doi: 10.1016/j.chom.2013.07.007. [DOI] [PMC free article] [PubMed] [Google Scholar]
- 36.Rubinstein MR, Wang X, Liu W, et al. Fusobacterium nucleatum promotes colorectal carcinogenesis by modulating E-cadherin/beta-catenin signaling via its FadA adhesin. Cell Host Microbe. 2013;14:195–206. doi: 10.1016/j.chom.2013.07.012. [DOI] [PMC free article] [PubMed] [Google Scholar]
- 37.Han YW, Ikegami A, Rajanna C, et al. Identification and characterization of a novel adhesin unique to oral fusobacteria. J Bacteriol. 2005;187:5330–40. doi: 10.1128/JB.187.15.5330-5340.2005. [DOI] [PMC free article] [PubMed] [Google Scholar]
- 38.Gur C, Ibrahim Y, Isaacson B, et al. Binding of the Fap2 protein of Fusobacterium nucleatum to human inhibitory receptor TIGIT protects tumors from immune cell attack. Immunity. 2015;42:344–55. doi: 10.1016/j.immuni.2015.01.010. [DOI] [PMC free article] [PubMed] [Google Scholar]
- 39.Wu S, Rhee KJ, Albesiano E, et al. A human colonic commensal promotes colon tumorigenesis via activation of T helper type 17T cell responses. Nat Med. 2009;15:1016–22. doi: 10.1038/nm.2015. [DOI] [PMC free article] [PubMed] [Google Scholar]
- 40.Mazmanian SK, Round JL, Kasper DL, et al. A microbial symbiosis factor prevents intestinal inflammatory disease. Nature. 2008;453:620–25. doi: 10.1038/nature07008. [DOI] [PubMed] [Google Scholar]
- 41.Martínez I, Stegen JC, Maldonado-Gómez MX, et al. The gut microbiota of rural Papua New Guineans: Composition, diversity patterns, and ecological processes. Cell Rep. 2015;11:527–38. doi: 10.1016/j.celrep.2015.03.049. [DOI] [PubMed] [Google Scholar]
- 42.Kovatcheva-Datchary P, Nilsson A, Akrami R, et al. Dietary fiber-induced improvement in glucose metabolism is associated with increased abundance of Prevotella. Cell Metab. 2015;22:971–82. doi: 10.1016/j.cmet.2015.10.001. [DOI] [PubMed] [Google Scholar]
- 43.Scher JU, Sczesnak A, Longman RS, et al. Expansion of intestinal Prevotella copri correlates with enhanced susceptibility to arthritis. eLIFE. 2013;2:e01202. doi: 10.7554/eLife.01202. [DOI] [PMC free article] [PubMed] [Google Scholar]
- 44.Mondanelli G, Bianchi R, Pallotta MT, et al. A relay pathway between arginine and tryptophan metabolism confers immunosuppressive properties on dendritic cells. Immunity. 2017;46(2):233–44. doi: 10.1016/j.immuni.2017.01.005. [DOI] [PMC free article] [PubMed] [Google Scholar]
- 45.Zhang J, Guo Z, Xue Z, et al. A phylo-functional core of gut microbiota in healthy young Chinese cohorts across lifestyles, geography and ethnicities. ISME J. 2015;9:1979–90. doi: 10.1038/ismej.2015.11. [DOI] [PMC free article] [PubMed] [Google Scholar]
- 46.Pomare EW, Branch WJ, Cummings JH. Carbohydrate fermentation in the human colon and its relation to acetate concentrations in venous blood. J Clin Invest. 1985;75:1448–54. doi: 10.1172/JCI111847. [DOI] [PMC free article] [PubMed] [Google Scholar]
- 47.Scott KP, et al. Dietary fiber and the gut microbiota. Nutr Bull. 2008;33:201–11. [Google Scholar]
- 48.Pryde SE, Duncan SH, Hold GL, et al. The microbiology of butyrate formation in the human colon. FEMS Microbiol Lett. 2002;217:133–39. doi: 10.1111/j.1574-6968.2002.tb11467.x. [DOI] [PubMed] [Google Scholar]
- 49.Peng L, Li ZR, Green RS, et al. Butyrate enhances the intestinal barrier by facilitating tight junction assembly via activation of AMP activated protein kinase in Caco-2 cell monolayers. J Nutr. 2009;139:1619–25. doi: 10.3945/jn.109.104638. [DOI] [PMC free article] [PubMed] [Google Scholar]
- 50.Rose DJ, DeMeo MT, Keshavarzian A, Hamaker BR. Influence of dietary fiber on inflammatory bowel disease and colon cancer: Importance of fermentation pattern. Nutr Rev. 2007;65:51–62. doi: 10.1111/j.1753-4887.2007.tb00282.x. [DOI] [PubMed] [Google Scholar]
- 51.Sokol H, Pigneur B, Watterlot L, et al. Faecalibacterium prausnitzii is an anti-inflammatory commensal bacterium identified by gut microbiota analysis of Crohn disease patients. Proc Natl Acad Sci USA. 2008;105:16731–36. doi: 10.1073/pnas.0804812105. [DOI] [PMC free article] [PubMed] [Google Scholar]
- 52.Rolhion N, Darfeuille-Michaud A. Adherent-invasive Escherichia coli in inflammatory bowel disease. Inflamm Bowel Dis. 2007;13:1277–83. doi: 10.1002/ibd.20176. [DOI] [PubMed] [Google Scholar]
- 53.Cuevas-Ramos G, Petit CR, Marcq I, et al. Escherichia coli induces DNA damage in vivo and triggers genomic instability in mammalian cells. Proc Natl Acad Sci USA. 2010;107:11537–42. doi: 10.1073/pnas.1001261107. [DOI] [PMC free article] [PubMed] [Google Scholar]
- 54.Tjalsma H, Boleij A, Marchesi JR, Dutilh BE, et al. A bacterial driver-passenger model for colorectal cancer: Beyond the usual suspects. Nat Rev Microbiol. 2012;10:575–82. doi: 10.1038/nrmicro2819. [DOI] [PubMed] [Google Scholar]
- 55.Griffiths JR. Are cancer cells acidic? Br J Cancer. 1991;64:425–27. doi: 10.1038/bjc.1991.326. [DOI] [PMC free article] [PubMed] [Google Scholar]
- 56.Walker AW, Duncan SH, McWilliam Leitch EC, et al. pH and peptide supply can radically alter bacterial populations and short-chain fatty acid ratios within microbial communities from the human colon. Appl Environ Microbiol. 2005;71:3692–700. doi: 10.1128/AEM.71.7.3692-3700.2005. [DOI] [PMC free article] [PubMed] [Google Scholar]
- 57.Borody TJ, Warren EF, Leis S, et al. Treatment of ulcerative colitis using fecal bacteriotherapy. J Clin Gastroenterol. 2003;37:42–47. doi: 10.1097/00004836-200307000-00012. [DOI] [PubMed] [Google Scholar]
- 58.Claesson MJ, Cusack S, O’Sullivan O, et al. Composition, variability, and temporal stability of the intestinal microbiota of the elderly. Proc Natl Acad Sci USA. 2011;108:4586–91. doi: 10.1073/pnas.1000097107. [DOI] [PMC free article] [PubMed] [Google Scholar]