

Abstract
Breast density is one of the strongest predictors of breast cancer risk. Women with the densest breasts are 4 to 6 times more likely to develop cancer compared with those with the lowest densities. Breast density is generally assessed using mammographic imaging; however, this approach has limitations. Magnetic resonance imaging and ultrasound tomography are some alternative imaging modalities that can aid mammography in patient screening and the measurement of breast density. As breast density becomes more commonly discussed, knowledge of the advantages and limitations of breast density as a marker of risk will become more critical. This review article discusses the relationship between breast density and breast cancer risk, lists the benefits and drawbacks of using multiple different imaging modalities to measure density and briefly discusses how breast density will be applied to aid in breast cancer prevention and treatment.
Keywords: Breast density, Breast cancer risk, Mammography, Ultrasound tomography
Introduction
Breast cancer is the most common type of cancer among women in North America, accounting for approximately 1 in 3 cancers diagnosed. Breast cancer death rates began to decrease in the United States in 1990[1]. This reduction reflects improvements in breast cancer treatment and possibly early detection via mammographic screening, though the role of screening is controversial. Additional effects that could also help explain the reduction include temporal changes in the frequencies of specific tumors types in response to a shift in prevalence of risk factors[2].
Available breast cancer risk prediction models have generally good ability to predict the number of breast cancers that will develop in a specific population (calibration)[3], but assessment of individual risk (discrimination) is limited[4]. Expansion of these models to include additional factors could improve discrimination. Of the many risk factors listed by the American Cancer Society (ACS)[5], mammographic breast density is one of the strongest predictors of breast cancer risk. Attempts to incorporate breast density into predictive models have shown modest improvements in risk prediction estimates[4, 6, 7] and efforts to incorporate density in newer risk models are ongoing[8]. Based on age and BMI distribution of US women, approximately 25 million U.S. women have heterogeneously or extremely dense breasts[9], so the inclusion of breast density is an important risk factor to consider when designing a predictive risk model.
The current gold standard for breast cancer screening is digital mammography. Mammography is a low-dose X-ray procedure that produces high quality images that allow visualization of the internal anatomy of the breast. Digital systems may have higher sensitivity than film based mammography among women under 50 with dense breasts[10, 11] and currently account for approximately 90% of mammographic screens in the US. The ACS suggests that women receive regular and annual screening mammograms beginning at age 40[12]. Screening has been shown to reduce breast cancer mortality[1, 13] and early detection may enable less-aggressive surgeries and treatment options.
However, mammographic screening has come under increased scrutiny recently. Mammography suffers from both false negative and false positive results. High density has been associated with false negative mammographic screens. Screening also tends to favor detection of more indolent tumors that develop slowly and which may not have caused harm leading to “over-diagnosis”[14]. The usefulness of mammographic screening to reduce mortality beyond that of physical self-examination has been called into question, particularly among younger women[15, 16].
For women whose lifetime risk of developing breast cancer is greater than 20%, additional forms of screening are recommended in addition to mammography[17]. Among higher risk women, magnetic resonance imaging (MRI) and ultrasound breast screening are recommended in most states as part of a comprehensive cancer screening program. Since breast density is a strong risk factor for breast cancer, knowledge of breast density can greatly affect the assessment of risk. Therefore, screening methods that can stratify breast density for this higher risk cohort would be very useful in risk assessment[18].
Systematic studies have consistently demonstrated that increased mammographic density is related to increased breast cancer risk[19–21]. Boyd et al have investigated this relationship thoroughly over many years[22–26]. It was determined that, when compared to women with lower densities, women with the highest densities showed an increased risk of breast cancer of 4 to 6-fold. Other studies carried out by Byrne et al[27], Byng et al[28, 29], Wolfe et al[30] and Vachon et al[31] further highlight that irrespective of the modality used to measure mammographic breast density, high density is a strong indicator of breast cancer risk. Furthermore, Boyd et al. and others have demonstrated that high mammographic density is strongly associated with elevated risk of breast cancer detected by screening or presenting clinically between screening exams (i.e., interval cancers)[24].
Molecular Mechanisms that Mediate the Relationship between Breast Density and Breast Cancer Risk
Breast density reflects breast tissue composition and its biophysical properties. Compared with non-dense, adipose-rich tissue, denser tissues contain a higher proportion of fibroglandular elements, including epithelial and stromal cells, connective tissue and intercellular matrix. Dense tissue impedes the passage of X-rays through the breast, resulting in white opaque regions on a mammogram. Dense tissue corresponds to elevated sound speed in ultrasound tomography (UST) and higher water content of fibroglandular tissue in MRI. While measurements obtained using different modalities are correlated, differences between measurements among technologies reflects the underlying physics of the modalities[32].
Proposed explanations for the strong positive relationship between breast density and breast cancer risk include:
Epithelial cell content is greater in denser tissue which might represent a surrogate of cells bearing potentially carcinogenic mutations or stem/progenitor cells with substantial replicative capacity.
Characteristics of the microenvironment of dense tissue are more conducive to carcinogenesis.
Dense tissue serves as a biosensor of systemic factors that increase breast cancer risk.
It is unclear which, if any, of these hypotheses about density and risk are correct. However, the first two possibilities suggest that breast density might represent a causal intermediate in carcinogenesis, and therefore, lowering density could reduce breast cancer risk. Studies that combine novel density measurements with molecular pathology can inform this issue.
Denser breasts are associated with a higher content of epithelial cells and/or stromal cells which could reflect a greater number of cells at risk of malignant transformation[23, 33, 34]. Higher density is also associated with a greater content of terminal duct lobular units, the specific microanatomic structures from which nearly all breast cancers arise[35]. However, epithelial cell numbers may not fully explain density related risk as most data suggest that percentage density is a stronger marker of breast cancer risk than absolute density[21]. Boyd et al suggested that density is most variable in the population at younger ages and converges to a lower more similar value as women age[36]. Given that cellularity and density both decline with age, while breast cancer incidence increases, higher cell numbers alone is likely too simplistic an explanation for the underpinning of density associated risk.
Higher mammographic density is also associated with greater collagen content[33]. Collagen contributes to increased extracellular matrix stiffness[37, 38], which may increase cancer development[39, 40]. Studies in animal models suggest that tumorigenesis is promoted in the presence of increased collagen. More recently, Keely and colleagues have demonstrated that altered collagen fiber alignment in tissues may be associated with breast cancer, and particularly, with more clinically aggressive tumors[39, 40].
Molecular composition of non-dense tissue may also affect associations of density and breast cancer risk. Pettersson and colleagues found an inverse relationship between non-dense breast area and breast cancer risk[41], supporting the hypothesis that fat tissue within the breast may be protective against breast cancer development. The molecular relationship between BMI and mammographic breast density is not fully clear. In a recent study, correlations between fibroglandular volume and mammographic dense area were strongest among women that were categorized as lean[42]. However, the strength of the correlations decreased with increasing BMI[42], suggesting that volumetric and area density measurements do not capture non-dense tissue in a similar manner. Further, data suggest that density is not associated with risk of breast cancer death in analyses adjusted for prognostic pathologic features (i.e. stage, grade, estrogen receptor status); however, a subset analysis has suggested that obese women with low density may be at elevated risk of death[43].
Breast Density Measurements Using Mammography
John Wolfe, at Wayne State University, was the first to propose a relationship between patterns of breast density on a mammogram and breast cancer risk over 35 years ago[30]. Four classifications were used to separate women into groups according to their relative risk of developing breast cancer. In an effort to standardize mammographic reporting, the American College of Radiology developed an alternate visual assessment method known as the Breast Imaging Reporting and Data System (BI-RADS)[44]. The BI-RADS is a density estimation technique that typically involves a radiologist’s visual assessment of the mammogram. It is routinely reported for a large proportion of mammograms in the U.S. according to four categories: a (predominately fat), b (scattered densities), c (heterogeneously dense) and d (extremely dense) (Figure 1). However, due to the subjective nature of these classifications, considerable inter- and intra-rater variability exists[45].
Figure 1.

Examples of the BI-RADS categories for density measurements made on mammography.
The relationship of Wolfe’s classifications and BI-RADS density score to risk have been affirmed, and recognition that parenchymal patterns are markers of risk has stimulated the development of more quantitative and objective methods of breast density assessment. Quantitative methods to measure breast density involve the use of computer-assisted programs that are based on interactive or automatic thresholding and segmentation. Examples of such programs include Cumulus[46], Volpara[47] and Quantra[48]. Mammographic percent density (MPD) is determined by finding the ratio of fibroglandular to total breast tissue areas or volumes. MPD can then be treated as either a continuous or categorical variable in subsequent analysis. An example of the CUMULUS software[46] being used to measure MPD is shown in Figure 2.
Figure 2.

An example of the CUMULUS software measuring mammographic percent density in a mammogram. A user selects the edge threshold (red) that separates the breast tissue from the background and the density threshold (green) that separates dense tissue from non-dense tissue. MPD can be calculated by taking the number of pixels estimated by the density threshold (dense area) and dividing by the number of pixels estimated by the edge threshold (total breast area)[46].
Limitations of Density Measurements Made by Mammography
Despite being the current gold standard for breast imaging, mammography poses the following shortcomings for both cancer detection and breast density measurement:
MPD more closely reflects the attenuation and absorption characteristics of the breast tissues rather than the physical tissue density.
Use of ionizing radiation limits its application for density estimates in younger women, creates caution about performing repeated examinations and may increase breast cancer risk[49].
MPD is derived from two-dimensional (2D) projection of three-dimensional (3D) volume. It requires compression which can alter density measurements[50]. Attempts to provide an accurate volumetric analysis of the density are limited by the variable breast thickness and assessment of regional density is challenging.
MPD does not take into account the variability of how images are processed by different mammography manufacturers.
The measurement does not have an external or absolute scale.
Breast density calculated by the use of mammography is dependent on the variations in breast tissue composition along with X-ray attenuation properties of those tissues and the methods used to generate the images. The image processing that is applied to digital images to maximize contrast helps detect relevant signs of cancers[10], but it can also distort the calculation of density. Digital image processing algorithms ultimately function to spread the image more uniformly among all the possible grey levels, while film mammography tends to render most of the image towards the black or white levels with few pixels occupying the intermediate grey levels. The differences between manufacturers in the production of the X-ray hardware and processed mammographic images means that image quality may vary across institutions.
Breast density measurements using mammography are typically based on the 2D projected area of the breast instead of examining the entire 3D volume. For mammographic density measurements, each pixel is simply assumed to represent either completely dense or completely fatty tissue. In reality, each pixel represents the X-ray absorption and attenuation characteristics of both fibroglandular and fatty tissues combined. It is therefore possible that two women may show similar projected areas of dense tissue yet may have different volumes of dense tissue[50]. Efforts have been made to estimate the volume of dense tissue based on these mammographic measurements. These efforts generally involve the use of algorithms or physics models that use the imaging acquisition parameters to convert the mammographic pixel values into estimates of the thickness of the fibroglandular tissue[51].
Although mammographic density estimation using volumetric methods, such as Quantra or Volpara, produce density measurements that correlate strongly with other measures of breast density[47, 48, 52], improvements in risk prediction when using volumetric as opposed to area density are mixed[25, 53–57]. This appears to be counterintuitive as the entire breast volume should logically contain more information than the projected area. Most of the algorithms require knowledge of the breast thickness and the calculated volumes are sensitive to small changes in the measured value. Small errors in the thickness can lead to inaccurate estimations of volume of dense and non-dense tissue that can reduce the performance in risk prediction, thereby off-setting theoretical advantages.
Alternatives to Mammography
Mammography is currently used in routine clinical practice and is the only screening method that has been shown to reduce mortality from breast cancer[1, 13]. Therefore, it is likely that mammography will remain as the principal method of breast cancer detection. Digital mammography has largely replaced film mammography in the U.S., based on its reported advantage in detecting breast cancer among younger women with dense breasts[10], yet it is not optimal for the measurement of breast density. Beyond mammography, multiple breast imaging modalities have been developed that could be used to assess breast density, each offering specific advantages and limitations. The major alternatives to mammography are MRI[58–64] and UST[32, 65–74]. Additional imaging modalities that can also measure breast density include double X-ray absorption (DXA)[75–77], digital breast tomosynthesis[78, 79], positron emission mammography (PEM)[80, 81], molecular breast imaging[82], breast CT[83, 84] and optical imaging[85, 86]. Summaries of the advantages and limitations of these different imaging modalities are discussed in Table 1.
Table 1.
Benefits and Limitations of Breast Density Measurements Made With Various Imaging Modalities
| Imaging Modality | Benefits | Limitations |
|---|---|---|
| Mammography |
|
|
| Magnetic Resonance Imaging (MRI) |
|
|
| Ultrasound Tomography (UST) |
|
|
| Double X-ray Absorption (DXA) |
|
|
| Breast Tomosynthesis |
|
|
| Positron Emission Mammography (PEM) and Molecular Breast Imaging |
|
|
| Breast Computed Tomography (CT) |
|
|
| Optical Imaging Methods |
|
|
Magnetic Resonance Imaging
Magnetic resonance imaging (MRI) uses non-ionizing radio waves to produce 3D images of tissue structures with very good soft tissue contrast. For women with a greater than 20% lifetime risk of developing breast cancer, MRI is recommended as an additional form of screening[17], and MRI has been used to measure breast density as well. Breast density using MRI involves creating images where dense tissue can be segmented from non-dense tissue. Many different sequences have been used to create images. A commonly used protocol involves T1-weighted MRI scans[61], however correlations between MPD and T2 relaxation time have been measured[58]. Furthermore, sequences known as IDEAL (Iterative Decomposition of water and fat with Echo Asymmetry and Least squares estimation) are believed to directly assess the biochemical features and composition of breast tissue but are still considered a surrogate for the real histological references standard[64]. All of these techniques have shown strong correlations with mammographic density[58–63]. Despite the fact that different sequences have been used to measure breast density on MRI, no definite consensus has been reached about the optimal technical method[59]. In addition, MRI is also associated with false-positive results, has lower specificity compared to mammography and has not yet shown to decrease mortality. Due to the absence of ionizing radiation, MRI may represent a useful screening tool for younger women. However, MRI requires special infrastructure and technical expertise to operate which increases its expense and makes widespread use for density measurement impractical. Current screening sequences also require intravenous contrast injections.
Ultrasound and Ultrasound Tomography
Ultrasound imaging, like MRI, is recommended as an additional form of screening for women with increased risk of developing breast cancer[17]. When using automated breast ultrasound (ABUS) in combination with mammography, cancer detection increases compared with mammography alone[87]. Efforts to measure breast density using ABUS have been attempted[88], but it is still a relatively new area of research. Using ABUS to measure density is a labor-intensive process that suffers from problems with accurate segmentation of the breast.
In 1976, Greenleaf et al observed that acoustic measurements made with transmission ultrasound (US) could characterize breast tissue[89] and that differentiation between benign masses and cancers was possible based on plots of sound speed and attenuation. This result led to the development of US transmission scanners in an attempt to measure the transmission parameters in vivo. UST is one example of this type of ultrasound scanner. UST does not require ionizing radiation or breast compression. UST examinations are not time intensive and costs of ultrasound technology generally compare favorably with other breast imaging modalities. Therefore, UST may be used for risk assessment in conjunction with mammographic screening for breast cancer.
UST uses whole-breast sound speed as an indicator of breast density. In breast tissue, the speed of sound (v) has the following relationship to the elastic constant (c) and material density (ρ):
| Eq. 1 |
Studies have shown that in human tissues, the elastic constant scales proportionally to the cube of density (c ∝ ρ3)[90–92]. Substitution into this equation reveals that in human breast tissue, sound speed is directly proportional to density. Therefore, the average density of the breast can be measured by calculating the volume averaged sound speed (VASS) of the breast. This measurement represents an absolute scale that can easily be replicated between current and future machines without the need for phantom calibrations. Examples of the sound speed images produced by UST are shown in Figure 4.
Figure 4.

Examples of sound speed images created from an Ultrasound Tomgraphy device. Each image represents one slice in a stack of images corresponding to a single breast. Image slices are obtained moving from the chest wall to past the nipple to image the entire volume of the breast. The images are roughly organized according to the BI-RADS mammographic density categories. Top Left is a fatty breast (BI-RADS category a), Top Right is a breast with scattered densities (b), Bottom Left is a heterogeneously dense breast (c) and Bottom Right is a dense breast (d).
Previous work done by Glide et al.[70, 71] was the first to examine the relationship between UST density measurements and mammography density measurements. It was found that sound speed correlated strongly with the known mass densities and CT numbers of the different regions in an anthropomorphic breast phantom. In vivo comparisons of the breast volume averaged sound speed (from UST) to film MPD measurements also gave strong correlations. A volumetric estimation of US percent density (USPD) also showed strong correlations with MPD.
More recent studies carried out by Duric et al.[32] using a larger data set support the results by Glide et al. They showed that the average UST breast density correlates strongly with both film and digital mammographic density measurements. UST density measurements are positively associated with the amount of dense tissue on a mammogram and negatively associated with the amount of non-dense tissue. UST density is higher in premenopausal than in postmenopausal women and shows expected inverse associations with age and weight. Since sound speed is more directly linked to the physical density of the breast tissue than mammography, it has the potential to be a more accurate marker of breast tissue density than mammographic density measures. However, these results do not link UST density measurements with breast cancer risk.
Applications of Breast Density with CAD
Computer-aided detection (CADe) and computer-aided diagnosis (CADx) are techniques that are designed to assist in the interpretation of medical images[93, 94]. CAD systems are designed to improve interpretation of the abundant visual data presented in radiologic images and highlight specific questionable areas for greater scrutiny. CAD techniques have been applied to mammography to aid radiologists in the detection of masses, microcalcifications and architectural distortions. CAD may be viewed as a second reader that assists the radiologist by identifying areas that could have been missed. The impact of breast density on CAD systems has been investigated[95]. Microcalcification sensitivity is independent of mammographic breast density but density decreases mass sensitivity[96]. The false positive rate of mammographic screening is lower in non-dense breasts versus dense breasts. When using CAD, breast cancer detection was not affected by breast density[97]. This suggests that CAD may be advantageous for patients with dense breasts. As mammographic CAD techniques continue to improve, women with dense breasts may see improvements in early detection and decreased masking bias that currently disproportionally affects them. In the future, extension of CADe and/or CADx to UST-based screening in women with dense breasts appears feasible, as well as helping to automate the monitoring of subtle density changes during chemoprevention and treatment monitoring.
Conclusion & Future Perspective
The link between mammographic breast density and breast cancer risk is well documented. However, the link between other measures of breast density, such as UST sound speed measurements, and breast cancer risk has yet to be investigated. Since the other measures of breast density correlate strongly with mammographic density, it is expected that breast cancer risk would also correlate with the non-mammographic density measures. However, this must be formally validated in future studies.
Breast density can also potentially be used as a marker to observe changes in breast tissue in response to preventive and therapeutic strategies. Several studies have shown that approximately one-third to one-half of women receiving tamoxifen experience a decrease in mammographic density within about a year and that these density declines could predict favorable responses in both the treatment and preventive settings[98–100]. Preliminary work using UST density measurements shows that, among some women, changes in density among those treated with tamoxifen are detectable within a few months of initiating treatment. These results show potential to rapidly provide encouragement to responders to adhere to therapy, while re-directing non-responders to alternative treatment options[74]. UST density has also been used to assess response to neoadjuvant chemotherapy[101].
In future studies, integrating imaging characteristics with tissue analysis of cellular composition, biophysical properties of tissues and molecular markers in tissues and blood, may reveal mechanisms that account for density associated risk. Understanding such mechanisms would provide directions for future research aimed at refining risk estimates and developing means to lower density, which could improve radiologic screening, and perhaps, prevent breast cancer.
Breast density is becoming an important topic in the discussion of women’s health. Although breast density is one of the strongest risk factors in determining breast cancer risk, work by Manning et al. [102] shows that women in Detroit, Michigan were generally unaware that increased breast density is associated with increased risk. Furthermore, they found that approximately one third of women in the study knew their own breast density. In an effort to increase awareness of breast density among women undergoing screening, a growing number of states have passed legislation requiring the reporting of breast density to patients[103]. As more states begin mandating the reporting of breast density information to patients, general knowledge of the link between breast density and breast cancer risk will increase. These interests will converge to place greater demands for improved methods of accurately and reproducibly measuring breast density, assessing its role in risk prediction and guiding screening recommendations. Given the potentially substantial cost implications of these concerns, future research on breast density is needed.
Figure 3.
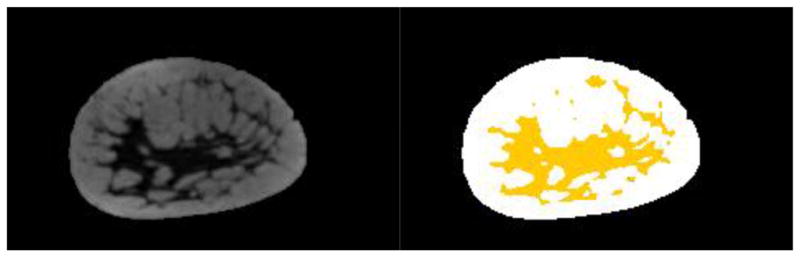
(Left) Example of a pre-contrast T1 weighted coronal MRI image. (Right) The same image with a user defined threshold used to separate dense tissue (yellow) from fatty tissue.
Practice Points.
Breast density is one of the strongest identified breast cancer risk factors; women with the densest breasts are 4 to 6 times more likely to develop breast cancer.
Breast density reflects breast tissue composition and its biophysical properties; studies that combine novel density measurements with molecular pathology can inform the relationship between breast density and breast cancer risk.
The gold standard of breast screening is mammography, but women who present with higher lifetime risk (>20%) are recommended to seek additional screening using MRI or ultrasound.
Breast density is usually evaluated clinically by qualitative visual assessment of mammograms; however, quantitative approaches that predict risk are frequently employed in research and increasingly, in clinical practice.
The limitations of mammography may be addressed by the development of other imaging modalities to improve both breast density measurements and breast cancer detection.
The emerging imaging modality of breast ultrasound tomography shows promise for directly measuring breast tissue density using sound speed imaging, which can be accomplished in three-dimensions without exposure to ionizing radiation.
Acknowledgments
This research was supported in part by the Intramural Research Program of the National Institutes of Health, National Cancer Institute. The authors acknowledge the support of the National Institutes of Health through contract No HHSN261201400038P and grant No R44CA165320 from the National Cancer Institute. Neb Duric and Peter Littrup have financial interests in Delphinus Medical Technologies Inc. whose SoftVue scanner was used in our previous studies involving sound speed measurements of the breast. Financial conflicts of interest are being managed by Wayne State University.
References
- 1.Berry DA, Cronin KA, Plevritis SK, et al. Effect of Screening and Adjuvant Therapy on Mortality from Breast Cancer. New England Journal of Medicine. 2005;353(17):1784–1792. doi: 10.1056/NEJMoa050518. [DOI] [PubMed] [Google Scholar]
- 2.Anderson WF, Katki HA, Rosenberg PS. Incidence of Breast Cancer in the United States: Current and Future Trends. Journal of the National Cancer Institute. 2011;103(18):1397–1402. doi: 10.1093/jnci/djr257. [DOI] [PMC free article] [PubMed] [Google Scholar]
- 3.Gail MH, Brinton LA, Byar DP, et al. Projecting Individualized Probabilities of Developing Breast Cancer for White Females Who Are Being Examined Annually. Journal of the National Cancer Institute. 1989;81(24):1879–1886. doi: 10.1093/jnci/81.24.1879. [DOI] [PubMed] [Google Scholar]
- 4.Cummings SR, Tice JA, Bauer S, et al. Prevention of Breast Cancer in Postmenopausal Women: Approaches to Estimating and Reducing Risk. Journal of the National Cancer Institute. 2009;101(6):384–398. doi: 10.1093/jnci/djp018. [DOI] [PMC free article] [PubMed] [Google Scholar]
- 5.American Cancer Society. Breast cancer facts and figures 2013–2014. Atlanta: American Cancer Society, Inc; 2013. [Google Scholar]
- 6.Tice J, Cummings S, Ziv E, Kerlikowske K. Mammographic Breast Density and the Gail Model for Breast Cancer Risk Prediction in a Screening Population. Breast Cancer Research and Treatment. 2005;94(2):115–122. doi: 10.1007/s10549-005-5152-4. [DOI] [PubMed] [Google Scholar]
- 7.Barlow WE, White E, Ballard-Barbash R, et al. Prospective Breast Cancer Risk Prediction Model for Women Undergoing Screening Mammography. Journal of the National Cancer Institute. 2006 Sep 6;98(17):1204–1214. doi: 10.1093/jnci/djj331. [DOI] [PubMed] [Google Scholar]
- 8.Tice JA, Cummings SR, Smith-Bindman R, Ichikawa L, Barlow WE, Kerlikowske K. Using Clinical Factors and Mammographic Breast Density to Estimate Breast Cancer Risk: Development and Validation of a New Predictive Model. Annals of Internal Medicine. 2008;148(5):337–347. doi: 10.7326/0003-4819-148-5-200803040-00004. [DOI] [PMC free article] [PubMed] [Google Scholar]
- 9.Sprague BL, Gangnon RE, Burt V, et al. Prevalence of Mammographically Dense Breasts in the United States. Journal of the National Cancer Institute. 2014;106(10) doi: 10.1093/jnci/dju255. [DOI] [PMC free article] [PubMed] [Google Scholar]
- 10.Pisano ED, Gatsonis C, Hendrick E, et al. Diagnostic Performance of Digital versus Film Mammography for Breast-Cancer Screening. New England Journal of Medicine. 2005;353(17):1773–1783. doi: 10.1056/NEJMoa052911. [DOI] [PubMed] [Google Scholar]
- 11.Pisano ED, Hendrick RE, Yaffe MJ, et al. Diagnostic Accuracy of Digital versus Film Mammography: Exploratory Analysis of Selected Population Subgroups in DMIST1. Radiology. 2008;246(2):376–383. doi: 10.1148/radiol.2461070200. [DOI] [PMC free article] [PubMed] [Google Scholar]
- 12.American Cancer Society. Cancer facts and figures 2013. Atlanta: American Cancer Society, Inc; 2013. [Google Scholar]
- 13**.Nelson HD, Tyne K, Naik A, Bougatsos C, Chan BK, Humphrey L. Screening for Breast Cancer: An Update for the U.S. Preventive Services Task Force. Annals of Internal Medicine. 2009;151(10):727–737. doi: 10.1059/0003-4819-151-10-200911170-00009. Presents an update of evidence for the U.S. Preventive Services Task Force (USPSTF) recommendation on breast cancer screening for average risk women. [DOI] [PMC free article] [PubMed] [Google Scholar]
- 14.Bleyer A, Welch HG. Effect of Three Decades of Screening Mammography on Breast-Cancer Incidence. New England Journal of Medicine. 2012;367(21):1998–2005. doi: 10.1056/NEJMoa1206809. [DOI] [PubMed] [Google Scholar]
- 15**.Miller AB, Wall C, Baines CJ, Sun P, To T, Narod SA. Twenty five year follow-up for breast cancer incidence and mortality of the Canadian National Breast Screening Study: randomised screening trial. BMJ: British Medical Journal. 2014;348:g366. doi: 10.1136/bmj.g366. 25 year long term follow-up of patients in Canada suggesting that annual mammography does not reduce mortality beyond that of physical examination or usual care. [DOI] [PMC free article] [PubMed] [Google Scholar]
- 16.Pace LE, Keating NL. A systematic assessment of benefits and risks to guide breast cancer screening decisions. JAMA. 2014;311(13):1327–1335. doi: 10.1001/jama.2014.1398. [DOI] [PubMed] [Google Scholar]
- 17.Saslow D, Boetes C, Burke W, et al. American Cancer Society Guidelines for Breast Screening with MRI as an Adjunct to Mammography. CA: A Cancer Journal for Clinicians. 2007;57(2):75–89. doi: 10.3322/canjclin.57.2.75. [DOI] [PubMed] [Google Scholar]
- 18.Schousboe JT, Kerlikowske K, Loh A, Cummings SR. Personalizing Mammography by Breast Density and Other Risk Factors for Breast Cancer: Analysis of Health Benefits and Cost-Effectiveness. Annals of Internal Medicine. 2011;155(1):10–20. doi: 10.7326/0003-4819-155-1-201107050-00003. [DOI] [PMC free article] [PubMed] [Google Scholar]
- 19.Mccormack VA, Dos Santos Silva I. Breast Density and Parenchymal Patterns as Markers of Breast Cancer Risk: A Meta-analysis. Cancer Epidemiology Biomarkers & Prevention. 2006;15(6):1159–1169. doi: 10.1158/1055-9965.EPI-06-0034. [DOI] [PubMed] [Google Scholar]
- 20.Huo CW, Chew GL, Britt KL, et al. Mammographic density—a review on the current understanding of its association with breast cancer. Breast Cancer Research and Treatment. 2014;144(3):479–502. doi: 10.1007/s10549-014-2901-2. [DOI] [PubMed] [Google Scholar]
- 21**.Pettersson A, Graff RE, Ursin G, et al. Mammographic Density Phenotypes and Risk of Breast Cancer: A Meta-analysis. Journal of the National Cancer Institute. 2014 doi: 10.1093/jnci/dju078. Taken together, [19, 20, 21] present a recent literature review highlighting the link between mammographic percentage density and dense area with breast cancer risk. [DOI] [PMC free article] [PubMed] [Google Scholar]
- 22.Boyd NF, Byng JW, Jong RA, et al. Quantitative Classification of Mammographic Densities and Breast Cancer Risk: Results From the Canadian National Breast Screening Study. Journal of the National Cancer Institute. 1995;87(9):670–675. doi: 10.1093/jnci/87.9.670. [DOI] [PubMed] [Google Scholar]
- 23.Boyd NF, Lockwood GA, Byng JW, Tritchler DL, Yaffe MJ. Mammographic densities and breast cancer risk. Cancer Epidemiology Biomarkers & Prevention. 1998;7(12):1133–1144. [PubMed] [Google Scholar]
- 24.Boyd NF, Guo H, Martin LJ, et al. Mammographic Density and the Risk and Detection of Breast Cancer. New England Journal of Medicine. 2007;356(3):227–236. doi: 10.1056/NEJMoa062790. [DOI] [PubMed] [Google Scholar]
- 25.Boyd N, Martin L, Gunasekara A, et al. Mammographic Density and Breast Cancer Risk: Evaluation of a Novel Method of Measuring Breast Tissue Volumes. Cancer Epidemiology Biomarkers & Prevention. 2009;18(6):1754–1762. doi: 10.1158/1055-9965.EPI-09-0107. [DOI] [PubMed] [Google Scholar]
- 26.Boyd NF, Martin LJ, Bronskill M, Yaffe MJ, Duric N, Minkin S. Breast Tissue Composition and Susceptibility to Breast Cancer. Journal of the National Cancer Institute. 2010;102(16):1224–1237. doi: 10.1093/jnci/djq239. [DOI] [PMC free article] [PubMed] [Google Scholar]
- 27.Byrne C, Schairer C, Wolfe J, et al. Mammographic Features and Breast Cancer Risk: Effects With Time, Age, and Menopause Status. Journal of the National Cancer Institute. 1995;87(21):1622–1629. doi: 10.1093/jnci/87.21.1622. [DOI] [PubMed] [Google Scholar]
- 28.Byng JW, Yaffe MJ, Lockwood GA, Little LE, Tritchler DL, Boyd NF. Automated analysis of mammographic densities and breast carcinoma risk. Cancer. 1997;80(1):66–74. doi: 10.1002/(sici)1097-0142(19970701)80:1<66::aid-cncr9>3.0.co;2-d. [DOI] [PubMed] [Google Scholar]
- 29.Byng JW, Yaffe MJ, Jong RA, et al. Analysis of mammographic density and breast cancer risk from digitized mammograms. Radiographics. 1998;18(6):1587–1598. doi: 10.1148/radiographics.18.6.9821201. [DOI] [PubMed] [Google Scholar]
- 30.Wolfe JN. Risk for breast cancer development determined by mammographic parenchymal pattern. Cancer. 1976;37(5):2486–2492. doi: 10.1002/1097-0142(197605)37:5<2486::aid-cncr2820370542>3.0.co;2-8. [DOI] [PubMed] [Google Scholar]
- 31.Vachon CM, Brandt KR, Ghosh K, et al. Mammographic Breast Density as a General Marker of Breast Cancer Risk. Cancer Epidemiology Biomarkers & Prevention. 2007;16(1):43–49. doi: 10.1158/1055-9965.EPI-06-0738. [DOI] [PubMed] [Google Scholar]
- 32**.Duric N, Boyd N, Littrup P, et al. Breast density measurements with ultrasound tomography: A comparison with film and digital mammography. Medical Physics. 2013;40(1):013501–013512. doi: 10.1118/1.4772057. Most recent published data showing correlations between mammographic density measurements and UST sound speed measurements. [DOI] [PMC free article] [PubMed] [Google Scholar]
- 33*.Li T, Sun L, Miller N, et al. The Association of Measured Breast Tissue Characteristics with Mammographic Density and Other Risk Factors for Breast Cancer. Cancer Epidemiology Biomarkers & Prevention. 2005;14(2):343–349. doi: 10.1158/1055-9965.EPI-04-0490. Study linking mammographic breast density with various breast tissue characteristics using breast tissue obtained at forensic autopsy. [DOI] [PubMed] [Google Scholar]
- 34.Sun X, Gierach GL, Sandhu R, et al. Relationship of Mammographic Density and Gene Expression: Analysis of Normal Breast Tissue Surrounding Breast Cancer. Clinical Cancer Research. 2013;19(18):4972–4982. doi: 10.1158/1078-0432.CCR-13-0029. [DOI] [PMC free article] [PubMed] [Google Scholar]
- 35.Ghosh K, Hartmann LC, Reynolds C, et al. Association Between Mammographic Density and Age-Related Lobular Involution of the Breast. Journal of Clinical Oncology. 2010;28(13):2207–2212. doi: 10.1200/JCO.2009.23.4120. [DOI] [PMC free article] [PubMed] [Google Scholar]
- 36.Boyd N, Martin L, Chavez S, et al. Breast-tissue composition and other risk factors for breast cancer in young women: a cross-sectional study. The Lancet Oncology. 2009;10(6):569–580. doi: 10.1016/S1470-2045(09)70078-6. [DOI] [PubMed] [Google Scholar]
- 37.Butcher DT, Alliston T, Weaver VM. A tense situation: forcing tumour progression. Nat Rev Cancer. 2009;9(2):108–122. doi: 10.1038/nrc2544. [DOI] [PMC free article] [PubMed] [Google Scholar]
- 38.Paszek MJ, Zahir N, Johnson KR, et al. Tensional homeostasis and the malignant phenotype. Cancer Cell. 2005;8(3):241–254. doi: 10.1016/j.ccr.2005.08.010. [DOI] [PubMed] [Google Scholar]
- 39.Provenzano P, Inman D, Eliceiri K, et al. Collagen density promotes mammary tumor initiation and progression. BMC Medicine. 2008;6(1):11. doi: 10.1186/1741-7015-6-11. [DOI] [PMC free article] [PubMed] [Google Scholar]
- 40.Conklin MW, Eickhoff JC, Riching KM, et al. Aligned Collagen Is a Prognostic Signature for Survival in Human Breast Carcinoma. The American Journal of Pathology. 2011;178(3):1221–1232. doi: 10.1016/j.ajpath.2010.11.076. [DOI] [PMC free article] [PubMed] [Google Scholar]
- 41.Pettersson A, Hankinson SE, Willett WC, Lagiou P, Trichopoulos D, Tamimi RM. Nondense mammographic area and risk of breast cancer. Breast Cancer Res. 2011;13(5):R100. doi: 10.1186/bcr3041. [DOI] [PMC free article] [PubMed] [Google Scholar]
- 42.Gierach G, Geller B, Shepherd J, et al. Comparison of Mammographic Density Assessed as Volumes and Areas among Women Undergoing Diagnostic Image-Guided Breast Biopsy. Cancer Epidemiology Biomarkers & Prevention. 2014 doi: 10.1158/1055-9965.EPI-14-0257. [Epub ahead of print] [DOI] [PMC free article] [PubMed] [Google Scholar]
- 43.Gierach GL, Ichikawa L, Kerlikowske K, et al. Relationship Between Mammographic Density and Breast Cancer Death in the Breast Cancer Surveillance Consortium. Journal of the National Cancer Institute. 2012;104(16):1218–1227. doi: 10.1093/jnci/djs327. [DOI] [PMC free article] [PubMed] [Google Scholar]
- 44.D’orsi CJ, Sickles EA, Mendelson E, Morris E. ACR BI-RADS® Atlas, Breast Imaging Reporting and Data System. Reston, VA: American College of Radiology; 2013. [Google Scholar]
- 45.Ciatto S, Houssami N, Apruzzese A, et al. Categorizing breast mammographic density: intra- and interobserver reproducibility of BI-RADS density categories. The Breast. 2005;14(4):269–275. doi: 10.1016/j.breast.2004.12.004. [DOI] [PubMed] [Google Scholar]
- 46.Byng JW, Boyd NF, Fishell E, Jong RA, Yaffe MJ. The quantitative analysis of mammographic densities. Physics in Medicine and Biology. 1994;39(10):1629. doi: 10.1088/0031-9155/39/10/008. [DOI] [PubMed] [Google Scholar]
- 47.Jeffreys M, Harvey J, Highnam R. Comparing a New Volumetric Breast Density Method (VolparaTM) to Cumulus. In: Martí J, Oliver A, Freixenet J, Martí R, editors. Digital Mammography. Springer; Berlin Heidelberg: 2010. pp. 408–413. [Google Scholar]
- 48.Ciatto S, Bernardi D, Calabrese M, et al. A first evaluation of breast radiological density assessment by QUANTRA software as compared to visual classification. The Breast. 2012;21(4):503–506. doi: 10.1016/j.breast.2012.01.005. [DOI] [PubMed] [Google Scholar]
- 49.De González AB, Darby S. Risk of cancer from diagnostic X-rays: estimates for the UK and 14 other countries. The Lancet. 2004;363(9406):345–351. doi: 10.1016/S0140-6736(04)15433-0. [DOI] [PubMed] [Google Scholar]
- 50*.Kopans DB. Basic Physics and Doubts about Relationship between Mammographically Determined Tissue Density and Breast Cancer Risk1. Radiology. 2008;246(2):348–353. doi: 10.1148/radiol.2461070309. Presents arguments for cautioned use of 2D mammography for measurement of 3D dense breast volume. [DOI] [PubMed] [Google Scholar]
- 51.Yaffe MJ. Mammographic density. Measurement of mammographic density. Breast Cancer Res. 2008;10(3):209. doi: 10.1186/bcr2102. [DOI] [PMC free article] [PubMed] [Google Scholar]
- 52.Gubern-Mérida A, Kallenberg M, Platel B, Mann RM, Martí R, Karssemeijer N. Volumetric Breast Density Estimation from Full-Field Digital Mammograms: A Validation Study. PLoS ONE. 2014;9(1):e85952. doi: 10.1371/journal.pone.0085952. [DOI] [PMC free article] [PubMed] [Google Scholar]
- 53.Lokate M, Kallenberg MGJ, Karssemeijer N, Van Den Bosch Maa J, Peeters PHM, Van Gils CH. Volumetric Breast Density from Full-Field Digital Mammograms and Its Association with Breast Cancer Risk Factors: A Comparison with a Threshold Method. Cancer Epidemiology Biomarkers & Prevention. 2010;19(12):3096–3105. doi: 10.1158/1055-9965.EPI-10-0703. [DOI] [PubMed] [Google Scholar]
- 54.Aitken Z, Mccormack VA, Highnam RP, et al. Screen-Film Mammographic Density and Breast Cancer Risk: A Comparison of the Volumetric Standard Mammogram Form and the Interactive Threshold Measurement Methods. Cancer Epidemiology Biomarkers & Prevention. 2010;19(2):418–428. doi: 10.1158/1055-9965.EPI-09-1059. [DOI] [PMC free article] [PubMed] [Google Scholar]
- 55.Ding J, Warren R, Warsi I, et al. Evaluating the Effectiveness of Using Standard Mammogram Form to Predict Breast Cancer Risk: Case-Control Study. Cancer Epidemiology Biomarkers & Prevention. 2008;17(5):1074–1081. doi: 10.1158/1055-9965.EPI-07-2634. [DOI] [PubMed] [Google Scholar]
- 56.Shepherd JA, Kerlikowske K, Ma L, et al. Volume of Mammographic Density and Risk of Breast Cancer. Cancer Epidemiology Biomarkers & Prevention. 2011;20(7):1473–1482. doi: 10.1158/1055-9965.EPI-10-1150. [DOI] [PMC free article] [PubMed] [Google Scholar]
- 57.Eng A, Gallant Z, Shepherd J, et al. Digital mammographic density and breast cancer risk: a case-control study of six alternative density assessment methods. Breast Cancer Res. 2014;16(5):439. doi: 10.1186/s13058-014-0439-1. [DOI] [PMC free article] [PubMed] [Google Scholar]
- 58.Graham SJ, Bronskill MJ, Byng JW, Yaffe MJ, Boyd NF. Quantitative correlation of breast tissue parameters using magnetic resonance and X-ray mammography. Br J Cancer. 1996;73(2):162–168. doi: 10.1038/bjc.1996.30. [DOI] [PMC free article] [PubMed] [Google Scholar]
- 59.Tagliafico A, Tagliafico G, Astengo D, Airaldi S, Calabrese M, Houssami N. Comparative estimation of percentage breast tissue density for digital mammography, digital breast tomosynthesis, and magnetic resonance imaging. Breast Cancer Research and Treatment. 2013;138(1):311–317. doi: 10.1007/s10549-013-2419-z. [DOI] [PubMed] [Google Scholar]
- 60.Klifa C, Carballido-Gamio J, Wilmes L, et al. Magnetic resonance imaging for secondary assessment of breast density in a high-risk cohort. Magnetic resonance imaging. 2010;28(1):8–15. doi: 10.1016/j.mri.2009.05.040. [DOI] [PMC free article] [PubMed] [Google Scholar]
- 61*.Lu L-JW, Nishino TK, Johnson RF, et al. Comparison of breast tissue measurements using magnetic resonance imaging, digital mammography and a mathematical algorithm. Physics in medicine and biology. 2012;57(21):6903–6927. doi: 10.1088/0031-9155/57/21/6903. Comparison of breast tissue measurements using MRI and mammography along with a brief literature review of other methods reporting breast tissue composition using breast MRI. [DOI] [PMC free article] [PubMed] [Google Scholar]
- 62.Tagliafico A, Bignotti B, Tagliafico G, et al. Breast Density Assessment Using a 3T MRI System: Comparison among Different Sequences. PLoS ONE. 2014;9(6):e99027. doi: 10.1371/journal.pone.0099027. [DOI] [PMC free article] [PubMed] [Google Scholar]
- 63.Khazen M, Warren RML, Boggis CRM, et al. A Pilot Study of Compositional Analysis of the Breast and Estimation of Breast Mammographic Density Using Three-Dimensional T1-Weighted Magnetic Resonance Imaging. Cancer Epidemiology Biomarkers & Prevention. 2008;17(9):2268–2274. doi: 10.1158/1055-9965.EPI-07-2547. [DOI] [PMC free article] [PubMed] [Google Scholar]
- 64.Reeder SB, Mckenzie CA, Pineda AR, et al. Water–fat separation with IDEAL gradient-echo imaging. Journal of Magnetic Resonance Imaging. 2007;25(3):644–652. doi: 10.1002/jmri.20831. [DOI] [PubMed] [Google Scholar]
- 65.Duric N, Littrup P, Babkin A, et al. Development of ultrasound tomography for breast imaging: Technical assessment. Medical Physics. 2005;32(5):1375–1386. doi: 10.1118/1.1897463. [DOI] [PubMed] [Google Scholar]
- 66.Duric N, Littrup P, Poulo L, et al. Detection of breast cancer with ultrasound tomography: First results with the Computed Ultrasound Risk Evaluation (CURE) prototype. Medical Physics. 2007;34(2):773–785. doi: 10.1118/1.2432161. [DOI] [PubMed] [Google Scholar]
- 67.Duric N, Littrup P, Li C, et al. Detection and characterization of breast masses with ultrasound tomography: clinical results. In. Medical Imaging 2009: Ultrasonic Imaging and Signal Processing. 2009 [Google Scholar]
- 68.Duric N, Littrup P, Chandiwala-Mody P, et al. In-vivo imaging results with ultrasound tomography: report on an ongoing study at the Karmanos Cancer Institute. In. Medical Imaging 2010: Ultrasonic Imaging, Tomography, and Therapy. 2010 [Google Scholar]
- 69.Duric N, Littrup P, Schmidt S, et al. Breast Imaging with the SoftVue Imaging system: First results. Medical Imaging 2013: Ultrasonic Imaging, Tomography, and Therapy. 2013 doi: 10.1117/12.2002513. [DOI] [PMC free article] [PubMed] [Google Scholar]
- 70.Glide C, Duric N, Littrup P. Novel approach to evaluating breast density utilizing ultrasound tomography. Medical Physics. 2007;34(2):744–753. doi: 10.1118/1.2428408. [DOI] [PubMed] [Google Scholar]
- 71.Glide-Hurst CK, Duric N, Littrup P. Volumetric breast density evaluation from ultrasound tomography images. Medical Physics. 2008;35(9):3988–3997. doi: 10.1118/1.2964092. [DOI] [PubMed] [Google Scholar]
- 72.Li C, Duric N, Littrup P, Huang L. In vivo Breast Sound-Speed Imaging with Ultrasound Tomography. Ultrasound in Medicine & Biology. 2009;35(10):1615–1628. doi: 10.1016/j.ultrasmedbio.2009.05.011. [DOI] [PMC free article] [PubMed] [Google Scholar]
- 73.Sak M, Duric N, Boyd NF, et al. Relationship between breast sound speed and mammographic percent density. Medical Imaging 2011: Ultrasonic Imaging, Tomography, and Therapy. 2011
- 74.Sak M, Duric N, Littrup P, et al. Breast density measurements using ultrasound tomography for patients undergoing tamoxifen treatment. In. Medical Imaging 2013: Ultrasonic Imaging, Tomography, and Therapy. 2013 doi: 10.1117/12.2007146. [DOI] [PMC free article] [PubMed] [Google Scholar]
- 75.Laidevant AD, Malkov S, Flowers CI, Kerlikowske K, Shepherd JA. Compositional breast imaging using a dual-energy mammography protocol. Med Phys. 2010;37(1):164–174. doi: 10.1118/1.3259715. [DOI] [PMC free article] [PubMed] [Google Scholar]
- 76.Shepherd JA, Malkov S, Fan B, Laidevant A, Novotny R, Maskarinec G. Breast Density Assessment in Adolescent Girls Using Dual-Energy X-ray Absorptiometry: A Feasibility Study. Cancer Epidemiology Biomarkers & Prevention. 2008;17(7):1709–1713. doi: 10.1158/1055-9965.EPI-08-0006. [DOI] [PMC free article] [PubMed] [Google Scholar]
- 77.Maskarinec G, Morimoto Y, Daida Y, et al. Comparison of breast density measured by dual energy X-ray absorptiometry with mammographic density among adult women in Hawaii. Cancer Epidemiology. 2011;35(2):188–193. doi: 10.1016/j.canep.2010.06.009. [DOI] [PMC free article] [PubMed] [Google Scholar]
- 78.Bakic PR, Carton A-K, Kontos D, Zhang C, Troxel AB, Maidment ADA. Breast Percent Density: Estimation on Digital Mammograms and Central Tomosynthesis Projections. Radiology. 2009;252(1):40–49. doi: 10.1148/radiol.2521081621. [DOI] [PMC free article] [PubMed] [Google Scholar]
- 79.Regini E, Mariscotti G, Durando M, et al. Radiological assessment of breast density by visual classification (BI–RADS) compared to automated volumetric digital software (Quantra): implications for clinical practice. Radiol med. 2014:1–9. doi: 10.1007/s11547-014-0390-3. [DOI] [PubMed] [Google Scholar]
- 80.Vranjesevic D, Schiepers C, Silverman DH, et al. Relationship Between 18F-FDG Uptake and Breast Density in Women with Normal Breast Tissue. Journal of Nuclear Medicine. 2003;44(8):1238–1242. [PubMed] [Google Scholar]
- 81.Berg WA, Weinberg IN, Narayanan D, et al. High-Resolution Fluorodeoxyglucose Positron Emission Tomography with Compression (“Positron Emission Mammography”) is Highly Accurate in Depicting Primary Breast Cancer. The Breast Journal. 2006;12(4):309–323. doi: 10.1111/j.1075-122X.2006.00269.x. [DOI] [PubMed] [Google Scholar]
- 82.Hruska CB, Rhodes DJ, Conners AL, et al. Background Parenchymal Uptake During Molecular Breast Imaging and Associated Clinical Factors. American Journal of Roentgenology. 2015;204(3):W363–W370. doi: 10.2214/AJR.14.12979. [DOI] [PMC free article] [PubMed] [Google Scholar]
- 83.Lindfors KK, Boone JM, Nelson TR, Yang K, Kwan ALC, Miller DF. Dedicated Breast CT: Initial Clinical Experience. Radiology. 2008;246(3):725–733. doi: 10.1148/radiol.2463070410. [DOI] [PMC free article] [PubMed] [Google Scholar]
- 84.Moon W, Lo C-M, Goo J, et al. Quantitative Analysis for Breast Density Estimation in Low Dose Chest CT Scans. J Med Syst. 2014;38(3):1–9. doi: 10.1007/s10916-014-0021-5. [DOI] [PubMed] [Google Scholar]
- 85.Taroni P, Pifferi A, Quarto G, et al. Noninvasive assessment of breast cancer risk using time-resolved diffuse optical spectroscopy. BIOMEDO. 2010;15(6):060501-060501–060503. doi: 10.1117/1.3506043. [DOI] [PubMed] [Google Scholar]
- 86.O’sullivan TD, Leproux A, Chen JH, et al. Optical imaging correlates with magnetic resonance imaging breast density and reveals composition changes during neoadjuvant chemotherapy. Breast Cancer Res. 2013;15(1):R14. doi: 10.1186/bcr3389. [DOI] [PMC free article] [PubMed] [Google Scholar]
- 87.Kelly K, Dean J, Comulada W, Lee S-J. Breast cancer detection using automated whole breast ultrasound and mammography in radiographically dense breasts. European Radiology. 2010;20(3):734–742. doi: 10.1007/s00330-009-1588-y. [DOI] [PMC free article] [PubMed] [Google Scholar]
- 88.Moon WK, Shen Y-W, Huang C-S, et al. Comparative study of density analysis using automated whole breast ultrasound and MRI. Medical Physics. 2011;38(1):382–389. doi: 10.1118/1.3523617. [DOI] [PMC free article] [PubMed] [Google Scholar]
- 89.Greenleaf JF, Johnson SA, Bahn RC. Quantitative Cross-Sectional Imaging of Ultrasound Parameters. Ultrasonics Symposium. 1977 [Google Scholar]
- 90.Masugata H, Mizushige K, Senda S, et al. Relationship between myocardial tissue density measured by microgravimetry and sound speed measured by acoustic microscopy. Ultrasound in Medicine & Biology. 1999;25(9):1459–1463. doi: 10.1016/s0301-5629(99)00091-5. [DOI] [PubMed] [Google Scholar]
- 91.Mast TD. Empirical relationships between acoustic parameters in human soft tissues. Acoustics Research Letters Online. 2000;1(2):37–42. [Google Scholar]
- 92.Weiwad W, Heinig A, Goetz L, et al. Direct Measurement of Sound Velocity in Various Specimens of Breast Tissue. Investigative Radiology. 2000;35(12):721–726. doi: 10.1097/00004424-200012000-00005. [DOI] [PubMed] [Google Scholar]
- 93.Astley SM, Gilbert FJ. Computer-aided detection in mammography. Clinical Radiology. 2004;59(5):390–399. doi: 10.1016/j.crad.2003.11.017. [DOI] [PubMed] [Google Scholar]
- 94.Giger ML, Karssemeijer N, Schnabel JA. Breast Image Analysis for Risk Assessment, Detection, Diagnosis, and Treatment of Cancer. Annual Review of Biomedical Engineering. 2013;15(1):327–357. doi: 10.1146/annurev-bioeng-071812-152416. [DOI] [PubMed] [Google Scholar]
- 95.Bazzocchi M, Mazzarella F, Del Frate C, Girometti F, Zuiani C. CAD systems for mammography: a real opportunity? A review of the literature. Radiol med. 2007;112(3):329–353. doi: 10.1007/s11547-007-0145-5. [DOI] [PubMed] [Google Scholar]
- 96.Malich A, Fischer D, Facius M, et al. Effect of Breast Density on Computer Aided Detection. J Digit Imaging. 2005;18(3):227–233. doi: 10.1007/s10278-004-1047-x. [DOI] [PMC free article] [PubMed] [Google Scholar]
- 97.Brem RF, Hoffmeister JW, Rapelyea JA, et al. Impact of Breast Density on Computer-Aided Detection for Breast Cancer. American Journal of Roentgenology. 2005;184(2):439–444. doi: 10.2214/ajr.184.2.01840439. [DOI] [PubMed] [Google Scholar]
- 98.Cuzick J, Warwick J, Pinney E, Warren RML, Duffy SW. Tamoxifen and Breast Density in Women at Increased Risk of Breast Cancer. Journal of the National Cancer Institute. 2004;96(8):621–628. doi: 10.1093/jnci/djh106. [DOI] [PubMed] [Google Scholar]
- 99.Cuzick J, Warwick J, Pinney E, et al. Tamoxifen-Induced Reduction in Mammographic Density and Breast Cancer Risk Reduction: A Nested Case-Control Study. Journal of the National Cancer Institute. 2011;103(9):744–752. doi: 10.1093/jnci/djr079. [DOI] [PubMed] [Google Scholar]
- 100.Nyante SJ, Sherman ME, Pfeiffer RM, et al. Prognostic Significance of Mammographic Density Change After Initiation of Tamoxifen for ER-Positive Breast Cancer. Journal of the National Cancer Institute. 2015;107(3):dju425. doi: 10.1093/jnci/dju425. [DOI] [PMC free article] [PubMed] [Google Scholar]
- 101.Lupinacci J, Duric N, Littrup P, et al. Monitoring breast masses with ultrasound tomography in patients undergoing neoadjuvant chemotherapy. Medical Imaging 2009: Ultrasonic Imaging and Signal Processing. 2009 [Google Scholar]
- 102.Manning M, Duric N, Littrup P, Bey-Knight L, Penner L, Albrecht T. Knowledge of Breast Density and Awareness of Related Breast Cancer Risk. J Canc Educ. 2013;28(2):270–274. doi: 10.1007/s13187-013-0457-1. [DOI] [PMC free article] [PubMed] [Google Scholar]
- 103.Slanetz PJ, Freer PE, Birdwell RL. Breast-Density Legislation — Practical Considerations. New England Journal of Medicine. 2015;372(7):593–595. doi: 10.1056/NEJMp1413728. [DOI] [PubMed] [Google Scholar]