

Abstract
Fatty acid desaturase 3 (FADS3) is the third member of the FADS gene cluster. FADS1 and FADS2 code for enzymes required for highly unsaturated fatty acid (HUFA) biosynthesis, but FADS3 function remains elusive. We generated the first Fads3 knockout (KO) mouse with an aim to characterize its metabolic phenotype and clues to in vivo function. All mice (wild type (WT) and KO) were fed facility rodent chow devoid of HUFA. No differences in overt phenotypes (survival, fertility, growth rate) were observed. Docosahexaenoic acid (DHA, 22:6n-3) levels in the brain of postnatal day 1 (P1) KO mice were lower than the WT (P<0.05). The ratio of 22:5n-3 (DPA) to DHA in P1 KO liver was higher than in WT suggesting lower desaturase activity. Similarly, 20:4n-6 was lower but its elongation product 22:4n-6 was greater in the liver of P1 KO mice. P1 KO liver Fads1 and Fads2 mRNA levels are significantly downregulated whereas expression levels of elongation of very long chain gene 2 (Elovl2) and Elovl5 are upregulated compared to age-matched WT. No Δ13-desaturation of vaccenic acid was observed in liver or heart in WT mice expressing FADS3 as was reported in vitro. Taken together, the fatty acid compositional results suggest that Fads3 enhances liver-mediated 22:6n-3 synthesis to support brain 22:6n-3 accretion before and during the brain growth spurt.
Keywords: Fatty acid desaturase 3, Unsaturated fatty acid biosynthesis, Docosahexaenoic acid, Brain growth, Elongation
1. Introduction
Highly unsaturated fatty acids (HUFA), especially docosahexaenoic acid (DHA, 22:6n-3) and arachidonic acid (AA, 20:4n-6) are metabolically required for growth, early neural and visual development [1–3]. The perinatal brain growth spurt imposes the highest relative demand for DHA and AA for structural lipid. Rodents are altricial mammals born with immature brains that undergo the brain growth spurt in early postnatal life [4]. The human brain growth spurt is perinatal, starting at about 27 weeks and continuing past 2 years of age. Brain growth and brain size are correlated with neurogenesis [5] during which time HUFA rapidly accumulate [6].
The availability of HUFA in mammals depends on dietary intake and endogenous synthesis. In an alternating process of desaturation and elongation, HUFA can be biosynthesized from dietary PUFA precursors, linoleic acid (LA, 18:2n-6) and α-linolenic acid (ALA, 18:3n-3). Fatty acid desaturase 1 (Fads1) and fatty acid desaturase 2 (Fads2) code for key multifunctional enzymes in HUFA biosynthesis, introducing cis double bonds at specific position in the carbon chain [7, 8]. Fads1 codes for a Δ5 desaturase using 20:2n-6, 20:3n-6, 20:3n-3 and 20:4n-3 as substrates. The Fads2 protein product catalyzes trifunctional even-numbered Δ6, Δ8 and Δ4 desaturase activities by acting on at least eleven substrates. Fads2 Δ6-desaturase activity catalyzes the conversion of 6 competing substrates (18:2n-6 → 18:3n-6; 18:3n-3 → 18:4n-3; 24:5n-3 → 24:6n-3; 24:4n-6 → 24:5n-6; 16:0 →16:1n-10, and 18:1n-9 →18:2n-9), Δ8-desaturase activity acting on 20:1n-9 → 20:2n-9, 20:2n-6 → 20:3n-6, and 20:3n-3 → 20:4n-3, and Δ4-desaturase activity acting on 22:4n-6 → 22:5n-6 and 22:5n-3 → 22:6n-3 [9–11].
The fatty acid desaturase 3 (Fads3) [12] is the third known member of Fads gene cluster, along with Fads1 and Fads2 arose evolutionarily by a gene duplication event and localizes to mouse chromosome 19 [8]. Human FADS homologs with similar structural organization are localized to human chromosome 11q13, a cancer hotspot locus [12, 13]. In human, FADS3 spans 17.9 kb genomic DNA, located 6.0 kb 3′ from FADS2, and has the same gene structure as FADS1 and FADS2 consisting of 12 exons and 11 introns. The amino acid sequences of FADS3 are 52% and 62% homologous to FADS1 and FADS2, respectively. The putative protein coded by FADS3 is composed of an N-terminal cytochrome b5-like domain and three histidine motifs at the C-terminal ends, characteristic of all membrane-bound front end desaturases. FADS3 is transcribed and extensively spliced [14] and the splice variants yield alternative transcripts (ATs) which are phylogenetically conserved in at least several mammalian and avian species [15]. Proteins have been detected that may correspond to ATs [16]. We have shown recently using mouse embryonic fibroblast (MEF) cells and ribosome foot-printing technology the first positive-sequence-specific-proof of Fads3 translation [17]. Despite these observations, there are no reports of Fads3 mediated front-end desaturation.
Existing data suggest that FADS3 has functional significance. Gene expression studies show that Fads3 mRNA changes when Fads1 and Fads2 changes, though not in the same direction. For instance, Fads3 expression increased 3-fold in Fads2 knock-out (KO) mice compared to wild type (WT) [18], and when DHA and ARA were included in the diet of neonate baboons, Fads1 and Fads2 expression went down while Fads3 ATs increased [19]. An earlier study showed that the expression of Fads3 was higher in mouse uterus at the implantation site [20]. A recent in vitro study showed Fads3 specificity for trans-vaccenic acid [VA; trans11-18:1], catalyzing putative synthesis of trans11,cis13-CLA isomer (Δ13 desaturation) in the first reported case of a mammalian back-end desaturase [21]. These data, to our knowledge, have not been replicated in vivo. A genome-wide association study (GWAS) showed genetic variants within FADS3 are associated with familial combined hyperlipidemia among Mexican population [22] and a 2011 AVON longitudinal study [23] found minor allele of FADS3 SNP (rs174455) to be negatively associated with DHA in red blood cell (RBC) phospholipids.
Here we present generation of first Fads3 KO mouse colony, with an aim to characterize its metabolic phenotype and to find clues to in vivo function. We focused on the early life because it is the period of rapid brain growth spurt and where intense demand for brain accretion of the most physiologically important HUFA is at least in part mediated by liver.
2. Materials and Methods
2.1. Generation of the Fads3 KO mouse
Fads3 KO mice were generated using a gene targeting technique [24]. The embryonic cell (ES, derived from JM8A1.N3) clone was purchased from KOMP Repository (ID 49707, Davis, CA). The target vector (Fig. 1A) contained a splicing acceptor (SA) followed by positive selection marker lacZ and neomycin resistance gene (neo). After the target vector was transfected with ES, 7.1 kb nucleotide sequence of Fads3 located between exon 1 and exon 2 was replaced by the vector construct via homologous recombination. Long range PCR at the 5′ end of the vector was used to test the accurate integration of vector gene at the targeting location. Copy number of vector inserted in transfected ES was determined by Taqman PCR at Murine Genetics Analysis Lab at University of California, Davis, CA.
Figure 1. Structure of target vector and genotyping strategy.

(A) The target vector contained a splicing acceptor (SA) followed by positive selection marker lacZ and neomycin resistance gene (neo). Nucleotides of Fads3 located between exon 1 and exon 2 were replaced by the vector construct via homologous recombination. (B) Amplicons generated from primer set 1 and primer set 2. No visible product from primer 1 but visible product from primer 2 indicates that no vector exists in the mouse, indicating the mouse was wild type (WT). Mouse with visible band from primer 2 but no visible band from primer 1 was knockout mouse (KO). Heterozygotes (Het) had PCR products from both primers.
ES carrying a single copy of the vector at the targeting location was microinjected into C57BL/6 blastocytes and then implanted into a pseudo pregnant recipient to produce chimeras. One male chimera was generated at the Cornell University College of Veterinary Medicine transgenic mouse facility. The male chimera was crossed with a wild type C57BL/6 female and the litter was screened by genotyping at the age of 12 to 14 days. For genotyping, DNA (from ear pouch or tail snip) was extracted using a DNeasy blood & tissue kit (Qiagen, CA) and two primer sets were designed (Fig. 1A) to select Fads3 KO progeny. Primer pairs used for genotyping and gene expression studies are presented in supplemental Table 1.
Breeding of screened heterozygous (Het) female and male generated WT, Het, KO progeny (Fig. 1B). WT and KO pups were used for future breeding. Litters from WT × WT were regarded as the control group and litters from KO × KO were used as experimental group for this study.
2.2. Animals
All the mice were fed ad libitum laboratory rodent chow (7012 Teklad LM-485, Harlan Laboratories, WI) containing 2.6%wt linoleic acid (7.6%energy) and 0.3%wt α-linolenic acid (0.9%energy) from soy oil. They were housed in a controlled environment at a 12-hour light/12-hour dark cycle. Body weights were measured three times per week. Oxymax Lab Animal Monitoring System (Columbus Instruments, OH) was used to test physical activities, specifically respiratory exchange ratio, horizontal activity (count/day), vertical activity (count/day), food intake (g/day), and water intake (ml/day). Pups (n=14/genotype/age, female: male= 1:1) on postnatal day 1, 3, 7, 13, 21, and 30 were sacrificed by CO2 inhalation and brain and liver tissues were collected for fatty acid analysis and gene expression studies. Tissues were kept in RNAlater stabilization solution (AM7020, Life Technologies, CA) at 4°C overnight and the next day stored at −80°C until use. Animal studies were approved by the Cornell University Institutional Animal Care and Use Committee (IACUC protocol #2011-0007).
2.3. Fatty acid analysis
Fatty acid methyl esters (FAME) were prepared from mouse brain and liver samples by using a modified one-step method for specific tissues [25]. Methylated fatty acids were structurally identified by covalent adduct chemical ionization tandem mass spectrometry (CACI-MS/MS, Varian Saturn 2000 Ion Trap, Agilent Technologies, Santa Clara, CA) and were quantified by gas chromatography coupled to a flame ionization detection (GC-FID, Hewlett Packard 5890 Series II, Agilent Technologies, Santa Clara, CA) using an equal weight FAME standard mixture to verify response factors in each run with sample FAME. Triplicate injections were performed for each FAME and quantity of each fatty acid species was calculated as percentage by weight in total fatty acids (%, w/w).
2.4. RNA extraction and preparation of cDNA
Total RNA was extracted from mouse brain and liver tissues using RNeasy Mini Kit (Qiagen, Valencia, CA). The quality and quantity of RNA was determined by using a Nanodrop 2000 (Thermo Scientific, Waltham, MA) and one microgram of total RNA was used to prepare cDNA using the High Capacity cDNA Reverse Transcription Kit (Life Technologies, NY) according to the manufacturer’s instruction. The synthesized cDNA was stored at −20°C for future studies.
2.5. Real-time PCR
Gene expression ontogeny of classical Fads1 and Fads2 transcripts were measured by real-time PCR using SYBR Green Master Mix on a LightCycler 480 instrument (Roche, Madison, WI). Mouse Gapdh and β-actin were chosen as reference genes. The real-time PCR protocol was as follows: initial denaturation: 95°C for 10 min; amplification: 45 cycles of denaturation at 95°C for 10 s, amplification at 65°C for 20 s, extension at 72°C for 10 s; final extension: 72°C for 5 min. Melting curve and calculated primer efficiency from standard curves were used to verify the specificity of each primer pair. Based on the standard curve we selected 1:100 dilution of cDNA for testing Fads1 and Fads2 gene expression and each reaction was run in triplicate. Relative quantification was calculated based on the normalization of sample targeting gene quantitative cycle (Cq) values to those of geometric mean of sample reference genes using 2−ΔΔCq method [26]. In each time point, mRNA expression of KO mice was normalized to WT (considering the Fads1 and Fads2 expression in WT as “1”).
2.6. Reverse transcription-PCR (RT-PCR)
cDNA generated from mice brain and liver tissues on postnatal day 1, 7, and 30 were used to measure mRNA expression levels of nine genes related to lipid metabolism using semi-quantitative RT-PCR. Amplicons generated from Elovl2 (elongation of long chain fatty acids 2), Elovl5, Fasn (fatty acid synthase), Scd1 (stearoyl-CoA desaturase 1), Srebp-1c (sterol regulatory element-binding protein 1c), Ppara (peroxisome proliferator-activated receptor alpha), Ppard, Pparg, Acaca (acetyl-Coenzyme A carboxylase alpha) were run on 2% agarose gels stained with ethidium bromide and visualized under UV. The intensities of amplified products were quantified densitometrically by ImageJ software (National Institutes of Health, USA) and the expression levels of Elovl2, Elovl5, Fasn, Scd, Srebp-1c and Acaca transcript were normalized to expression level of 18S control gene.
2.7. Investigation of Δ13 desaturase product
Both WT and Fads3 KO male mice aged around 15 months (n=3/genotype) were provided with 5 mg of vaccenic acid (trans11-18:1, Sigma-Aldrich, MO) mixed with chow diet per day for one month. WT and KO mice were selected based on genotyping. Livers and hearts were collected and fatty acids were analyzed. Fatty acids were positively identified with no need for chemical standards by covalent adduct chemical ionization tandem mass spectrometry (CACI-MS/MS) [27].
2.8. Statistical Analysis
Data was analyzed using SPSS 16.0 (IBM, Armonk, NY) software. All data in figures are presented as mean ± 95% confidence interval. All data in tables are presented as mean ± standard deviation (SD). Student’s t-test was used to compare the difference between WT and KO. P<0.05 was set as statistical significance threshold.
3. Results
3.1. Fads3 KO mice showed no overt phenotype
The litter size was 6 ± 2.5 and 6 ± 2.2 (n=26) in WT and KO, respectively and no significant difference was observed. The growth rate (Figure 2A, 2B) of KO mice was similar to WT mice. Food intake, physical activity and metabolic rate measured by Oxymax Lab Animal Monitoring System were not different between two genotypes (data not shown). The physical appearance of Fads3 KO mice was indistinguishable from WT mice.
Figure 2. Mice growth curve and brain mass growth.

(A) Female mice body weight. No differences in body weight between genotypes were observed. (B) Male mice body weight. No differences in body weight between genotypes were observed. (C) Brain growth curve. Mice brain mass was used to determine gross brain growth. From birth to P13 the rate of postnatal brain growth was higher (regarded as “spurt”) than later age point. No differences were observed between genotypes.
3.2. P1 Fads3 KO brain had lower DHA and AA but higher LA
The postnatal brain growth spurt was observed from birth to postnatal day 13 (P13), followed by slower growth thereafter (Figure 2C), with continued DHA accretion past P30. Fads3 KO mice had significantly lower brain DHA at P1 and P7 compared to those of WT, though the intermediate P3 was not different (Figure 3A). From P13 to P30 no differences in brain DHA were found. On P1, the precursor of n-6 HUFA, LA, was 0.96 ±0.13% and 0.74 ± 0.18% of total fatty acids in KO brain and WT brain, respectively (P<0.05, Figure 3B). From P3 to P21, LA was non-significantly greater in KO brains and by P30 was 0.97 ± 0.10% vs. 0.85 ± 0.09% of total fatty acids in KO and WT, respectively (Figure 3B). Interestingly, even though the n-6 precursor LA was higher in KO brain, its downstream product AA was lower (Figure 3C) compared to WT mice on P1. The complete brain fatty acid profiles are presented in supplemental table 2.
Figure 3. Brain PUFA ontogeny.

(A) Brain DHA (22:6n-3) content. KO had significantly lower amount of brain DHA at P1 and P7 but caught up from P13. (B) Brain LA (18:2n-6) content. KO had significantly higher LA, the precursor of n-6 PUFA at P1 and P30 than WT. (C) Brain AA (20:4n-6) content. Brain AA in KO was significantly lower than WT at P1 but no differences at other ages. Values are Mean ± 95% CI (n=14) and * P<0.05.
3.3. Fads3 KO liver had higher DPA during the Brain Growth Spurt (BGS)
The precursor of n-3 HUFA, ALA, was significantly higher in KO liver than WT on P1 and P3, similar trends though not statistically significant were found from P7 to P30 (Figure 4A). In P1 to P13, hepatic docosapentaenoic acid (DPAn-3, 22:5n-3) levels in KO mice were found to be greater than WT, most importantly, DPA levels were 2.4 fold higher in P1 KO. However, by P30 DPAn-3 levels dropped significantly in KO (Figure 4B). In contrast, hepatic DHA showed no consistent pattern of differences. P3 KO mice had higher hepatic DHA (7.16 ± 1.11% vs 6.03 ± 1.62%, KO vs WT) while P21 and P30 KO mice had lower hepatic DHA compared to WT (Figure 4C). The proportion of DHA to DPA, calculated as DHA/(DPA+DHA) at P1, was 88% and 95% in KO and WT mice, respectively and was lower at P3 (n.s.), P7, P13, and P21. By P30 KO had risen and WT fallen, and the KO DHA proportion was significantly greater (Figure 5A). Similarly, the proportion of DPA to DHA, calculated as DPA/(DHA+DPA), was significantly higher in KO P1 pups.
Figure 4. Liver PUFA ontogeny.

(A) Liver ALA (18:3n-3) content. Hepatic ALA was higher at all time points but reached significance only at P1 and P3. (B) Liver DPA (22:5n-3) content. Hepatic DPA was higher from P1 to P21 (P21 not significant) but significantly lower at P30 in KO compared to WT. (C) Liver DHA (22:6n-3) content. KO liver had significantly lower amount of DHA than WT at P21 and P30. (D) Liver LA (18:2n-6) content. Hepatic LA in KO was significantly higher from P1 to P13 in contrast to WT. (E) Liver AA (20:4n-6) content. KO liver AA was significantly decreased at P1 but no differences were observed from P3 to P21, at P30 AA was significantly higher in KO. Values are Mean ± 95% CI (n=14) and * P<0.05.
Figure 5. Liver Ontogeny of relative DPA to DHA.

(A) The hepatic precursor-product levels for 22:5n-3→22:6n-3 was lower during the BGS (P1, 7, 13 and 21 (p<0.05); P3 (n.s.)) in KO compared to WT. After weaning, the proportion was significantly increased in KO in contrast to WT (P30). (B) The hepatic precursor-product levels for 20:5n-3→22:5n-3 was greater in KO at P1 and P21 but lower at P30 compared to WT.
Similar to brain LA, KO mice hepatic LA was found to be higher from P1 to P13, through the BGS (Figure 4D). Hepatic 20:4n-6 in P1 KO was significantly lower compared to WT, similar observations were seen in brain (Figure 4E). Interestingly, adrenic acid (ADA, 22:4n-6), the elongated product of 20:4n-6 was significantly higher than WT (Figure 4F), indicating elevated elongation activity in KO at P1. No changes in AA levels were observed from P3 to P21, however, at P30 AA was significantly higher in KO than WT. The complete liver fatty acid profiles are presented in supplemental table 3.
3.4. Brain and hepatic expression levels of Fads2 and Fads1 increased at weaning in KO
KO Brain Fads2 expression levels are significantly higher on P1 and P21, whereas, they are significantly lower on P13 and P30 compared to WT (Figure 6A). Brain Fads1 expression was not different between genotypes from P1–P13 and P30, the only significant increase was observed on P21, the day of weaning (Figure 6B). Interestingly on P21, both Fads2 and Fads1 expression in KO mice brains are found to be upregulated by 1.3 and 1.7 fold relative to WT, respectively (Figure 6A, 6B). As shown in Figure 6C and 6D, hepatic Fads2 and Fads1 expression levels are significantly downregulated on P1, P7 and P30 KO compared to WT. In contrast, on P21 hepatic Fads2 expression was elevated by 1.4 fold in KO relative to WT.
Figure 6. Brain and Liver Ontogeny of Fads2 and Fads1 gene expression levels.
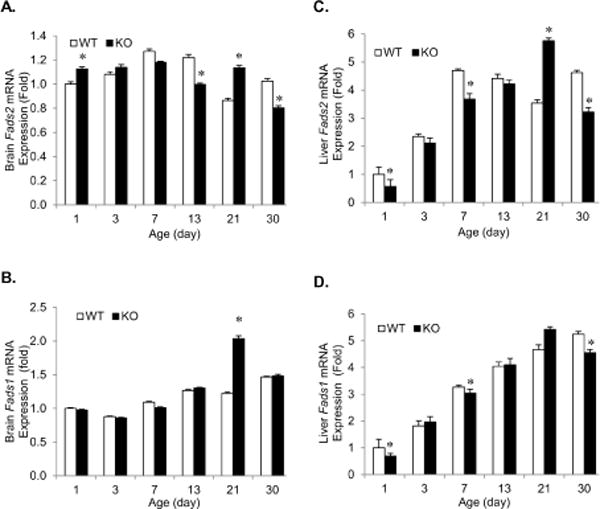
(A) Brain Fads2 mRNA expression levels. KO brain Fads2 mRNA levels were significantly decreased at P13 and P30 but increased at P1 and P21 compared WT. (B) Brain Fads1 mRNA expression levels. Only at P21 KO brain had significantly higher expression levels of Fads1 than WT. No differences were detected at other ages. (C) Liver Fads2 mRNA expression levels. Except for P21, KO had lower Fads2 levels (significant differences found at P1, 7 and 30). (D) Liver Fads1 mRNA expression levels. Fads1 mRNA levels in KO were significantly lower on P1, 7 and 30 compared to WT. The dash line crossing “1” represents WT and the solid bars are mRNA levels of KO mice after normalization. Values are Mean ± 95% CI (n=14) and * P<0.05.
3.5. Hepatic expression of critical genes and transcription factors related to lipid metabolism
Semi-quantitative RT-PCR was performed to test expression levels of critical genes and transcription factors related to lipid metabolism (supplementary Figure 1). Srebf1, also known as Srebp-1c is a key transcription factor involved in the regulation of lipid metabolism. In the absence of Fads3, transcription abundance of hepatic Srebf1 was found to be higher than that of WT on P1 (not statistically significant). Elongation of very long-chain fatty acids (ELOVLs), are a family of enzymes which carry out substrate-specific elongation of fatty acids. The Elovl2 involved in the elongation of C20–C24 PUFA and Elovl5 involved in the elongation of C18 and C20 PUFA are found to be significantly upregulated in P1 KO mice. No obvious changes in the expression levels of Fasn, which catalyzes the conversion of Acetyl-CoA to palmitate [28] and Scd, rate limiting enzyme for the biosynthesis of monounsaturated fatty acids are observed between P1 KO and WT. Ppard and Pparg were not activated at early development in mice; Ppara was upregulated in KO liver on P1. Acaca, which catalyzes the rate limiting step in the biosynthesis of fatty acids by carboxylation of acetyl-CoA to malonyl-CoA was found to be significantly upregulated in P1 KO. We also tested brain expression levels, but no obvious differences on P1 were found in the expression levels between KO and WT brain tissue (data not shown).
3.6. No Δ13-desaturase product was detected in liver or heart
Vaccenic acid (5 mg/day) treatment for one-month, resulted in accumulation of vaccenic acid in the livers and hearts of both WT and KO mice. Trans-11-18:1 was positively identified by GC-CACI-MS/MS at 1.98 ± 0.78% and 0.97 ± 0.42% (w/w) in livers and hearts, respectively. No new peak with molecular weight corresponding to an 18:2 and that might correspond to trans-11,cis-13-18:2 was detected (data not shown). Based on the smallest peaks observed in the chromatogram, we estimate that trans-11, cis-13-18:2, if it is in the liver, is less than 1% of trans-11-18:1. A similar estimate leads to an estimate of less than 5% for heart.
4. Discussion
Because of similarities in gene structure and amino acid homology among the Fads genes, we hypothesized that Fads3 would have a role in HUFA biosynthesis. An early study showed Fads3 to be highly expressed at the implantation site in mice [20]. Fads1 KO mice failed to thrive and died by 12 weeks of age [29] due to AA-deficiency, and Fads2 KO disrupted spermatogenesis and made male Fads2 KO mice infertile [18, 30] and we further hypothesized that Fads3 KO mice would have impaired reproduction. However, the first Fads3 KO mice showed no differences in fertility, litter size or longevity (data not shown) compared to WT. Moreover, Fads3 KO mice had no overt differences in growth, metabolic rate, or overt physical appearance.
HUFA play vital roles in early development so we focused on the biochemical phenotype in early life. The HUFA-rich brain grew similarly in KO and WT mice (Figure 2). Similarly, food intake, water intake, RER and locomotion of Fads3 KO mice were similar to those of WT (data not shown).
Human FADS3 was cloned in 2000 [12] but its function has been elusive. An in vitro report with rat Fads3-transfected COS-7 monkey kidney cells yielded evidence that the Fads3 protein catalyzes Δ13–desaturation, converting vaccenic acid (trans11-18:1, VA) to trans11, cis13-18:2, a novel conjugated linoleic acid isomer. Vaccenic acid is the major trans monoene in cow’s milk, and its Δ13–desaturation would be the first observation of a “back-end” desaturation in mammals. We treated both WT and KO adult male mice with 5 mg of VA per day, an amount calculated to be equivalent to the amount of VA provided per day if all dietary fat was from milk fat, for 30 days. Our GC results showed accumulation of VA in liver and heart, however, we were not able to detect any desaturation product and estimate that conversion, if operating in liver would be less than 1% of the trans-11-18:1 and in heart would be less than 5% of the trans-11-18:1. Our data are consistent with a recent report showing that the putative trans11,cis13-18:2 fatty acid is not detected in goat liver though is present in ruminant milk [31]
Differences in fatty acid profiles between WT and KO were detected. Fatty acid ontogeny in brain showed that HUFA precursor 18:2n-6 was higher but downstream HUFA 20:4n-6 was lower in Fads3 KO on P1; similar trend was observed in the liver. Fads3 gene expression was upregulated by 2.5 fold in Fads2 KO compared to WT [18]. Our study shows that brain and liver Fads1 and Fads2 expression were increased significantly only on P21 in KO mice. Hepatic Elovl2 and Elovl5 expression levels are increased significantly in the absence of Fads3 on P1, which may explain the significant increase of 22:5n-3 levels and implicate Fads3 as a factor influencing elongase activity.
22:6n-3 is the most physiologically important n-3 PUFA in neural and retinal membranes, accounting for 8% of brain dry weight [32], and required for normal brain and vision development [1–3]. Mouse gross brain mass at birth is around 20% of maximum brain weight [35] and grows to 80% of maximum brain weight by P13, characteristic of altricial animals with post-natal BGS (Figure 2C) synchronized with rapid synaptogenesis and myelination [36, 37]. In our study, KO newborn brain 22:6n-3 was significantly lower than WT but normalized by P13 when eyes open (Supplemental Table 2), which may be the reason why we failed to observe any overt differences between two genotypes. Some existing evidence indicates that the 22:6n-3 status of fetus and newborns is positively associated with mothers’ deposit of all HUFA before pregnancy, with HUFA remobilization during gestation, and with maternal-fetal HUFA transfer and uptake of HUFA by fetus/newborns [33,34]. It is plausible that the mothers of KO newborns had impaired capacity for 22:6n-3 synthesis during gestation, inadequate release free HUFA from tissue to blood, or limited transfer via placenta which contributed to low brain accretion of 22:6n-3 in utero and manifested as low brain 22:6n-3 concentration at birth in KO newborns. In the future, the measurements of maternal and fetal HUFA status (in blood and tissues) will shed light on the physiological effects of Fads3 on HUFA metabolism, particularly 22:6n-3 in brain during early development. It is plausible that low brain 22:6n-3 concentration in the P1 KO is due to residual low accumulation of brain 22:6n-3 during fetal life that is corrected in the first days of independent life. We did not check maternal 22:6n-3 levels to shed light on the cause of low neonatal brain 22:6n-3.
Brain 22:6n-3 after birth can be obtained postnatally either from circulating preformed 22:6n-3 or from de novo synthesis in the brain [38]. Before P13, milk is the sole food for neonates. In the milk of chow-fed mice, 18:2n-6 is the major PUFA accounting for ~15% of total fatty acids by weight and 18:3n-3, 20:4n-6, 22:6n-3 are less than 1% of total fatty acids [39]. In liver we found 18:3n-3 and the downstream product 22:5n-3 in KO were generally higher in P1–P21 compared to age-matched WT (Supplemental Table 3). Of the sum of 22:5+22:6, the proportion of 22:6 was greater in the WT than the KO (95% vs 88%, respectively, at P1) reflecting less net product accumulation in KO and suggesting that Fads3 plays a role in 22:6n-3 synthesis or accumulation (Figure 5A). Fads2 expression is downregulated in P1 KO liver (Figure 6) where Fads2 mediated 22:6n-3 synthesis via Δ4-desaturation (22:5n-3→22:6n-3) [11] or Δ6-desaturation (24:5n-3→24:6n-3(→22:6n-3)) [40] might be affected. As liver supplies 22:6n-3 to the developing brain [41], lower hepatic Fads2 expression and reduced Fads2 mediated net conversion of 22:5n-3 to 22:6n-3 may explain lower amounts of 22:6n-3 in the KO brains. DPA is converted from EPA via elongation catalyzed by Elovl2 or Elovl5 [42, 43]. In P1 KO the precursor-product levels for the conversion 20:5n-3→22:5n-3 was much greater than WT (Figure 5B), consistent with increased hepatic expression of Elovl2 and Elovl5 (supplement Figure 1).
Our results provide evidence that Fads3 in vivo acts to reduce elongase expression and by implication, activity. Fads3 is extensively spliced and it has been demonstrated that splice variants can modulate several enzymatic activities, such as substrate specificity, catalytic properties, activity regulation and also can have dominant negative effects over the catalytically active enzymes [14, 44, 45]. Ex vivo and in vitro studies showed that 22:5n-3 is a potent inhibitor of platelet aggregation [46] and effective stimulator of endothelial cell migration [47], suggesting that 22:5n-3 is beneficial for cardiovascular health. Most interestingly, a recent in vivo study indicated that 22:5n-3 exerted neuroprotective effects on improving spatial learning task by attenuating age-related increase in microglial activation [48].
Besides hepatic 22:6n-3 supplying brain 22:6n-3, 22:6n-3 can also be synthesized in the brain in situ [38]. The ontogeny of Δ6-desaturation enzyme activity in mouse brain is highest in late fetal life and drops continuously until weaning. In contrast, hepatic Δ6-desaturation activity is near zero in late fetal life, rises sharply to peak at 7 days about 2.5-fold greater than the highest brain activity, then plateaus at 13 days about 50% greater activity than peak brain activity [49]. We found that brain Fads2 mRNA expression varied with development in KO, gradual decrease till P13 (significant only at P13), significant increase at P21 and then significant decrease at P30 (Figure 6A).
Ubiquitously present 20:4n-6 [50], is indispensable for growth and development [1], besides being precursors for eicosanoid signaling [51–53]. KO mice at P1 had significantly lower amounts of 20:4n-6 but higher amounts of precursor 18:2n-6 in both brain and liver tissues compared to age-matched controls (Supplemental Table 2, Supplemental Table 3). During development, brain 20:4n-6 can be transported from liver, the major tissue for de novo synthesis of HUFA in newborn pups [54]. Lower hepatic 20:4n-6 in KO than WT (8.2 ± 2.4 vs. 10.2 ± 1.5) and higher LA levels in KO than WT (18.2 ± 4.4 vs. 12.1 ± 4.6) (Supplemental Table 3) are consistent with the downregulation of Fads1 and Fads2 in P1 (Figure 6). Similarly, in KO brain, 20:4n-6 was lower than WT but 18:2n-6 was higher on P1 (Supplemental Table 3); however there was no significant changes in Fads1 expression levels. Adrenic acid (ADA, 22:4n-6), the elongation product of 20:4n-6, is the third most abundant PUFA in the neonatal brain in mice (Supplemental Table 2) and in humans [55]. Brain 22:4n-6 accretion was fast during the BGS consistent with its physiological role in myelination [55]. Similar to 20:4n-6, 22:4n-6 was lower in KO brains than for WT at P1 (Supplemental Table 2). However, liver 20:4n-6 was lower in P1 KO than WT, but 22:4n-6 was higher (Figure 4F), consistent with the significant upregulation of Elovl2 and Elovl5 in P1 (Supplement Figure 1). Significantly higher amounts of 22:5n-3 and 22:4n-6, both elongation products in liver further suggests that Fads3 influences Elovl2 or Elovl5. All the above observations indicate that Fads3 plays a role during early development as an enhancer of HUFA biosynthesis and/or regulation.
In conclusion, Fads3 KO mice were overtly normal. The HUFA pattern points to a role for the liver in producing 22:6n-3 destined for the brain. Consistent with hypothesis, in Fads3 KO neonates, hepatic Fads1 and Fads2 were lower and Elovl2 and Elovl5 were higher, reflecting compensation to produce more intermediates. It is tempting to speculate that Fads3 may have a role in maintaining 22:6n-3 synthesis during the BGS when dietary omega-3 is limiting.
Supplementary Material
Highlights.
The first global Fads3 knockout (KO) mice show no overt differences compared to wild type.
DHA levels on postnatal day 1 (P1) are lower in KO brains.
DPA to DHA ratio at P1 was lower in KO livers suggesting lower desaturase activity.
Fads3 may facilitate desaturation while inhibiting elongation during early development.
Acknowledgments
Sources of support:
This work was supported by the National Center for Complementary Integrative Health (NCCIH) and the Office of Dietary Supplements, NIH grant R01 AT007003.
This project was supported by the NIH Office of Dietary Supplements and the National Center for Complementary Integrative Health (NCCIH) grant R01 AT007003 (to JTB). The authors thank Zhen Wang and Michal A. Norry for technical assistance and Multidisciplinary Postdoctoral Training Grant in Cardiovascular Research NIH Grant T32 HL0007224 in the final stages of manuscript preparation. Its contents are solely the responsibility of the authors and do not necessarily represent the official views of the NIH.
Footnotes
Conflicts of interests
The authors have no conflicts of interests in the subject matter or material discussed in this manuscript.
Authorship
Zhang JY designed and conducted experiments, analyzed data and drafted the manuscript; Qin X and Liang A and Kim E contributed to acquisition of data and critical revision of the manuscript; Lawrence P contributed to acquisition and interpretation of data and revision of the manuscript for important intellectual content; Park WJ made substantial contribution to conception and design of experiment and revision the manuscript critically; Kothapalli KSD and Brenna JT made substantial contributions to the conception and design of this study and provided critical revision of the manuscript for important intellectual content. All authors mentioned above approved the final manuscript and agreed to the corresponding authors acting on their behalf.
Publisher's Disclaimer: This is a PDF file of an unedited manuscript that has been accepted for publication. As a service to our customers we are providing this early version of the manuscript. The manuscript will undergo copyediting, typesetting, and review of the resulting galley proof before it is published in its final citable form. Please note that during the production process errors may be discovered which could affect the content, and all legal disclaimers that apply to the journal pertain.
References
- 1.Much D, et al. Effect of dietary intervention to reduce the n-6/n-3 fatty acid ratio on maternal and fetal fatty acid profile and its relation to offspring growth and body composition at 1 year of age. Eur J Clin Nutr. 2013;67(3):282–8. doi: 10.1038/ejcn.2013.2. [DOI] [PubMed] [Google Scholar]
- 2.Hoffman DR, Boettcher JA, Diersen-Schade DA. Toward optimizing vision and cognition in term infants by dietary docosahexaenoic and arachidonic acid supplementation: a review of randomized controlled trials. Prostaglandins Leukot Essent Fatty Acids. 2009;81(2–3):151–8. doi: 10.1016/j.plefa.2009.05.003. [DOI] [PubMed] [Google Scholar]
- 3.Brenna JT, Carlson SE. Docosahexaenoic acid and human brain development: Evidence that a dietary supply is needed for optimal development. J Hum Evol. 2014 doi: 10.1016/j.jhevol.2014.02.017. [DOI] [PubMed] [Google Scholar]
- 4.Dobbing J, Sands J. Comparative aspects of the brain growth spurt. Early Hum Dev. 1979;3(1):79–83. doi: 10.1016/0378-3782(79)90022-7. [DOI] [PubMed] [Google Scholar]
- 5.Finlay BL, Darlington RB. Linked regularities in the development and evolution of mammalian brains. Science. 1995;268(5217):1578–84. doi: 10.1126/science.7777856. [DOI] [PubMed] [Google Scholar]
- 6.Innis SM. Dietary (n-3) fatty acids and brain development. J Nutr. 2007;137(4):855–9. doi: 10.1093/jn/137.4.855. [DOI] [PubMed] [Google Scholar]
- 7.Los DA, Murata N. Structure and expression of fatty acid desaturases. Biochim Biophys Acta. 1998;1394(1):3–15. doi: 10.1016/s0005-2760(98)00091-5. [DOI] [PubMed] [Google Scholar]
- 8.Nakamura MT, Nara TY. Structure, function, and dietary regulation of delta6, delta5, and delta9 desaturases. Annu Rev Nutr. 2004;24:345–76. doi: 10.1146/annurev.nutr.24.121803.063211. [DOI] [PubMed] [Google Scholar]
- 9.Park WJ, et al. An alternate pathway to long-chain polyunsaturates: the FADS2 gene product Delta8-desaturates 20:2n-6 and 20:3n-3. J Lipid Res. 2009;50(6):1195–202. doi: 10.1194/jlr.M800630-JLR200. [DOI] [PMC free article] [PubMed] [Google Scholar]
- 10.Ichi I, et al. Identification of genes and pathways involved in the synthesis of Mead acid (20:3n-9), an indicator of essential fatty acid deficiency. Biochim Biophys Acta. 2014;1841(1):204–13. doi: 10.1016/j.bbalip.2013.10.013. [DOI] [PubMed] [Google Scholar]
- 11.Park HG, et al. The fatty acid desaturase 2 (FADS2) gene product catalyzes Delta4 desaturation to yield n-3 docosahexaenoic acid and n-6 docosapentaenoic acid in human cells. FASEB J. 2015 doi: 10.1096/fj.15-271783. [DOI] [PMC free article] [PubMed] [Google Scholar]
- 12.Marquardt A, et al. cDNA cloning, genomic structure, and chromosomal localization of three members of the human fatty acid desaturase family. Genomics. 2000;66(2):175–83. doi: 10.1006/geno.2000.6196. [DOI] [PubMed] [Google Scholar]
- 13.Park WJ, et al. FADS2 function loss at the cancer hotspot 11q13 locus diverts lipid signaling precursor synthesis to unusual eicosanoid fatty acids. PLoS One. 2011;6(11):e28186. doi: 10.1371/journal.pone.0028186. [DOI] [PMC free article] [PubMed] [Google Scholar]
- 14.Park WJ, et al. Novel fatty acid desaturase 3 (FADS3) transcripts generated by alternative splicing. Gene. 2009;446(1):28–34. doi: 10.1016/j.gene.2009.06.016. [DOI] [PMC free article] [PubMed] [Google Scholar]
- 15.Brenna JT, Kothapalli KS, Park WJ. Alternative transcripts of fatty acid desaturase (FADS) genes. Prostaglandins Leukot Essent Fatty Acids. 2010;82(4–6):281–5. doi: 10.1016/j.plefa.2010.02.011. [DOI] [PMC free article] [PubMed] [Google Scholar]
- 16.Pedrono F, et al. The fatty acid desaturase 3 gene encodes for different FADS3 protein isoforms in mammalian tissues. J Lipid Res. 2010;51(3):472–9. doi: 10.1194/jlr.M000588. [DOI] [PMC free article] [PubMed] [Google Scholar]
- 17.Park WJ, et al. A novel FADS1 isoform potentiates FADS2-mediated production of eicosanoid precursor fatty acids. J Lipid Res. 2012;53(8):1502–12. doi: 10.1194/jlr.M025312. [DOI] [PMC free article] [PubMed] [Google Scholar]
- 18.Stroud CK, et al. Disruption of FADS2 gene in mice impairs male reproduction and causes dermal and intestinal ulceration. J Lipid Res. 2009;50(9):1870–80. doi: 10.1194/jlr.M900039-JLR200. [DOI] [PMC free article] [PubMed] [Google Scholar]
- 19.Reardon HT, et al. Dietary long-chain polyunsaturated fatty acids upregulate expression of FADS3 transcripts. Prostaglandins Leukot Essent Fatty Acids. 2013;88(1):15–9. doi: 10.1016/j.plefa.2012.02.003. [DOI] [PMC free article] [PubMed] [Google Scholar]
- 20.Ma XH, et al. Serial analysis of gene expression in mouse uterus at the implantation site. J Biol Chem. 2006;281(14):9351–60. doi: 10.1074/jbc.M511512200. [DOI] [PubMed] [Google Scholar]
- 21.Rioux V, et al. Trans-vaccenate is Delta13-desaturated by FADS3 in rodents. J Lipid Res. 2013;54(12):3438–52. doi: 10.1194/jlr.M042572. [DOI] [PMC free article] [PubMed] [Google Scholar]
- 22.Plaisier CL, et al. A systems genetics approach implicates USF1, FADS3, and other causal candidate genes for familial combined hyperlipidemia. PLoS Genet. 2009;5(9):e1000642. doi: 10.1371/journal.pgen.1000642. [DOI] [PMC free article] [PubMed] [Google Scholar]
- 23.Koletzko B, et al. Genetic variants of the fatty acid desaturase gene cluster predict amounts of red blood cell docosahexaenoic and other polyunsaturated fatty acids in pregnant women: findings from the Avon Longitudinal Study of Parents and Children. Am J Clin Nutr. 2011;93(1):211–9. doi: 10.3945/ajcn.110.006189. [DOI] [PubMed] [Google Scholar]
- 24.Capecchi MR. Gene targeting in mice: functional analysis of the mammalian genome for the twenty-first century. Nat Rev Genet. 2005;6(6):507–12. doi: 10.1038/nrg1619. [DOI] [PubMed] [Google Scholar]
- 25.Garces R, Mancha M. One-step lipid extraction and fatty acid methyl esters preparation from fresh plant tissues. Anal Biochem. 1993;211(1):139–43. doi: 10.1006/abio.1993.1244. [DOI] [PubMed] [Google Scholar]
- 26.Livak KJ, Schmittgen TD. Analysis of relative gene expression data using real-time quantitative PCR and the 2(-Delta Delta C(T)) Method. Methods. 2001;25(4):402–8. doi: 10.1006/meth.2001.1262. [DOI] [PubMed] [Google Scholar]
- 27.Michaud AL, et al. Double bond localization in minor homoallylic fatty acid methyl esters using acetonitrile chemical ionization tandem mass spectrometry. Anal Biochem. 2002;307(2):348–60. doi: 10.1016/s0003-2697(02)00037-4. [DOI] [PubMed] [Google Scholar]
- 28.Wakil SJ, Abu-Elheiga LA. Fatty acid metabolism: target for metabolic syndrome. J Lipid Res. 2009;50(Suppl):S138–43. doi: 10.1194/jlr.R800079-JLR200. [DOI] [PMC free article] [PubMed] [Google Scholar]
- 29.Fan YY, et al. Characterization of an arachidonic acid-deficient (Fads1 knockout) mouse model. J Lipid Res. 2012;53(7):1287–95. doi: 10.1194/jlr.M024216. [DOI] [PMC free article] [PubMed] [Google Scholar]
- 30.Stoffel W, et al. Delta6-desaturase (FADS2) deficiency unveils the role of omega3- and omega6-polyunsaturated fatty acids. EMBO J. 2008;27(17):2281–92. doi: 10.1038/emboj.2008.156. [DOI] [PMC free article] [PubMed] [Google Scholar]
- 31.Garcia C, et al. Synthesis of the suspected trans-11,cis-13 conjugated linoleic acid isomer in ruminant mammary tissue by FADS3-catalyzed Delta13-desaturation of vaccenic acid. J Dairy Sci. 2017;100(1):783–796. doi: 10.3168/jds.2016-11455. [DOI] [PubMed] [Google Scholar]
- 32.Muskiet FA, et al. Long-chain polyunsaturated fatty acids in maternal and infant nutrition. Prostaglandins Leukot Essent Fatty Acids. 2006;75(3):135–44. doi: 10.1016/j.plefa.2006.05.010. [DOI] [PubMed] [Google Scholar]
- 33.Haggarty P. Effect of placental function on fatty acid requirements during pregnancy. Eur J Clin Nutr. 2004;58(12):1559–1570. doi: 10.1038/sj.ejcn.1602016. [DOI] [PubMed] [Google Scholar]
- 34.Lauritzen L, Carlson SE. Maternal fatty acid status during pregnancy and lactation and relation to newborn and infant status. Matern Child Nutr. 2011;7(Suppl 2):41–58. doi: 10.1111/j.1740-8709.2011.00303.x. [DOI] [PMC free article] [PubMed] [Google Scholar]
- 35.Agrawal HC, Davis JM, Himwich WA. Developmental changes in mouse brain: weight, water content and free amino acids. J Neurochem. 1968;15(9):917–23. doi: 10.1111/j.1471-4159.1968.tb11633.x. [DOI] [PubMed] [Google Scholar]
- 36.Workman AD, et al. Modeling transformations of neurodevelopmental sequences across mammalian species. J Neurosci. 2013;33(17):7368–83. doi: 10.1523/JNEUROSCI.5746-12.2013. [DOI] [PMC free article] [PubMed] [Google Scholar]
- 37.Green P, et al. Developmental changes in rat brain membrane lipids and fatty acids. The preferential prenatal accumulation of docosahexaenoic acid. J Lipid Res. 1999;40(5):960–6. [PubMed] [Google Scholar]
- 38.Igarashi M, et al. Docosahexaenoic acid synthesis from alpha-linolenic acid by rat brain is unaffected by dietary n-3 PUFA deprivation. J Lipid Res. 2007;48(5):1150–8. doi: 10.1194/jlr.M600549-JLR200. [DOI] [PubMed] [Google Scholar]
- 39.Suburu J, et al. Fatty acid synthase is required for mammary gland development and milk production during lactation. Am J Physiol Endocrinol Metab. 2014;306(10):E1132–43. doi: 10.1152/ajpendo.00514.2013. [DOI] [PMC free article] [PubMed] [Google Scholar]
- 40.Voss A, et al. The metabolism of 7,10,13,16,19-docosapentaenoic acid to 4,7,10,13,16,19-docosahexaenoic acid in rat liver is independent of a 4-desaturase. J Biol Chem. 1991;266(30):19995–20000. [PubMed] [Google Scholar]
- 41.Scott BL, Bazan NG. Membrane docosahexaenoate is supplied to the developing brain and retina by the liver. Proc Natl Acad Sci U S A. 1989;86(8):2903–7. doi: 10.1073/pnas.86.8.2903. [DOI] [PMC free article] [PubMed] [Google Scholar]
- 42.Leonard AE, et al. Identification and expression of mammalian long-chain PUFA elongation enzymes. Lipids. 2002;37(8):733–40. doi: 10.1007/s11745-002-0955-6. [DOI] [PubMed] [Google Scholar]
- 43.Wang Y, et al. Elevated hepatic fatty acid elongase-5 activity affects multiple pathways controlling hepatic lipid and carbohydrate composition. J Lipid Res. 2008;49(7):1538–52. doi: 10.1194/jlr.M800123-JLR200. [DOI] [PMC free article] [PubMed] [Google Scholar]
- 44.Reardon HT, et al. The polypyrimidine tract binding protein regulates desaturase alternative splicing and PUFA composition. J Lipid Res. 2011;52(12):2279–86. doi: 10.1194/jlr.M019653. [DOI] [PMC free article] [PubMed] [Google Scholar]
- 45.Stamm S, et al. Function of alternative splicing. Gene. 2005;344:1–20. doi: 10.1016/j.gene.2004.10.022. [DOI] [PubMed] [Google Scholar]
- 46.Akiba S, et al. Involvement of lipoxygenase pathway in docosapentaenoic acid-induced inhibition of platelet aggregation. Biol Pharm Bull. 2000;23(11):1293–7. doi: 10.1248/bpb.23.1293. [DOI] [PubMed] [Google Scholar]
- 47.Kanayasu-Toyoda T, Morita I, Murota S. Docosapentaenoic acid (22:5, n-3), an elongation metabolite of eicosapentaenoic acid (20:5, n-3), is a potent stimulator of endothelial cell migration on pretreatment in vitro. Prostaglandins Leukot Essent Fatty Acids. 1996;54(5):319–25. doi: 10.1016/s0952-3278(96)90045-9. [DOI] [PubMed] [Google Scholar]
- 48.Kelly L, et al. The polyunsaturated fatty acids, EPA and DPA exert a protective effect in the hippocampus of the aged rat. Neurobiol Aging. 2011;32(12):2318e1–15. doi: 10.1016/j.neurobiolaging.2010.04.001. [DOI] [PubMed] [Google Scholar]
- 49.Bourre JM, Piciotti M, Dumont O. Delta 6 desaturase in brain and liver during development and aging. Lipids. 1990;25(6):354–6. doi: 10.1007/BF02544347. [DOI] [PubMed] [Google Scholar]
- 50.Zhou L, Nilsson A. Sources of eicosanoid precursor fatty acid pools in tissues. J Lipid Res. 2001;42(10):1521–42. [PubMed] [Google Scholar]
- 51.Calder PC. Polyunsaturated fatty acids and inflammatory processes: New twists in an old tale. Biochimie. 2009;91(6):791–5. doi: 10.1016/j.biochi.2009.01.008. [DOI] [PubMed] [Google Scholar]
- 52.Ishitobi T, et al. Eicosapentaenoic acid/arachidonic acid ratio as a possible link between non-alcoholic fatty liver disease and cardiovascular disease. Hepatol Res. 2014 doi: 10.1111/hepr.12382. [DOI] [PubMed] [Google Scholar]
- 53.Sears B, Ricordi C. Role of fatty acids and polyphenols in inflammatory gene transcription and their impact on obesity, metabolic syndrome and diabetes. Eur Rev Med Pharmacol Sci. 2012;16(9):1137–54. [PubMed] [Google Scholar]
- 54.Farooqui AA. Transport, synthesis, and incorporation of n-3 and n-6 fatty acids in brain glycerophospholipids. Beneficial Effects of Fish Oil on Human Brain. 2009:47–78. [Google Scholar]
- 55.Martinez M. Tissue levels of polyunsaturated fatty acids during early human development. J Pediatr. 1992;120(4 Pt 2):S129–38. doi: 10.1016/s0022-3476(05)81247-8. [DOI] [PubMed] [Google Scholar]
Associated Data
This section collects any data citations, data availability statements, or supplementary materials included in this article.