 The volatile, water soluble trichloroethylene (TCE) is a hazardous industrial waste and could lead to various health problems through disrupting the interaction between DNA and epigenetic enzymes.
Abstract
The volatile, water soluble trichloroethylene (TCE) is a hazardous industrial waste and could lead to various health problems, including cancer, neuropathy, cardiovascular defects, and immune diseases. Toxicological studies using in vitro and in vivo models have been conducted to understand the biological impacts of TCE at the genetic, transcriptomic, metabolomic, and signaling levels. The epigenetic aberrations induced by TCE have also been reported in a number of model organisms, while a detailed mechanistic elucidation is lacking. In this study we uncover an unreported mechanism accounting for the epigenetic toxicity due to TCE exposure by monitoring the single-molecule dynamics of DNA methyltransferase 3a (Dnmt3a) in living cells. TCE-induced global DNA hypomethylation could be partly attributed to the disrupted Dnmt3a–DNA association. By analyzing the components of detached Dnmt3a, we found that the Dnmt3a oligomers (e.g., dimer, trimer, and high-order oligomers) dissociated from heterochromatin in a dose-dependent manner upon exposure. Thereafter the diminished DNA-binding affinity of Dnmt3a resulted in a significant decrease in 5-methylcytosine (5mC) under both acute high-dosage and chronic low-dosage TCE exposure. The resulting DNA demethylation might also be contributed by the elevated expression of ten-eleven-translocation (Tet) enzymes and a reformed cysteine cycle. Besides the global effect, we further identified that a group of heterochromatin-located, cancer-related microRNAs (miRNAs) experienced promoter demethylation upon TCE exposure.
Introduction
TCE is a chlorinated hydrocarbon that has been popular as an inhaled anesthetic and an industrial solvent since the 1920s. However, a wide range of health issues were later found to correlate with TCE, and thus its use in medicine, food, and pharmaceutical industries rapidly declined until an enforced ban in the United States by the 1980s. At present, TCE is widely used as a metal degreaser and an extraction solvent, giving rise to millions of pounds of released waste annually. Other than occupational exposure, the most common human contact with TCE comes from a contamination of drinking groundwater or inhaling the vapor pollutant. The hazardous effects of TCE to health are extensive, including acute toxicity to multiple organ systems (e.g., central nervous system, gastrointestinal system, liver, kidney, heart, and lung) and chronic toxicity related to cancers.1 According to the United States Environmental Protection Agency (USEPA), TCE is designated as a human carcinogen with a maximum contaminant level of 5 parts per billion (ppb; μg L–1).2
Although the toxic influences of TCE have been broadly observed, systematic mechanistic studies at the molecular level have been insufficient considering its complex intracellular metabolism and extensive interactions with different biomolecules. Previous studies note that TCE and its major metabolites such as trichloroacetate (TCA) and dichloroacetate (DCA) could interfere with cellular metabolism, signal transduction, mitochondrial function, and enzymatic activities, and in turn lead to epigenetic aberrations.3 Among a myriad of impacted cell functions, methyl metabolism is known to be affected by TCE toxicity. Exposure to TCE can cause severe oxidative stress in cells so that more cysteine would be drawn to enter the glutathione (GSH) synthesis pathway for boosting antioxidant defenses.4,5 This metabolic shift will subsequently compromise the reservoir of S-adenosylmethionine (SAM) which is the methyl donor for Dnmt catalysis. As a consequence, DNA hypomethylation oftentimes manifests as an early epigenetic anomaly, which has been reported in both in vitro and in vivo models.6–9 Other than reshaping the methyl metabolism, TCE may change the transcriptional level of Dnmts in some cell types to promote global demethylation.3
Another route to inspect the toxicity of TCE and relevant metabolites is by characterizing their potential associations with DNA and proteins. It has been observed that the binding of TCE to DNA and proteins could substantially disrupt the molecular conformation and related enzyme activities.10–13 For instance, reactions of cysteine, serine, tyrosine, and threonine with the intermediate products from TCE oxide hydrolysis could irreversibly disable some enzymes in function.12 However, few of the previous studies tested whether the formed chemical adducts can also influence the real-time protein–DNA interactions in living cells, especially in the context of epigenetic regulation. Single-molecule fluorescence tools open a unique window to monitor molecular events within single intact cells.14 Information on the hydrodynamic size, mobility, association, stoichiometry, and localization of fluorescence labeled molecules can be obtained from cells with unprecedented resolution and accuracy.15–17 By implementing appropriate single-molecule techniques, some intracellular epigenetic events such as DNA demethylation and maintenance methylation have been successfully probed, which otherwise is not possible with the conventional ensemble, end-point measurements.18,19
In this study, we attempt to elucidate the toxicological mechanism of TCE by examining the dissociation of Dnmt3a from its chromatin binding sites with advanced fluorescence correlation spectroscopy (FCS). In our experiments, we not only demonstrate that TCE could significantly detach Dnmt3a from heterochromatin but also note that the different stoichiometric forms of Dnmt3a respond variedly to the TCE-caused detachment. Our unique methodology herein provides a novel perspective to understanding the epigenetic toxicity of TCE.
Materials and methods
Construction of the Dnmt3a–EGFP plasmid
The fusion protein of Dnmt3a–EGFP was generated by sequentially assembling the coding sequences of the desired proteins using standard restriction enzyme digest and ligation method. The inserts were incorporated into the pShooter (pCMV/myc/nuc) mammalian expression vector (V821-20, Life Technologies). Prior to the incorporation of inserts, an adapter molecule was introduced in the multiple cloning sites (MCS) of the vector with NcoI and PstI flanking at the 5′ and 3′ end, respectively. The adapter molecule was generated by annealing equimolar concentration of primers UP and LP at 50 °C for 10 min. UP sequence: 5′-CATGGATCCGAGGCGCGCCGCTAGCGGTACCCTGCA-3′; LP sequence: 5′-GGGTACCGCTAGCGGCGCGCCTCGGATC-3′. The adapter thus made was ligated to the vector after double digestion with NcoI and PstI. This adapter molecule introduced new restriction sites to the vector, including BamHI, AscI, NheI, KpnI, and SfbI. The source plasmids of Dnmt3a (#35521 from Dr Arthur Riggs group), and EGFP (#23027 from Dr Andrea LeBlanc group) were obtained from the Addgene plasmid repository (; https://www.addgene.org). Dnmt3a and EGFP were PCR amplified with desired restriction sites (NheI-SalI and SalI-NotI respectively) flanking on either side, from the source plasmids. Suitable linker molecules were included to the primer sequences, where needed. The PCR reaction was carried out as specified by the manufacturer (CloneAmpHiFi PCR Premix, Clontech) for the template DNA concentration >100 ng with 35 cycles of amplification. Details of the PCR primers are summarized in Table 1. Digested PCR amplicons were gel purified using the QIAEX II gel extraction kit (Qiagen). Purified vector and inserts thus made were ligated along with requisite amount of T4 ligase buffer and T4 DNA ligase (New England Biolabs) and kept at room temperature for 15 min. The ligated products were then transformed into the stellar competent cells (PT5056-2, Clontech) and plated out on ampicillin-containing LB agar plate. Suitable clones were propagated and the plasmids were extracted with the QIAprep Spin Miniprep kit (Qiagen). The constructed plasmids were sequenced for validation.
Table 1. Primers used in this study for molecular cloning. The restriction sites are underlined and linker molecules are presented in italic font. All primers listed are 5′ to 3′.
| Forward | Reverse | |
| DNMT3a | atcgtt agcggaagtacacccgca
|
atccta CCACACACGCAAAATACTCC CCACACACGCAAAATACTCC |
| ATGCCCGCCATGCCCTCCAGCGGCCCCG | TTCAGCGGAG | |
| EGFP | atccta gaagcggaagtacacccgca
|
TCTACAAA CTACTTGTACAGCT CTACTTGTACAGCT |
| ATGGTGAGCAAGGGCGAGG | CGTCCATG |
Cell culture and transfection
Human HeLa cells and HEK293 cells were routinely cultured with DMEM/F12 medium supplemented with 10% fetal bovine serum, 1% antibiotics, and 5% CO2 at 37 °C. Dnmt3a-KO HeLa cells were established with the CRISPR/Cas9 system. For rescue transfection, cells were seeded onto no. 1 coverslips (VWR International) in a 12-well culture plate and grown to 80% confluence. Prior to transfection, the culture medium was replaced with antibiotic-free, low-serum medium for another 12 h. For each well 500 ng Dnmt3a–EGFP plasmid was transfected with Lipofectamine LTX reagent (Life Technologies). Transfection lasted for 24 h followed by TCE treatment and FCS measurement. All applied TCE treatments are summarized in Table S1.†
Dnmt3a knockout with CRISPR/Cas9
The endogenous Dnmt3a in HeLa cells was knocked out with Dnmt3a CRISPR/Cas9 KO plasmids (sc-400323,) and UltraCruz transfection reagent (sc-395739, Santa Cruz Biotechnology). A pool of three 20-nt guide RNAs was introduced to induce double strand breaks in the 5′ consecutive exons of the human DNMT3A gene. 1 μg of KO plasmid was used for every 4 × 10⁵ cells. The KO process lasted for 72 h and then was evaluated by immunofluorescence staining. For staining, the cells were fixed with 4% ice cold paraformaldehyde for 20 min and permeabilization with 0.25% Triton X-100 for 30 min at room temperature. The blocking step was performed with PBS containing 5% goat serum and 0.3% Triton X-100 for 1 h at room temperature. Then 1 : 200 diluted Rabbit polyclonal Anti-Dnmt3a antibody (ab4897, Abcam) was incubated with the cells overnight at 4 °C. Next day, 1 : 500 diluted Alexa-546-tagged Goat anti-Rabbit antibody was applied for 1 h at room temperature. Prior to imaging, the cells were completely rinsed with fresh PBS. Fluorescence images were obtained with an EVOS FL cell imaging system (Thermo Fisher Scientific).
Single-molecule fluorescence microscopy and FCS
Single-molecule experiments were performed with a Microtime 200 scanning confocal time-resolved microscope (PicoQuant GmbH). A 465 nm picosecond pulsed laser was used to excite the Dnmt3a–EGFP. The excitation beam was delivered to the sample stage through a 60×, NA 1.2 apochromatic water immersion objective lens and the emitted fluorescence was collected by the same objective lens. A 50 μm pinhole was applied to block off-focus photons and the final signal was further filtered by a 520 ± 20 nm band-pass filter (Chroma). Photons were registered by using a single photon avalanche photodiode detector (SPCM-AQR, PerkinElmer) and stored in time-tagged time-resolved (TTTR) mode (TimeHarp200).
FCS analysis was performed with the SymPhoTime software package (PicoQuant GmbH). In FCS, the collected fluorescence fluctuation in the effective volume (∼0.6 femtoliter for 465 nm laser) is attributed to the concentration and hydrodynamic size of molecules, which can be expressed as an autocorrelation function:20 where where 〈F〉 is the average fluorescence intensity, is the average fluorescence intensity, τ is the time lag, and δF(t) = F(t) – ) − 〈F(t))〉. To characterize the diffusion of Dnmt3a–EGFP, a multi-component 3D diffusion model was applied to fit the autocorrelation functions:. To characterize the diffusion of Dnmt3a–EGFP, a multi-component 3D diffusion model was applied to fit the autocorrelation functions:21
 where where 〈N〉 is the average number of molecules, is the average number of molecules, fi is the fraction of species i, κ is the spatial dimension of the measurement volume (ratio of the radial to axial radii), and τDi is the characteristic diffusion time.
Quantification of DNA methylation
Total DNA from the cells upon specific treatments was extracted and purified with the DNeasy kit (Qiagen), followed by quality control with a NanoDrop spectrophotometer (Thermo Scientific). The level of global DNA methylation was quantified with the MethylFlash methylated DNA quantification kit (Epigentek). The methylation assay is a 96-well-plate-based colorimetric immunoassay. In each well 100 ng of DNA was attached to the bottom surface and the DNA methylation marks were labeled with monoclonal antibodies. The developed color signals were normalized to that from a standard DNA sample with known methylation percentage. The promoter methylation of selected cancer miRNAs was assessed by a PCR-based EpiTect Methyl II array (EAHS-591Z, Qiagen), following the protocol provided by the manufacturer.
Quantitative real-time PCR (qRT-PCR)
Total RNA was purified from the cells with the RNeasy mini kit (Qiagen) followed by reverse transcription with the iScript cDNA synthesis kit (Bio-Rad). Genomic DNA was removed from RNA samples by DNase I. PCR amplification was performed with SYBR Green PCR master mix (Life Technologies) in a StepOnePlus real-time PCR system (Applied Biosystems). The ΔΔCt method was used to normalize the transcription to the GAPDH gene. All PCR primers used in this study are listed in Table 2.
Table 2. qRT-PCR primers used in this study.
| GAPDH | (F)CAGCCTCAAGATCATCAGCA |
| (R)TGTGGTCATGAGTCCTTCCA | |
| Dnmt3a | (F)TATTGATGAGCGCACAAGAGAGC |
| (R)GGGTGTTCCAGGGTAACATTGAG | |
| Dnmt3b | (F)GGCAAGTTCTCCGAGGTCTCTG |
| (R)TGGTACATGGCTTTTGGATAGGA | |
| Dnmt1 | (F)TACCTGACGACCCTGACCTC |
| (R)CGTTGGCATCAAAGATGGACA | |
| Tet1 | (F)AATGGAAGCACTGTGGTTTG |
| (R)ACATGGAGCTGCTCATCTTG | |
| Tet2 | (F)AATGGCAGCACATTGGTATG |
| (R)AGCTTCCACACTCCCAAACT | |
| Tet3 | (F)ATGTACTTCAACGGCTGCAA |
| (R)CGGAGCACTTCTTCCTCTTT |
Statistical analysis
Data are shown as mean with standard deviation in figures. Student t-test was used for significance test and a threshold of p < 0.05 was applied. All analyses were performed in OriginPro software.
Results
A cell model to provide insights into the behavior of Dnmt3a in the TCE-induced DNA hypomethylation
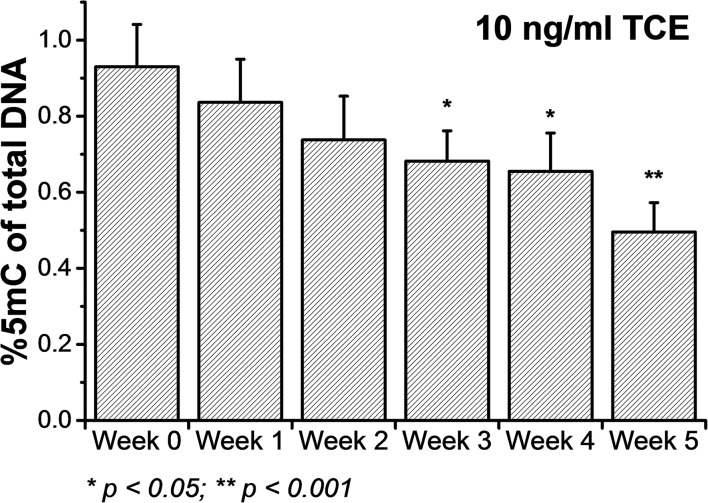
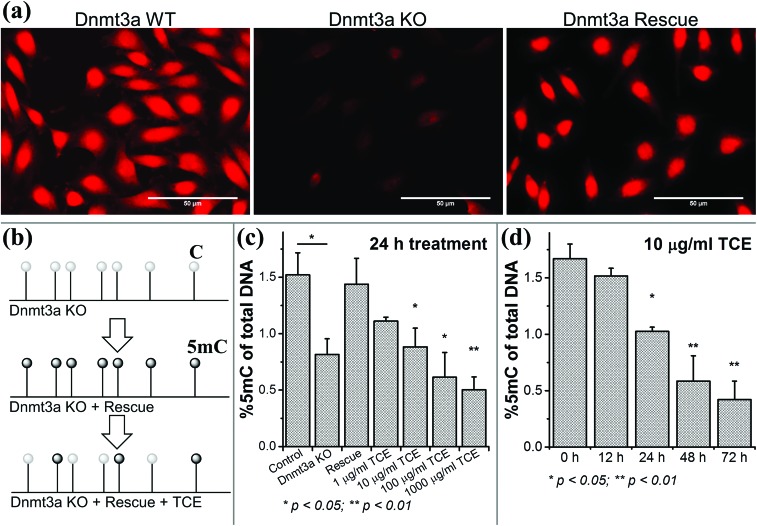
As a first step we evaluated the TCE-induced DNA demethylation effects in HEK293 and HeLa cells. As shown in Fig. 1, upon a long-term, low-concentration (10 ppb, up to 5 weeks) exposure to TCE, the global DNA methylation in HEK293 cells exhibited a significant reduction (>25%) from week 3 and a depletion of >40% was observed in week 5. A similar extent of DNA hypomethylation was also observed in HeLa cells (data not shown), validating the demethylation effects by TCE. However, in this study our aim was to investigate the prompt dissociation of Dnmt3a from DNA under TCE treatment, while a long-term exposure could trigger a number of other cellular responses, such as changes in metabolism and gene expression contributing to global DNA demethylation, which may not be necessary at this instant. Hence, we opted to establish a cell line with its endogenous Dnmt3a replaced by a constructed Dnmt3a–EGFP fusion protein. We applied a specific CRISPR/Cas9 system to knock out the endogenous Dnmt3a expression in HeLa cells followed by a rescue transfection with the Dnmt3a–EGFP plasmid (Fig. 2a). With these modified cells, we could conveniently monitor the intracellular Dnmt3a–EGFP by single-molecule fluorescence tools and correlate the observed fluctuation in DNA methylation with any altered Dnmt3a diffusion (Fig. 2b). In its enzymatic function, the Dnmt3a–EGFP well substituted the endogenous Dnmt3a because the loss of 5-methylcytosine (5mC) upon CRISPR/Cas9 knockout was regained after the rescue transfection (Fig. 2c). Further, we exposed these cells to a short-term, high-concentration TCE environment and still noted drastic global demethylation in a TCE dose-dependent manner (Fig. 2c and d). For instance, with 10 μg ml–1 of TCE, 40% of the global 5mC was depleted in 24 hours. Based on this set of data, we conclude that the demethylation potential of TCE can, at least partially, be ascribed to certain molecular events strongly impeding the DNA methylation activities. We hypothesize that a perturbation of the DNA methylation-related enzymes, including Dnmt3a, is involved.
Fig. 1. Induced DNA demethylation in HEK293 cells by chronic, low-concentration exposure to TCE (n = 3 independent replicates).
Fig. 2. Establishment of a cell model to probe Dnmt3a dynamics in single cells. (a) The endogenous Dnmt3a in HeLa cells was knocked out by the CRISPR/Cas9 system and replaced with the fusion protein Dnmt3a–EGFP. (b) Experimental design: the Dnmt3a–EGFP could rescue and restore the methylation profile in KO cells; however, aberrant DNA methylation would recur after exposure to TCE, which can be correlated with the altered Dnmt3a–EGFP dynamics, if any. (c) TCE concentration-dependent DNA demethylation in model cells was determined by immunoassay (n = 3 independent replicates). (d) Time-dependent DNA demethylation induced by TCE was also determined (n = 3 independent replicates).
Disruption of the Dnmt3a–DNA association by TCE
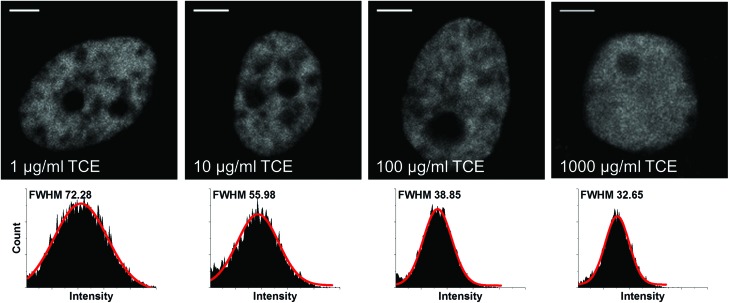
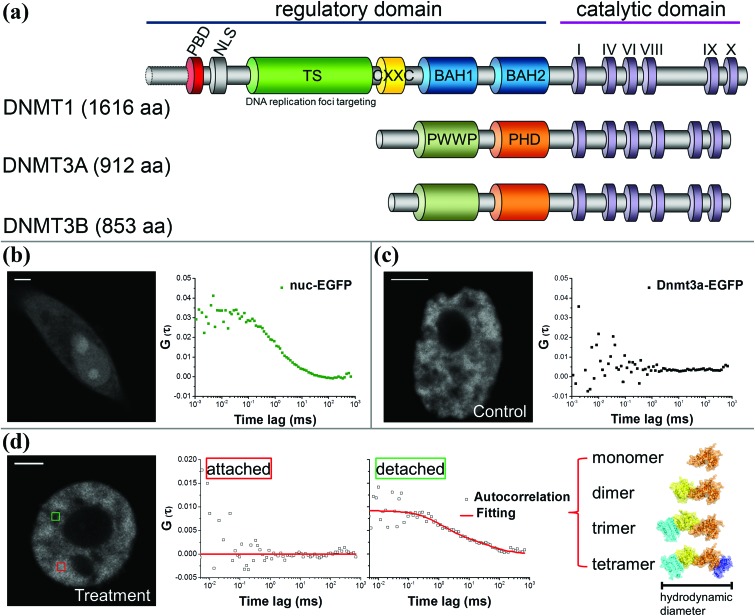
Since the endogenous Dnmt3a was replaced with the constructed Dnmt3a–EGFP in HeLa cells, we could readily monitor the real-time intracellular dynamics of Dnmt3a–EGFP during TCE exposure when any changes occurred. From fluorescence imaging, we initially observed that the distribution of Dnmt3a–EGFP experienced a fast transition from a fiber-like, localized pattern to a homogeneous pattern upon immediate exposure to a high-concentration of TCE (Fig. 3, upper panels). Collected from a single nucleus, the full width at half maximum (FWHM) of the fluorescence intensity histogram was found to become narrower in accordance (Fig. 3, lower panels), further indicating a more uniform distribution of the Dnmt3a–EGFP. Similarly, the redistribution pattern of Dnmt3a–EGFP was also observed in cells exposed to a low-concentration of TCE for several days (Fig. S1†). Dnmt proteins contain two major parts: the N-terminal regulatory domain and the C-terminal catalytic domain (Fig. 4a). For Dnmt3a, the N-terminal regulatory domain is composed of a PWWP motif and a PHD finger, which determines the localization preference to heterochromatin regions.22,23 To this end, we speculated that TCE could function to disrupt this loci-specific Dnmt3a–DNA interaction.
Fig. 3. Redistribution of localized, fiber-like Dnmt3a–EGFP due to TCE exposure revealed by confocal imaging (2 h exposure, scale bars: 5 μm). Histograms of pixel-based fluorescence intensity from single cell nucleus are provided (n = 10 cells).
Fig. 4. Single-molecule FCS for monitoring intracellular Dnmt3a–EGFP. (a) The protein size and major motifs of Dnmts. (b) The mobility of unbound nuc-EGFP molecules gives rise to a standard autocorrelation function, i.e., the diffusion curve. (c) In contrast, the firmly anchored Dnmt3a–EGFP exhibits undetectable diffusion within the FCS timescale. (d) Along with the TCE exposure, some nuclear regions generate a diffusion curve (green square), indicating the detachment of Dnmt3a–EGFP. Further, the stoichiometry of detached Dnmt3a–EGFP could be inferred from the hydrodynamic size by fitting the diffusion curve.
A single-molecule technique, FCS was used to characterize the dissociation of Dnmt3a–EGFP from its original binding sites on chromatin. FCS exploits the molecular mobility-caused fluorescence fluctuation in a confocal volume to derive a microsecond-to-millisecond level diffusion rate, which can be further correlated with the molecular hydrodynamic size. When the diffusion of molecules (e.g., an unbound EGFP in nucleus) is active, a rapid fluctuation of fluorescence intensity could effectively generate an autocorrelation function for biophysical modeling (Fig. 4b). In contrast, under physiological conditions the Dnmt3a–EGFP exhibited an undetectable diffusion by FCS (Fig. 4c), possibly due to the high compactness and limited movement of heterochromatin.24 However, upon exposure to TCE, along with the redistribution of Dnmt3a–EGFP, FCS yields a typical autocorrelation function from a number of measurements, implicating an in situ release of Dnmt3a–EGFP. Furthermore, by fitting the diffusion curves with a multi-component 3D diffusion model we can estimate the composition of the detached Dnmt3a–EGFP with distinct stoichiometry (Fig. 4d).
The stoichiometry-dependent Dnmt3a detachment under TCE treatment
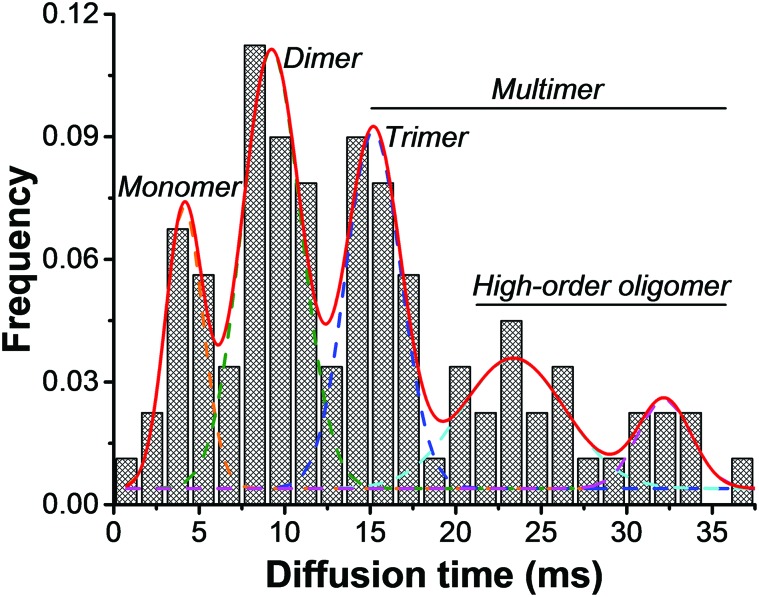
It has been found that Dnmt3a could form a large complex through self-oligomerization or association with Dnmt3L, and these oligomers play a role in the high-rate methylation.25–27 In this regard, we combined all the FCS measurements from detached Dnmt3a–EGFP in cells exposed to TCE and summarized the data as a histogram based on diffusion times (Fig. 5). It is clear that the intracellular Dnmt3a–EGFP exhibits several peaks of diffusion time, from which we can infer their predominant forms of stoichiometry. According to the Stokes–Einstein law of diffusion which states that the diffusion time obtained by FCS is negatively proportional to the molecular hydrodynamic size, we can categorize the existing forms of Dnmt3a–EGFP into three major groups: monomers, dimers, and multimers (including trimer, tetramer, and other Dnmt3a-involved protein complexes, see Fig. S3†). This is in excellent agreement with the previous structural biology-related studies and for the first time the stoichiometric information of Dnmt3a could be unambiguously observed in single living cells. Next, we extracted the total protein content from the cell lysates and determined that the ratio of monomer : dimer : multimer as approximately 1.6 : 1 : 1. More interestingly, we noted a stoichiometry-dependent Dnmt3a detachment when the cells were exposed to higher concentrations of TCE. As shown in Table 3, with a serial increase in the TCE dosage from 1 μg ml–1 to 1000 μg ml–1, we first detected a larger proportion of detached Dnmt3a–EGFP (from 34% to 70%); moreover, the detached dimers and multimers of Dnmt3a–EGFP continuously increased with the elevated dosage of TCE. However, the percentage of detached monomeric Dnmt3a–EGFP was maintained at ∼20% of the total Dnmt3a–EGFP, irrespective of the TCE concentration.
Fig. 5. Summary of all detected Dnmt3a–EGFP diffusion times by FCS measurements, corresponding to the stoichiometric states of Dnmt3a in living cells (n > 100 measurements from over 40 cells).
Table 3. Stoichiometry-dependent detachment of Dnmt3a–EGFP under TCE exposure. Detached% = (FCS measurements generating diffusion curves/total measurements) × 100%. Composition of detached components is calculated by fitting the diffusion curves with a multi-component 3D diffusion model. The percentage values presented in this table were weight-averaged by the obtained concentration information in each measurement.
| Conditions | Attached | Detached | Composition of detached components |
||
| Monomer | Dimer | Multimer | |||
| In vitro cell lysate | 0% | 100% | 45% | 28.2% | 26.8% |
| 1 μg per ml TCE | 66% | 34% | 17.6% | 9.8% | 6.6% |
| 10 μg per ml TCE | 48% | 52% | 18.1% | 14.9% | 19% |
| 100 μg per ml TCE | 37% | 63% | 20.5% | 19.3% | 23.2% |
| 1000 μg per ml TCE | 30% | 70% | 22.5% | 25% | 22.5% |
Impact of TCE on Tet expression and cancer-related miRNAs
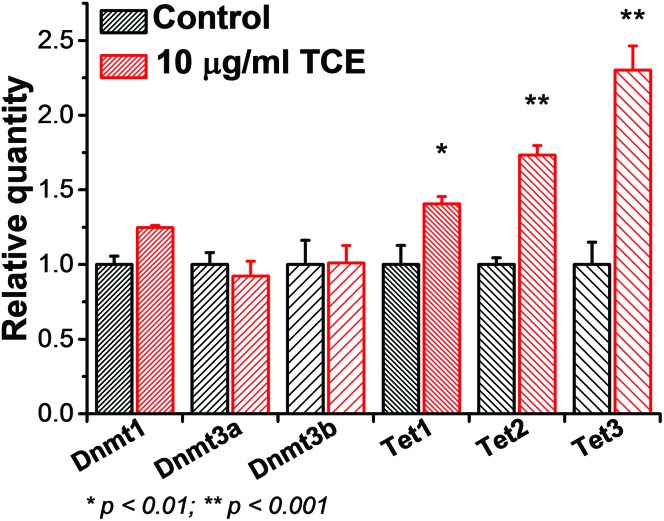
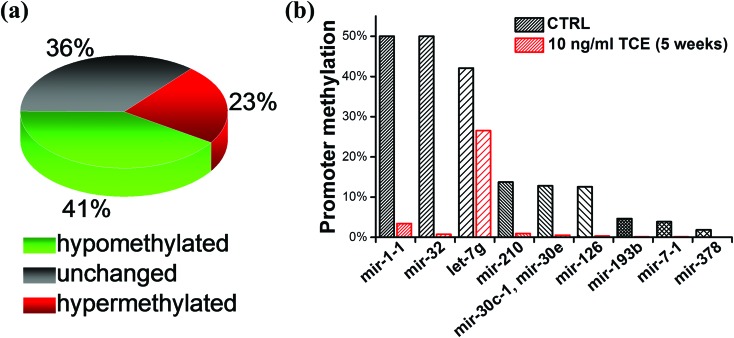
During the acute exposure to a relatively high-concentration of TCE (10 μg ml–1), we observed a drastic demethylation effect (over 70%) within 72 hours, which led to a speculation as to whether additional mechanisms might exist other than SAM depletion and Dnmt3a–DNA dissociation. Thereafter we assessed the expression of Tet and Dnmt enzymes involved in DNA methylation by qRT-PCR. We noted that all the three Tet enzymes experienced a significant increase at the transcriptional level whereas DNMTs did not undergo such a change in trend (Fig. 6), consistent with the recent report.28 Based on this line of results, we deduced that the strong demethylation effect by TCE was the outcome from a co-operation among the metabolic shift of cysteine, Dnmt detachment, and Tet reactivation. Considering the fact that Dnmt3a prefers to localize at heterochromatin from where the majority of non-coding RNAs are transcribed, we chose to screen the promoter methylation levels for a group of cancer-related miRNAs. A PCR-based assay was applied for a rapid determination of the percentage of methylated promoters in a certain amount of input DNA. It is evident that nearly half of the assessed miRNA genes in HEK293 cells exhibit hypomethylation after a chronic, low-dose TCE exposure (Fig. 7a), implying the occurrence of massive demethylation at heterochromatin. Representatives among these miRNAs include mir-1-1, mir-32, let-7g, mir-210, mir-30, and mir-126 (Fig. 7b).
Fig. 6. The transcriptional changes of Dnmts and Tets as cells respond to TCE (n = 4 independent replicates).
Fig. 7. Changes in the promoter methylation of the heterochromatin localized, cancer-related miRNAs. (a) The general trend of changes. (b) Representative miRNAs experienced promoter demethylation.
Discussion
To the best of our knowledge, we present the first toxicological study of TCE with a major focus on single-molecule epigenetics – more specifically, on the intracellular behavior of Dnmt3a. Although the demethylation effects by TCE have been frequently observed in different models, most studies attempt to approach this phenomenon from the perspective of altered cysteine metabolism. In this study, our methods and results provide a new angle to inspect the epigenetic toxicity of TCE, i.e., the forced detachment of Dnmt3a from its binding site. The mechanistic cause could be multifaceted. First, TCE and its metabolites can likely induce a conformational change in the DNA-binding motif of Dnmt3a, by reacting with the key residuals. Second, the oligomerization of Dnmt3a greatly depends on its hydrophobic core at the binding interface.26 TCE is pernicious to aromatic structures and therefore can disintegrate the Dnmt3a multimer by disrupting this hydrophobic interface. Third, TCE depletes the methyl donor SAM that may be required for initiating a firm Dnmt3a–DNA association. Fourth, the oxidative stress triggered by TCE will produce excessive reactive oxygen species (ROS) that are able to generate extensive DNA damage, especially at the DNA-enriched heterochromatin. Moreover, ROS is also destructive to histones and other chromatin associated factors. Taken together, we show that TCE can drastically undermine the heterochromatic structure for Dnmt3a to bind. In living cells, the real-time detachment of DNA-binding proteins can be inferred from an accelerated diffusion rate; however, this type of information is difficult to obtain by conventional methodologies. The single-molecule fluorescence techniques enable us to monitor intracellular molecules with resolution down to the millisecond level, thus providing a means for live-cell probing. Herein we successfully reveal the TCE-induced Dnmt3a–DNA dissociation, which might also be experienced by Dnmt3b and Dnmt1 considering their structural similarities, while the detailed mechanisms for Dnmt3a detachment await future elucidation.
From the literature we note that most Dnmt3a binds tightly to heterochromatin and nearly no free Dnmt3a/3b could exist in the nucleus,23,29 which explains why FCS cannot detect an active diffusion of the Dnmt3a–EGFP in our control cells. From the fluorescence images and single-molecule data, we further infer that Dnmt3a might function in a “cooperative DNA binding mode” to form protein–DNA fibers for more efficient methylation of target DNA,27,30 instead of in a “processive methylation mode”.26,31 Otherwise, FCS should have probed certain 2D or 3D mobility of the Dnmt3a–EGFP during its movement on the chromatin. The Dnmt3a oligomer has a quasi-linear structure and could span over a much larger area than the monomers, thus requiring multiple CpG dinucleotides as association substrates. At heterochromatic regions DNA is densely compacted, providing closely aligned binding sites for the Dnmt3a oligomers.32 This property demonstrates that a higher-order stoichiometry of Dnmt3a has a stronger preference to heterochromatin. Hence, under normal conditions the firmly anchored Dnmt3a possesses extremely limited mobility. When TCE is introduced into the cells, the fully detached Dnmt3a diffuses much like unbound proteins with a diffusion coefficient in the scale of some μm2 s–1. The release of Dnmt3a from heterochromatin leaves space for the invasion of Tet enzymes that experience transcriptional reactivation by TCE via some unknown mechanisms. Collectively, these events act in a cohort to facilitate a rapid, efficient removal of DNA methylation marks.
In the genome of human somatic cells, Dnnmt3a is preferably enriched in the non-coding regions where the majority of miRNAs are located. Following this clue, we screened a group of cancer-related miRNAs for their promoter methylation and found that nearly half of the targets experienced DNA demethylation upon exposure of the cells to TCE. Notably, even on heterochromatin, the Dnmt3a oligomers are not homogeneously distributed. The PWWP motif recognizes trimethylated lysine 36 at histone H3 (H3K36me3) while the PHD finger binds to unmodified H3K4. In this regard, the interaction between Dnmt3a and heterochromatin is subjected to the regional state of histone modifications, and this property could contribute to a distinct demethylation response for a specific miRNA after TCE exposure. The TCE-impacted miRNAs participate in a diverse set of cell functions and may have different roles in specific cancer types. For instance, mir-126 and mir-210 experience a TCE-induced demethylation and both of these are related to angiogenesis,33,34 which is important for cell proliferation and tumor progression. On the other hand, a subset of tumor suppressor miRNAs such as mir-1-1 and let-7g could be reactivated in parallel as a self-protective mechanism. This regulatory intricacy signifies the complex cellular responses to a certain toxicant, TCE in our study, and needs to be interpreted in a more context-dependent manner.35,36
Overall, our study presents a mechanistic understanding of the TCE toxicology and could be extended to explore the epigenetic effects of other environmental toxicants. We expect our findings from single-molecule fluorescence tools to provide a more comprehensive insight into the highly dynamic events within a micron-sized cell. Admittedly, even today the full picture of TCE metabolism in human body is considerably unclear: conventional in vivo experiments are more focused on the TCE-induced phenotypic changes that heavily depend on the metabolism by cytochrome P450 (CYP) enzymes in liver cells while the GSH-involved epigenetic alteration is hard to be separated for investigations.37 By conducting our experiments in cells with relatively less CYP activities, acute TCE exposure elicits a more substantial DNA demethylation rather than a rapid cell death, which implies the transforming potential of TCE to the directly exposed tissues (e.g., skin and respiratory epithelium) even without the need for entering the hepatic circulation. Nevertheless, we cannot overlook some CYP-catalyzed TCE metabolites that may also cause certain epigenetic aberrations. In this report the discovered aberration of Dnmt3a–DNA interaction upon TCE exposure fills a critical gap between the micro-scale molecular etiology and the macro-scale phenotypic pathology, as well as offers additional avenues for designing better intervention strategies.
Conclusion
We expound on an unreported mechanism accounting for the epigenetic toxicity of TCE by monitoring the dynamics of Dnmt3a at single-molecule resolution in live cells. Although the toxic impact of TCE has been extensively observed, the relevant molecular aberrations in the epigenetic realm have been less explored due to the complex involvement of TCE in a myriad of intracellular activities. Herein our work attempts to elucidate the TCE-induced DNA hypomethylation by measuring the diminished Dnmt3a–DNA association with advanced single-molecule fluorescence tools. In living cells, the real-time detachment of DNA-binding proteins can be inferred from an accelerated diffusion rate; however, this type of information is inaccessible by conventional methodologies. Single-molecule FCS enables us to monitor the dynamics of intracellular molecules with resolution down to the millisecond level in a femtoliter volume, providing the means to evaluate the free/bound state of Dnmt3a at the single-cell resolution. From our experiments, we not only demonstrate that TCE can significantly detach Dnmt3a from heterochromatin but also note that the different stoichiometric forms of Dnmt3a respond variedly to this TCE-induced dissociation.
We further characterize several intracellular behaviors regarding the function of Dnmt3a. For instance, for the first time we have observed the oligomeric forms of Dnmt3a in living cells, which previously was only suggested by in vitro structural analysis or inferred from ensemble biochemistry experiments. Moreover, our results on the Dnmt3a diffusion supports the idea that Dnmt3a acts in a “cooperative DNA-binding mode” to form static protein–DNA fibers for achieving a high rate of DNA methylation instead of a dynamic “processive methylation mode”, which has been a long-unsolved question. Last but not least, we show that the detachment of Dnmt3a upon cell exposure to TCE could reactivate a number of heterochromatin located, cancer-related miRNAs, providing us with new knowledge on the carcinogenic effects of TCE.
Supplementary Material
Acknowledgments
The authors thank Dr Humaira Gowher for insightful discussions. We thank Anwesha Sanyal for providing the HEK293 cells, and Dr Meng Deng's lab (Purdue University) for the help in the EVOS imaging system. This work was supported in part by the W. M. Keck Foundation, the Purdue Center for Cancer Research (P30CA023168), and the office of EVPRP at Purdue University.
Footnotes
†Electronic supplementary information (ESI) available. See DOI: 10.1039/c5tx00454c
References
- EPA, Toxicological review of trichloroethylene. CAS No 79-01-6, http://www2.epa.gov/iris.
- Agency for toxic substances and disease registry (ATSDR): Toxicological profile for trichloroethylene, http://www.atsdr.cdc.gov/toxprofiles/tp.asp?id=173&tid=30. [PubMed]
- Cooney C. A., in Trichloroethylene: Toxicity and Health Risks, Springer, 2014, pp. 185–208. [Google Scholar]
- Mosharov E., Cranford M. R., Banerjee R. Biochemistry. 2000;39:13005–13011. doi: 10.1021/bi001088w. [DOI] [PubMed] [Google Scholar]
- Vitvitsky V., Thomas M., Ghorpade A. J. Biol. Chem. 2006;281:35785–35793. doi: 10.1074/jbc.M602799200. [DOI] [PubMed] [Google Scholar]
- Pereira M. A., Wang W., Kramer P. M., Tao L. Toxicol. Sci. 2004;77:243–248. doi: 10.1093/toxsci/kfh031. [DOI] [PubMed] [Google Scholar]
- Melnyk S., Fuchs G. J., Schulz E. J. Autism Dev. Disord. 2012;42:367–377. doi: 10.1007/s10803-011-1260-7. [DOI] [PMC free article] [PubMed] [Google Scholar]
- Blossom S. J., Melnyk S., Cooney C. A. Neurotoxicology. 2012;33:1518–1527. doi: 10.1016/j.neuro.2012.02.017. [DOI] [PMC free article] [PubMed] [Google Scholar]
- Blossom S. J., Cooney C. A., Melnyk S. B. Toxicol. Appl. Pharmacol. 2013;269:263–269. doi: 10.1016/j.taap.2013.03.025. [DOI] [PMC free article] [PubMed] [Google Scholar]
- Banerjee S., Van Duuren B. L. Cancer Res. 1978;38:776–780. [PubMed] [Google Scholar]
- Kautiainen A., Vogel J. S., Turteltaub K. W. Chem.–Biol. Interact. 1997;106:109–121. doi: 10.1016/s0009-2797(97)00061-6. [DOI] [PubMed] [Google Scholar]
- Cai H., Guengerich F. P. Chem. Res. Toxicol. 2001;14:54–61. doi: 10.1021/tx000185n. [DOI] [PubMed] [Google Scholar]
- Zhang H., Hong W. X., Ye J. Biochem. Biophys. Res. Commun. 2014;446:590–595. doi: 10.1016/j.bbrc.2014.03.015. [DOI] [PubMed] [Google Scholar]
- Cui Y., Irudayaraj J. Wiley Interdiscip. Rev.: Nanomed. Nanobiotechnol. 2015;7:387–407. doi: 10.1002/wnan.1321. [DOI] [PMC free article] [PubMed] [Google Scholar]
- Chen J., Irudayaraj J. ACS Nano. 2009;3:4071–4079. doi: 10.1021/nn900743v. [DOI] [PubMed] [Google Scholar]
- Chen J., Irudayaraj J. Anal. Chem. 2010;82:6415–6421. doi: 10.1021/ac101236t. [DOI] [PubMed] [Google Scholar]
- Chen J., Nag S., Vidi P. A., Irudayaraj J. PLoS One. 2011;6:e17991. doi: 10.1371/journal.pone.0017991. [DOI] [PMC free article] [PubMed] [Google Scholar]
- Cui Y., Cho I. H., Chowdhury B., Irudayaraj J. Epigenetics. 2013;8:1089–1100. doi: 10.4161/epi.25958. [DOI] [PMC free article] [PubMed] [Google Scholar]
- Cui Y., Irudayaraj J. Nucleic Acids Res. 2015;43:3046–3055. doi: 10.1093/nar/gkv098. [DOI] [PMC free article] [PubMed] [Google Scholar]
- Magde D., Webb W. W., Elson E. Phys. Rev. Lett. 1972;29:705–708. [Google Scholar]
- Haustein E., Schwille P. Annu. Rev. Biophys. Biomol. Struct. 2007;36:151–169. doi: 10.1146/annurev.biophys.36.040306.132612. [DOI] [PubMed] [Google Scholar]
- Bachman K. E., Rountree M. R., Baylin S. B. J. Biol. Chem. 2001;276:32282–32287. doi: 10.1074/jbc.M104661200. [DOI] [PubMed] [Google Scholar]
- Chen T., Tsujimoto N., Li E. Mol. Cell. Biol. 2004;24:9048–9058. doi: 10.1128/MCB.24.20.9048-9058.2004. [DOI] [PMC free article] [PubMed] [Google Scholar]
- Bancaud A., Huet S., Daigle N. EMBO J. 2009;28:3785–3798. doi: 10.1038/emboj.2009.340. [DOI] [PMC free article] [PubMed] [Google Scholar]
- Jia D., Jurkowska R. Z., Zhang X. Nature. 2007;449:248–251. doi: 10.1038/nature06146. [DOI] [PMC free article] [PubMed] [Google Scholar]
- Holz-Schietinger C., Matje D. M., Harrison M. F., Reich N. O. J. Biol. Chem. 2011;286:41479–41488. doi: 10.1074/jbc.M111.284687. [DOI] [PMC free article] [PubMed] [Google Scholar]
- Rajavelu A., Jurkowska R. Z., Fritz J., Jeltsch A. Nucleic Acids Res. 2012;40:569–580. doi: 10.1093/nar/gkr753. [DOI] [PMC free article] [PubMed] [Google Scholar]
- Gilbert K. M., Woodruff W., Blossom S. J. Autoimmune Dis. 2014;2014:982073. doi: 10.1155/2014/982073. [DOI] [PMC free article] [PubMed] [Google Scholar]
- Jeong S., Liang G., Sharma S. Mol. Cell. Biol. 2009;29:5366–5376. doi: 10.1128/MCB.00484-09. [DOI] [PMC free article] [PubMed] [Google Scholar]
- Emperle M., Rajavelu A., Reinhardt R. J. Biol. Chem. 2014;289:29602–29613. doi: 10.1074/jbc.M114.572032. [DOI] [PMC free article] [PubMed] [Google Scholar]
- Holz-Schietinger C., Matje D. M., Reich N. O. J. Biol. Chem. 2012;287:30941–30951. doi: 10.1074/jbc.M112.366625. [DOI] [PMC free article] [PubMed] [Google Scholar]
- Jurkowska R. Z., Rajavelu A., Anspach N. J. Biol. Chem. 2011;286:24200–24207. doi: 10.1074/jbc.M111.254987. [DOI] [PMC free article] [PubMed] [Google Scholar]
- Wang S., Aurora A. B., Johnson B. A. Dev. Cell. 2008;15:261–271. doi: 10.1016/j.devcel.2008.07.002. [DOI] [PMC free article] [PubMed] [Google Scholar]
- Hu S., Huang M., Li Z. Circulation. 2010;122:S124–S131. doi: 10.1161/CIRCULATIONAHA.109.928424. [DOI] [PMC free article] [PubMed] [Google Scholar]
- Chiu W. A., Jinot J., Scott C. S. Environ. Health Perspect. 2013;121:303–311. doi: 10.1289/ehp.1205879. [DOI] [PMC free article] [PubMed] [Google Scholar]
- Rusyn I., Chiu W. A., Lash L. H. Pharmacol. Ther. 2014;141:55–68. doi: 10.1016/j.pharmthera.2013.08.004. [DOI] [PMC free article] [PubMed] [Google Scholar]
- Lash L. H., Fisher J. W., Lipscomb J. C., Parker J. C. Environ. Health Perspect. 2000;108(Suppl 2):177–200. doi: 10.1289/ehp.00108s2177. [DOI] [PMC free article] [PubMed] [Google Scholar]
Associated Data
This section collects any data citations, data availability statements, or supplementary materials included in this article.


