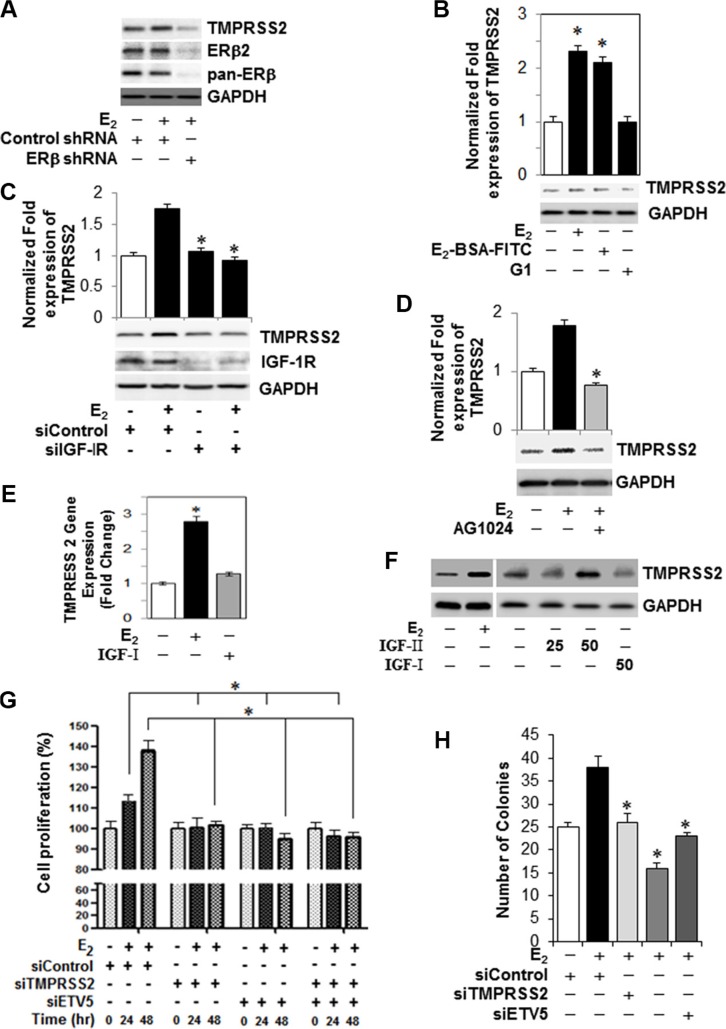
Figure 4. TMPRSS2, ETVs and TMPRSS2:ETV5 gene fusions are involved in an IGF-1R-dependent growth stimulatory effect of E2-ERβ2 axis in PC-3 cells.
(A) PC-3 cells were subjected to ERβ knockdown with shRNA, and then treated with 10 nM E2 for 24 hours. Protein extracts were subjected to immunoblot analysis with antibodies against TMPRSS2, ERβ, ERβ2, or GAPDH. (B) PC-3 cells were incubated with 10 nM E2, 10 nM E2-BSA-FITC, or 10 nM of G-1, an agonist of the G protein-coupled estrogen receptor-1 (GPER-1) for 12 hours and TMPRSS2 and GAPDH mRNAs and protein levels were quantified by qRT-PCR (upper panel) and immunoblot analysis (lower panel). (C) Protein levels of TMPRSS2, IGF-1R or GAPDH were measured by Western blot in PC-3 cells transiently transfected with siRNA targeting IGF-IR siRNA or non-targeting control siRNA and then treated vehicle or 10 nM E2 for 24 hours. (D) Assessment of TMPRSS2 protein expression in PC-3 cells treated with 10 nM E2 in presence or absence of 5 μM of an IGF-1R inhibitor (AG1024). GAPDH protein expression was used as loading control. (E, F) TMPRSS2 transcripts quantified by qRT-PCR (E) and protein levels (F) as measured by Western blot analysis relative to their respective controls in PC-3 cells treated with vehicle, 10 nM E2, 25 ng and 50 ng IGF-I or 50 ng IGF-II for 24 hours. (G) PC-3 cells were transiently transfected with non-targeting control siRNA or siRNAs targeting TMPRSS2, ETV5 or both and then treated with vehicle or 10 nM E2 for 0, 24 or 48 hr. Cell proliferation was assessed by Cell Counting Kit-8. Data represent Mean ± SEM in triplicates. (H) Colony formation assay by PC-3 cells transiently transfected with non-targeting control siRNA or siRNAs targeting TMPRSS2, ETV5 or both and then treated with vehicle or 10 nM E2. Bar graphs represent mean ± SEM values in triplicates. * denotes significant difference compared to controls at P < 0.05 (n = 3).

