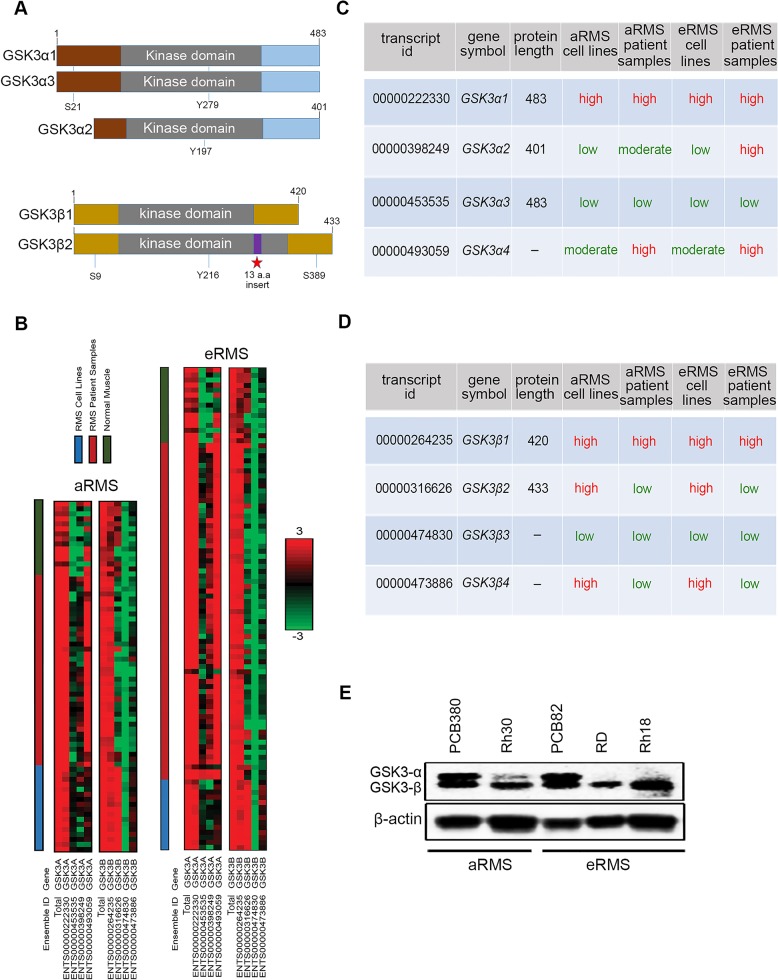
Figure 1. GSK3α and GSK3β expression in RMS cell lines, patient samples, and normal muscle.
(A) Schematic representation of full length GSK3α1/α2/α3 and GSK3β1/β2 showing their catalytic domain (kinase), sites of serine (S) and tyrosine (Y) phosphorylation. (B) RNA sequencing was performed on 31 RMS cell lines, 105 RMS patient samples, and 19 normal muscle tissue samples and the resulting Log2-scaled RPKM values for 4 isoforms of GSK3α and GSK3β are shown. Different sample types (RMS cell line, RMS patient sample, normal muscle) are indicated by the color-coded bars at the top of the figure. The heat scale is given on the side, ranging from green (low expression; RPPKM = −3), to black (RPKM = 0), to red (high expression; RPKM=3).(C & D) Table showing the different spliced variant of GSK3α and GSK3β with their respective ensemble ID, gene symbol, protein length (a.a) and their expression across, aRMS, eRMS patient samples and cell lines (color code matching heat map above). (E) Western blotting showing pattern of GSK3 α/β expression across aRMS, eRMS, or primary tissue versus cell line samples. GSK3α and GSK3β have molecular weight of 51 and 47 KDa.

