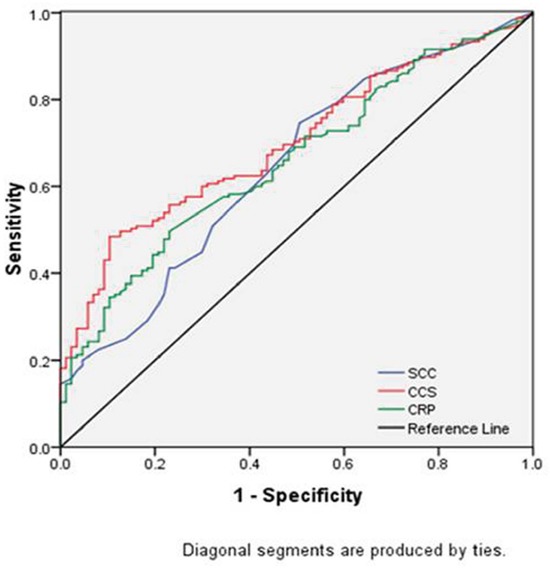
Figure 3. ROC curves for CSS prediction.

The AUC was 0.699 (95% CI: 0.635-0.763, P <0.001) for CCS, 0.659 (95% CI: 0.591-0.727, P <0.001) for CRP and 0.645 (95% CI: 0.574-0.716, P <0.001) for SCC, respectively.

The AUC was 0.699 (95% CI: 0.635-0.763, P <0.001) for CCS, 0.659 (95% CI: 0.591-0.727, P <0.001) for CRP and 0.645 (95% CI: 0.574-0.716, P <0.001) for SCC, respectively.