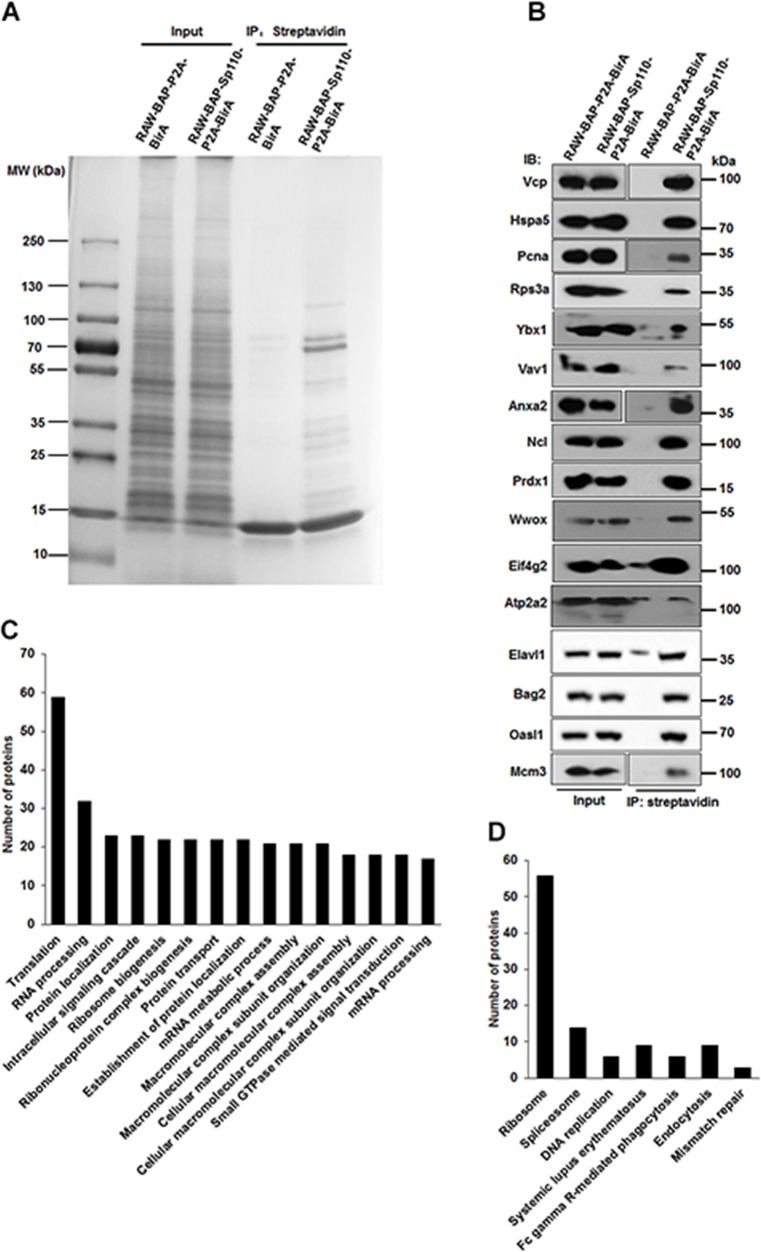
Figure 2. Characterization of the Sp110 protein interactome by affinity purification and mass spectrometry.
(A) Separation of the affinity-purified Sp110 protein complexes using SDS-PAGE followed by Coomassie staining. Data are representative of four experiments. (B) Validation of the interactions between Sp110 and identified Sp110-interacting proteins. IP was performed using streptavidin-conjugated agarose resin. The presence of the Sp110 protein partner was detected by immunoblotting using specific antibodies. Data are representative of three experiments. (C) GO annotation of Sp110-interacting proteins. The top 15 GO terms (biological process) ranked according to the protein counts are plotted. (D) KEGG pathway analysis of Sp110-interacting proteins.

