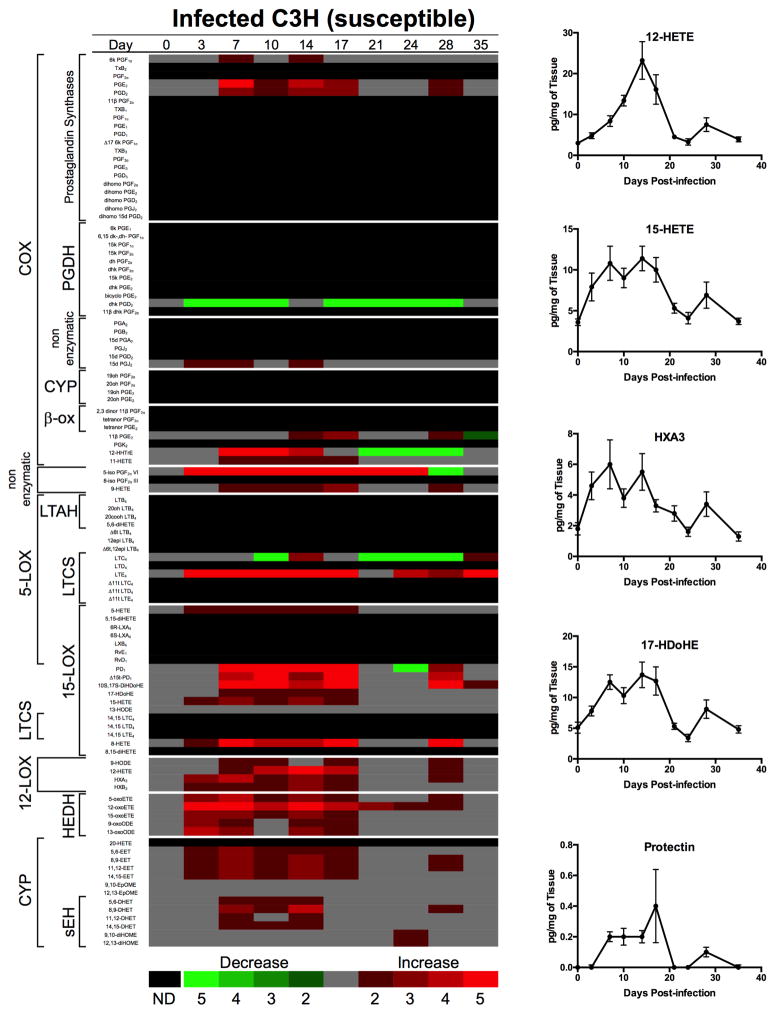
Figure 3. Lipidomic profiling of temporal changes in eicosanoids and other related bioactive lipid biosynthetic pathways.
Heat map depicting fold changes in lipid mediators from B. burgdorferi-infected joints compared to uninfected (day 0). In addition, joint levels of selected lipid mediators are shown over time for n = 8–10 mice per time point. Figure was adapted with permission from [15].

