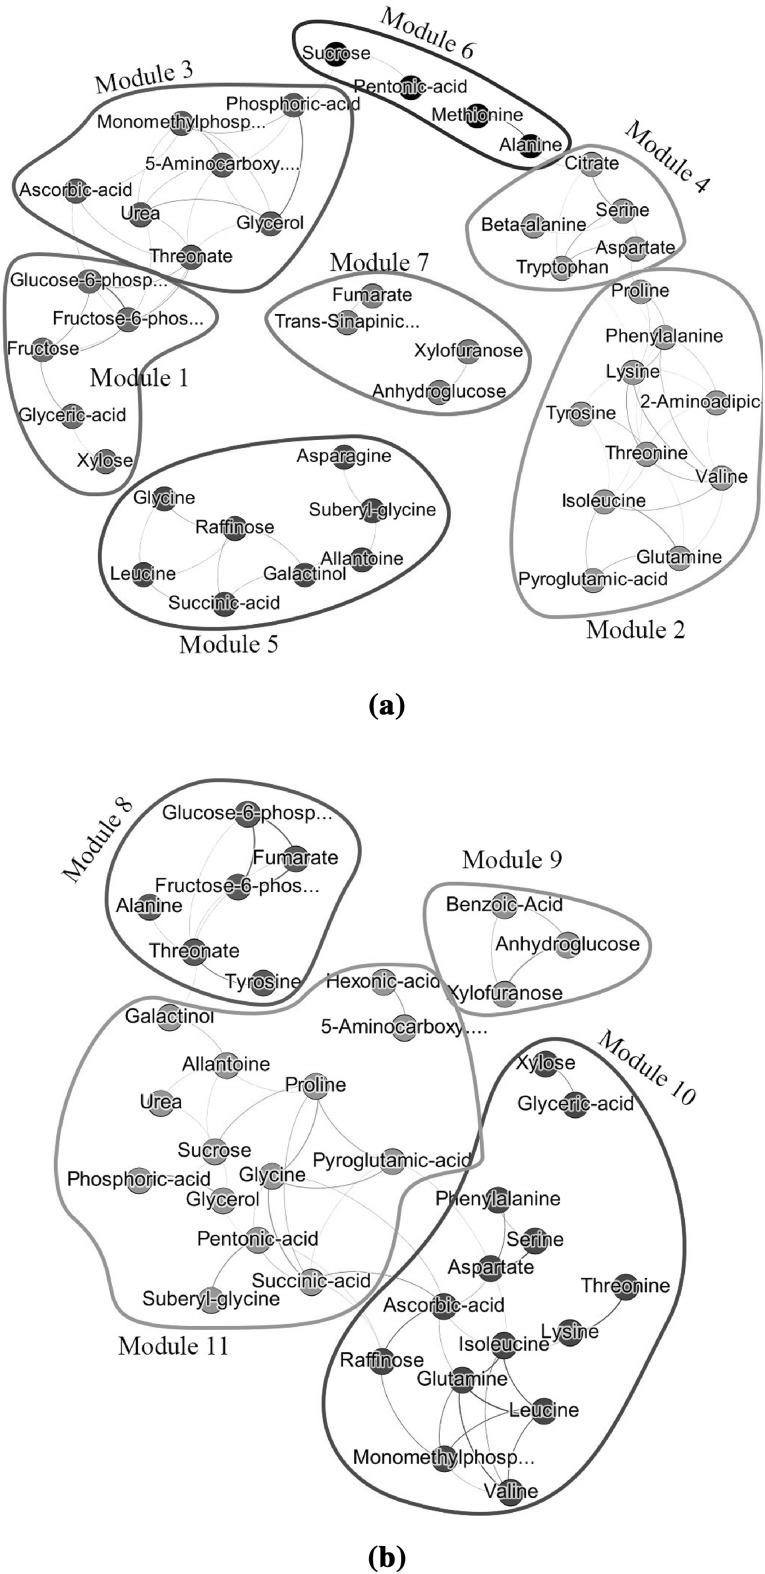
Fig. 3.
Sparse plant metabolite networks estimated by WGCNA with a the original metabolite values and b the Genotype related metabolite values. Modules have been color coded as indicated by column “Color Coded” in Table 2 in their corresponding network ( or ). Colors have been selected by the two-step dynamic hybrid algorithm implemented in the R-package WGCNA

