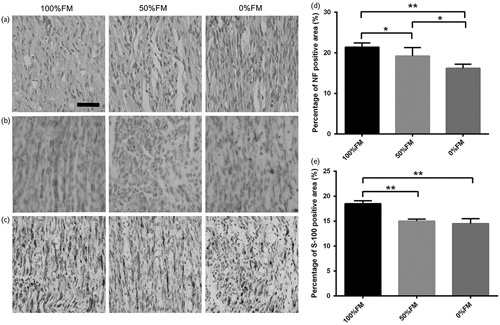
Fig. 4.

Histological and immunohistochemical analysis of the three groups at 6 weeks after surgery. (a) The longitudinal sections of the distal part after H&E staining. (b) NF-200 antibody immunostaining of longitudinal sections. (c) S-100 Schwann cell marker immunostained longitudinal sections. (d) NF-200 statistical analysis of the three groups. (e) S-100 statistical analysis of the three groups. There were significant increases in the numbers of positively stained neurofilaments and S-100-positive areas for the 100%FM and 0%FM groups. Error bars correspond to the mean±SD (n=6 for each groups). *P<0.05, **P<0.01. Scale bar=50 µm. FM, fascicle matching.
