Abstract
Activation of the JAK-STAT signaling has been implicated in the pathogenesis of diabetic kidney disease. An increased expression of JAK-STAT genes was found in kidney glomerular cells, including podocytes, in patients with early diabetic kidney disease. However, it is not known whether increased expression of JAK or STAT isoforms in glomerular cells can lead to worsening nephropathy in the setting of diabetes. Therefore, we overexpressed JAK2 mRNA specifically in glomerular podocytes of 129S6 mice to determine whether this change alone could worsen diabetic kidney disease. A 2–3 fold increase in glomerular JAK2 expression, an increase similar to that found in humans with early diabetic kidney disease, led to substantial and statistically significant increases in albuminuria, mesangial expansion, glomerulosclerosis, glomerular fibronectin accumulation, and glomerular basement membrane thickening, and a significant reduction in podocyte density in diabetic mice. Treatment with a specific JAK1/2 inhibitor for 2 weeks partly reversed the major phenotypic changes of diabetic kidney disease and specifically normalized expression of a number of downstream STAT3-dependent genes implicated in diabetic kidney disease progression. Thus, moderate increases in podocyte JAK2 expression at levels similar to those in patients with early diabetic kidney disease can lead directly to phenotypic and other alterations of progressive diabetic glomerulopathy. Hence, inhibition of these changes by treatment with a JAK1/2 inhibitor suggests that such treatment may help retard progression of early diabetic kidney disease in patients.
Keywords: Diabetic nephropathy, cell signaling, podocyte, inflammation
Introduction
DKD is the most common cause of end-stage renal disease in the United States and in most other countries today 1. Its incidence continues to increase dramatically despite some slowing in the rate of DKD progression to kidney failure 1. In spite of the unquestionable salutary impact of blood pressure control and pharmacologic inhibition of the renin-angiotensin-aldosterone system, additional powerful interventions are needed in order to make any real headway in the fight against progression of DKD. One of the roadblocks in developing such interventions has been the lack of availability of a small animal model of DKD that fully recapitulates the disease in humans 2. Our group has taken the tack of comparing transcriptomic profiles of humans with progressive DKD to those of mouse DKD models to determine both similarities 3 and differences 4 in these expression patterns as both could give clues to pathways important in the pathogenesis of human DKD. One striking difference between human and mouse gene expression profiles is in the enhanced expression of Janus Kinase-Signal Transducer and Activator of Transcription (JAK-STAT) family members in humans with early and progressive DKD that are not recapitulated in current mouse models 3, 4. This increase in JAK-STAT gene expression in human DKD suggested that this pathway might be important in the more robust kidney disease that humans experience compared to that in mouse models.
JAK-STAT proteins transduce signals from many different types of non-tyrosine kinase plasma membrane receptors, including many cytokine and chemokine receptors 5 whereby JAK-STAT activation transmits inflammation signals. We found that JAK1, 2 and 3 as well as STAT1 and STAT3 were expressed at levels in diabetic kidney that were several-fold higher than those in normal subjects 4. The pattern of this increased expression was revealing. In subjects with early DKD, with low levels of albuminuria and normal kidney function, the increases in JAK-STAT expression were confined to glomerular cells, including podocytes. In subjects with progressive DKD and reduction in kidney function, the increases in JAK-STAT expression were mainly in tubulointersitital cells 4. The apparently sustained and chronic elevation of JAK-STAT mRNA and protein expression first in glomeruli and subsequently in cortical tubulointerstitium in humans with DKD corresponds well with the natural progression of the disease which initially damages glomeruli and subsequently, tubulointerstitial tissues4. These findings suggested that the increases in JAK-STAT expression in glomeruli might help drive the severity and progression of early DKD. Therefore, we determined the effect of one of the early DKD changes, namely the increase in podocyte JAK2 expression, on DKD severity by overexpressing JAK2 specifically in podocytes in a mouse DKD model,.
Results
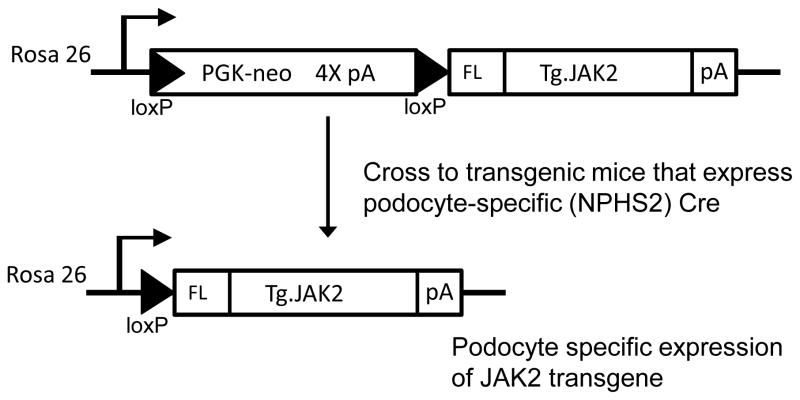
In order to generate cell-type-specific enhanced JAK2 expression, a loxP-stop-loxP mouse JAK2 construct was inserted into the ROSA26 gene locus using the pBigT/pROSA26PA targeting system 6. We then generated mice with cell-type-specific overexpression of the Jak2 transgene by crossing the mice with tissue-specific Cre recombinase mice. (Fig. 1). Because of the moderately enhanced sensitivity of the 129S6 mouse strain to DKD compared to C57BL/6 mice 7, the targeted mutation was bred onto this background and NPHS2 (podocin) Cre mice 8 were also established on the same background by a marker-assisted speed congenic strategy.
Figure 1.
Podocyte-specific JAK2 trangene strategy. A loxP-stop-loxP JAK2 construct was inserted into the ROSA26 gene locus using the pBigT/pROSA26PA targeting system and electrodporated into W4 mouse ES cells derived from 129S6 mice. A gene targeted ES cell clone was established and used to produce germline transmitting ES cell-mouse chimeras. Mice carrying the loxP-stop-loxP JAK2 allele were then bred to podocin (NPHS2) Cre mice on a 129S6 background. Podocyte-specific Cre recombinase then excised the floxed stop cassette containing the quadruplicate polyadenylation sequence (4X pA) resulting in transcription of the recombinant JAK2 cDNA driven by the endogenous ROSA26 promoter.
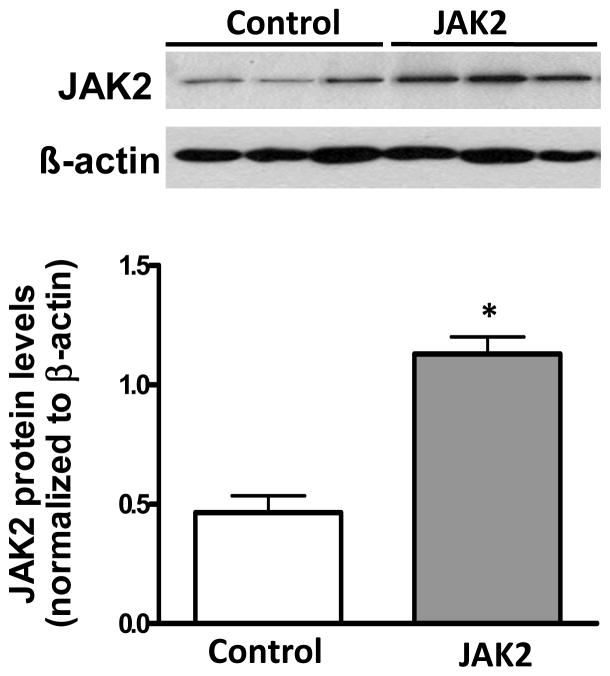
Podocyte specific JAK2 expression was confirmed in male Jak2loxP/loxP NPHS2Cre/+ (podocyte JAK2) mice by JAK2 immunoblotting of glomerular lysates from the homozygote podocyte JAK2 mice as well as the Jak loxP/loxP control mice. While this experiment did not prove that JAK2 expression was increased only in podocytes, NPHS2Cre/+ mice have been demonstrated previously to be completely specific for podocyte expression in previous publications 8. Glomerular JAK2 expression was two to three-fold greater in the podocyte JAK2 mice than in the control mice (Fig. 2), an increase that was similar to that found in glomeruli from humans with early DKD compared to living kidney transplant donors 4. Podocyte JAK2 mice were born at predicted ratios in litters of normal size. They appeared normal and had no baseline albuminuria, mesangial expansion or other phenotypic or morphological differences from the floxed mouse controls or from wild-type mice (Table 1).
Figure 2.
Glomerular JAK2 expression. Specific and significant overexpression of JAK2 was confirmed in glomeruli isolated from podoctye JAK2 mice as shown in the immunoblot (A) and quantified in the bar graph (B). N = 3 for each group, *p < 0.05.
Table 1.
Physiological data.
| Control | Control diabetic | JAK2 | JAK2 diabetic | |||||
|---|---|---|---|---|---|---|---|---|
|
| ||||||||
| 0 week | 4 week | 0 week | 4week | 0 week | 4week | 0 week | 4week | |
| BW (g) | 24.8 ± 0.5 (9) | 25.9 ± 0.6 (9) | 22.0 ± 0.5 (8) | 22.6 ± 0.5 (8)* | 25.5 ± 0.8 (9) | 25.5 ± 0.2 (9) | 22.0 ± 0.2 (8) | 21.8 ± 0.6 (8)≠ |
| FBG (mg/dL) | 143.9 ± 4.0 (9) | 147.2 ± 6.3 (9) | 607.4 ±27.3 (8) | 616.1 ±24.9 (8)* | 144.1 ± 5.1 (9) | 120.9 ± 9.9 (9) | 583.3 ±12.7 (8) | 556.4 ±22.6 (8)≠ |
| SBP (mmHg) | 93.0 ± 4.6 (5) | 143.9 ± 4.6 (9) | 90.02 ± 2.9 (5) | 144.0 ± 1.5 (8) | 94.4 ± 3.23 (5) | 143.1 ± 9.4 (9) | 93.6 ± 2.6 (5) | 139.5 ± 5.7 (8) |
| GHb (%) | 4.6 ± 0.1 (9) | 11.2 ± 0.3 (8)*≠ | 4.7 ± 0.1 (9) | 10.5 ± 0.2 (8)*≠ | ||||
| KW (g) | 0.21 ± 0.01 (9) | 0.23 ± 0.01 (8)*≠ | 0.20 ± 0.01 (9) | 0.27 ± 0.02 (8)*≠ | ||||
| KW/BW (mg/g) | 8.0 ± 0.5 (9) | 10.4 ± 0.4 (8)*≠ | 8.0 ± 0.2 (9) | 12.3 ± 0.6 (8)*≠ # | ||||
| HDL (mg/dL) | 69.0 ± 5.9 (9) | 104.6 ± 8.2 (8)*≠ | 74.0 ± 2.6 (9) | 121.9 ± 9.5 (8)*≠ | ||||
| Tot. Chol. (mg/dL) | 108.8 ± 1.7 (9) | 176.5 ±17.6(8)*≠ | 112.4 ± 2.7 (9) | 198.6 ± 25.7 (8)*≠ | ||||
| Pl. Creat. (mg/dL) | 0.090 ± 0.007 (5) | 0.138 ± 0.009 (5)*≠ | 0.076 ± 0.010 (5) | 0.123 ± 0.005 (7)*≠ | ||||
Abbreviations: BW – body weight, FBG – fasting blood glucose, GHb – glycated hemoglobin, SBP – systolic blood pressure, KW – left kidney weight, KW/BW – left kidney weight/body weight, Tot. Chol. – total cholesterol, Pl. Creat. – plasma creatinine.
Data are presented as means ± SEM with total number of animals in parentheses.
vs. Control,
vs. JAK2,
vs. Control diabetic, p< 0.05.
All 4 wk SBP values were significantly different (p<0.05) than the respective 0 wk values. There were no significant differences between SBP at 0 and 4 wks in any of the groups.
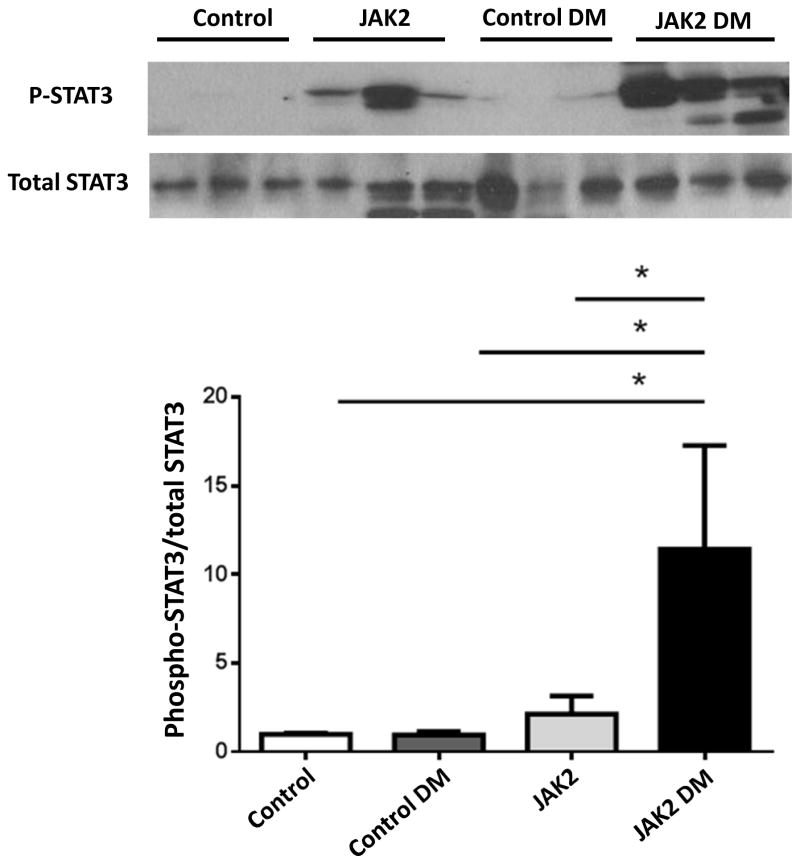
To determine whether the podocyte JAK2 mice developed a greater degree of DKD than control mice, both were bred to Ins2 Akita/+ (Akita) mice on the same 129S6 genetic background. Four groups of male mice were used for the remainder of the studies in this report: non-diabetic control (control), Akita diabetic control (control diabetic), non-diabetic podocyte JAK2 (JAK2) and Akita diabetic podocyte JAK2 mice (JAK2 diabetic). To accelerate pathologic changes, all 4 groups were implanted with subcutaneous minipumps that provided a daily dose of angiotensin (Ang) II for a total of 4 weeks. At the end of the 4-week Ang II infusion, all groups developed similarly elevated blood pressures (Table 1), and the 2 diabetic groups had similar degrees of hyperglycemia as well as other baseline characteristics (Table 1). Kidney weights were significantly greater in the diabetic mice compared with non-diabetic controls, and were greater in the JAK2 diabetic mice than in the control diabetic mice (Table 1). Glomerular STAT3 phosphorylation was assessed as a marker of JAK2 activation in the 4 groups. STAT3 phosphorylation was increased moderately in the JAK2 glomeruli but much more so in the JAK2 diabetic glomeruli (Fig. 3).
Figure 3.
Glomerular STAT3 phosphorylation. Podocyte specific overexpression of JAK2 resulted in a moderate increase in STAT3 phosphorylation in non-diabetic mice (JAK2) compared to control mice with a much more substantial increase seen in JAK2 diabetic (DM) glomeruli compared to the other 3 groups including control diabetic mice, as shown in a representative immunoblot (top) and quantified in bar graph (bottom). N = 3 for each group, *p < 0.05.
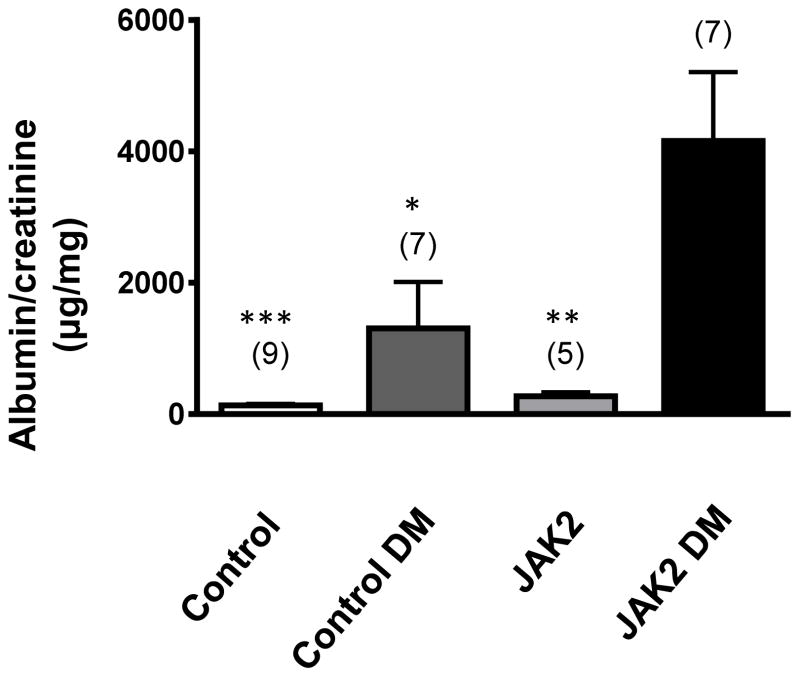
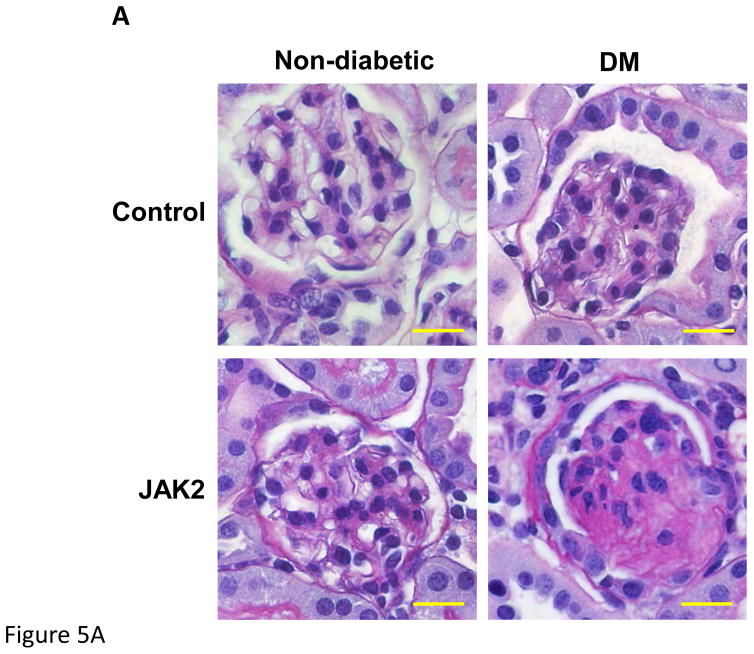
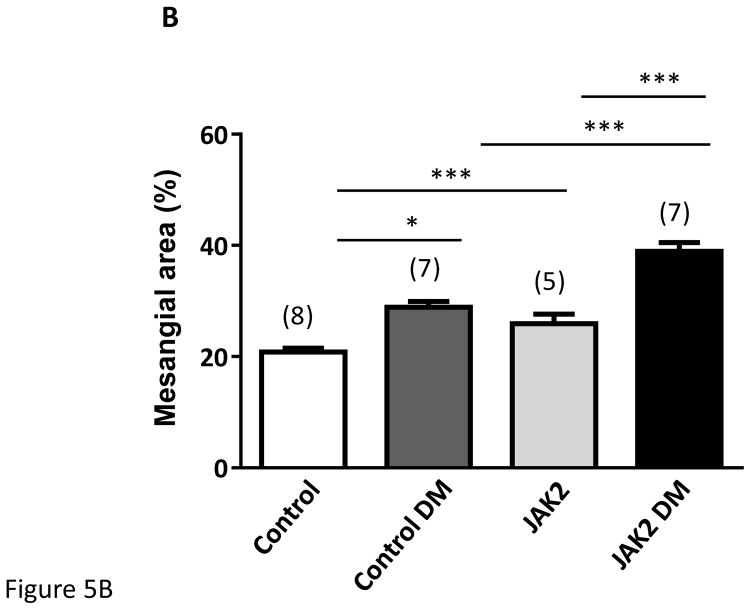
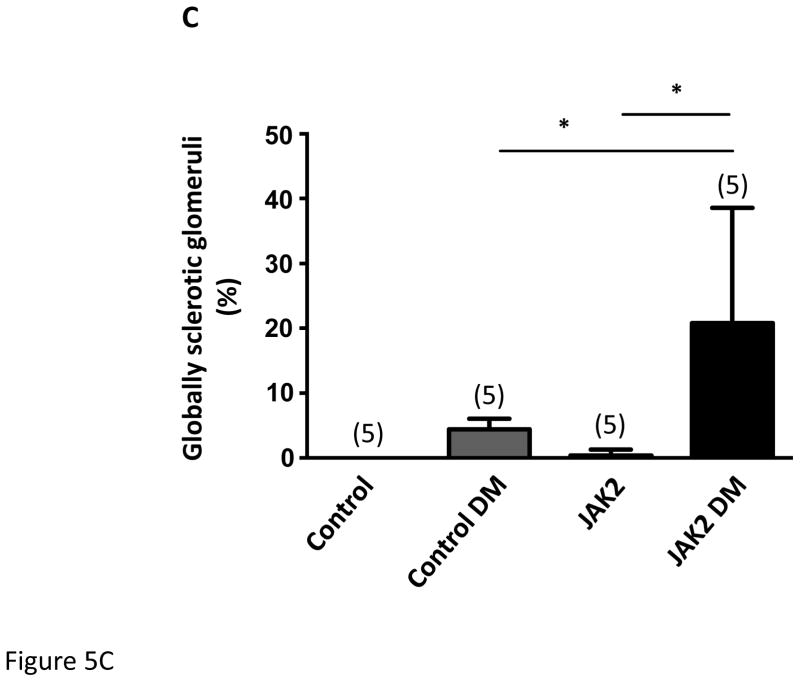
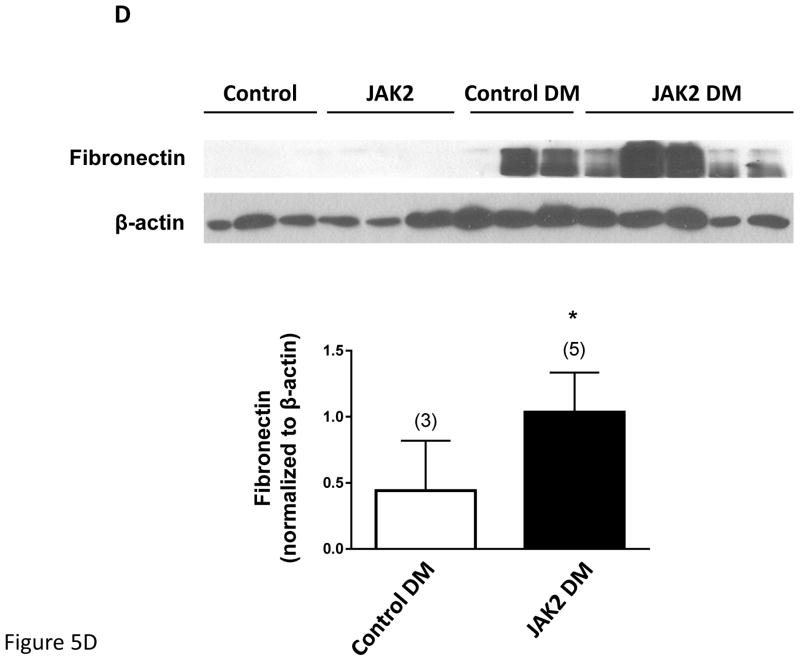
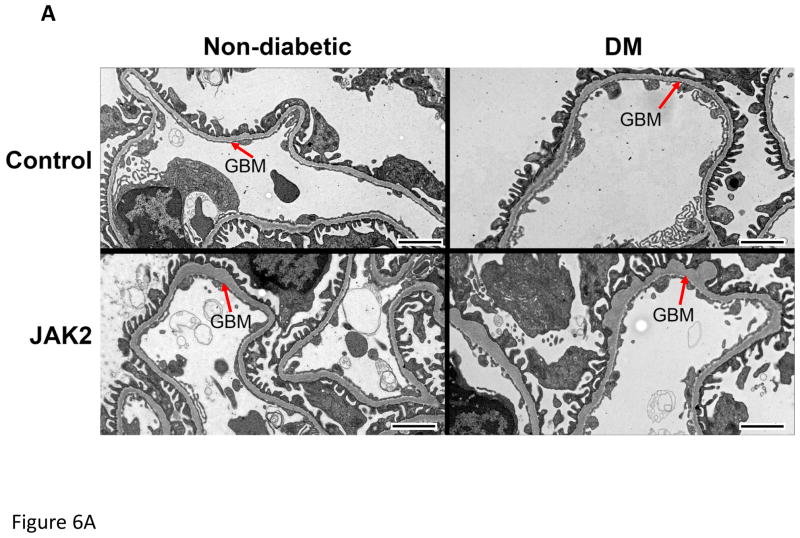
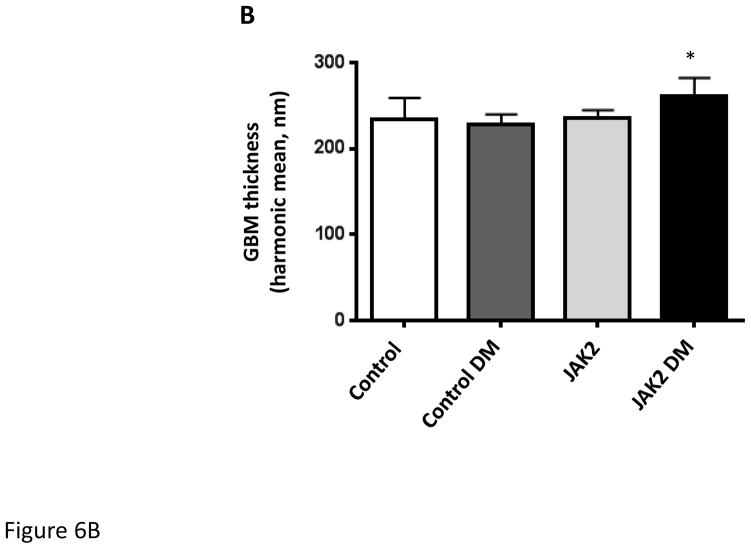
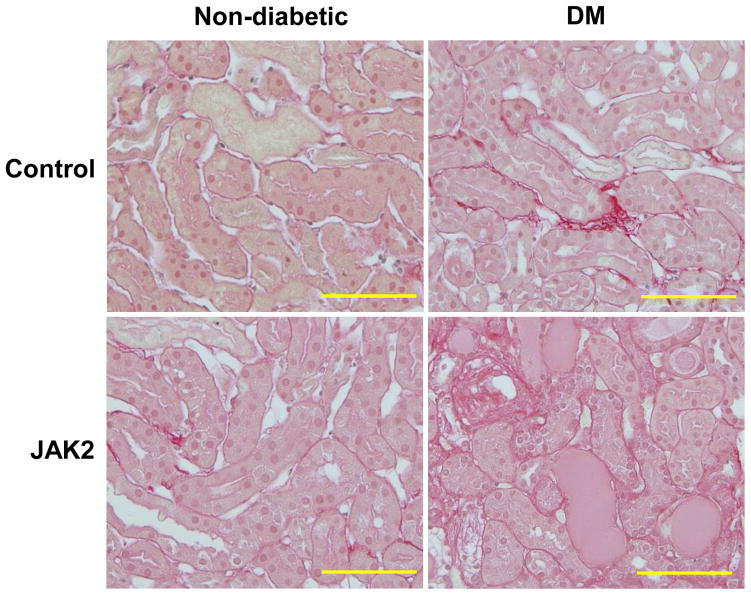
Ang II infusion by itself did not significantly affect albuminuria or mesangial expansion in this model (see Supplement). The non-diabetic JAK2 mice developed a modest increase in albuminuria when compared to the control mice but this increase was not statistically significant (Fig. 4). Compared to non-diabetic mice, both diabetic groups developed substantial (>10-fold) increases in albuminuria based on albumin-to-creatinine ratios. However, the JAK2 diabetic mice developed approximately 3-fold greater albuminuria than did the control diabetic mice. Similarly, non-diabetic JAK2 mice developed a modest increase in mesangial expansion when compared to the non-diabetic control mice (Fig. 5). The degree of mesangial expansion and glomerular sclerosis was markedly enhanced by diabetes, and was substantially greater in the podocyte JAK2 diabetic mice than in the control diabetic mice (Fig. 5). Concordant increases in glomerular fibronectin were documented by immunoblotting with dramatically higher fibronectin levels in glomeruli from diabetic mice compared to non-diabetic mice and even further increase in glomeruli from podocyte JAK2 diabetic mice compared to those from control diabetic mice (Fig. 5). Podocyte density was reduced in both diabetic groups and was lowest in the JAK2 diabetic mice (Table 2). Glomerular basement membrane thickness was not altered by diabetes in the control mice, perhaps due to the short duration of diabetes in this model (Fig. 6), but there was a moderate and significant increase in glomerular basement membrane thickness in the JAK2 diabetic mice when compared to the other 3 groups (Fig. 6). There appeared to be a very modest increase in tubulointersitital fibrosis based on picrosirius red staining in both the control and podocyte JAK2 diabetic groups (Fig. 7) but this was not quantified as it remained very low in all groups. Plasma creatinines were significantly elevated in both diabetic groups when compared to non-diabetic mice but were not significantly different from each other (Table 1).
Figure 4.
Albuminuria was substantially increased by diabetes (DM) in control mice, but was augmented almost 3-fold in JAK2 diabetic mice compared to control diabetic mice. Number of animals in each group is indicated in parentheses above each bar. *p < 0.05, **p < 0.01, ***p < 0.001 vs. JAK2 DM.
Figure 5.
Mesangial expansion in JAK2 and control mice. Mesangial expansion in non- sclerotic glomeruli was substantially increased by diabetes (DM) in control mice, but was augmented significantly more in JAK2 diabetic mice compared to control diabetic mice, as shown in PAS-stained glomerular sections (A) and expressed as PAS-positive percent mesangial area (B). The number of globally sclerosed glomeruli was also substantially greater in the JAK2 diabetic mice than in the other groups (C). Glomerular fibronectin levels were increased by diabetes (top panel) but much more so in the JAK2 diabetic mice than in control diabetic mice (lower panel). Number of animals in each group is indicated in parentheses above each bar. *p < 0.05, ***p < 0.001. Scale bars are 100 μm in length.
Table 2.
Glomerular morphometry
| Experiment 1
| ||||
|---|---|---|---|---|
| Control | Control diabetic | JAK2 | JAK2 diabetic | |
| Glom Vol (x 103 μm3) | 183.6 ±19.9 | 291.2 ± 12.6 *≠ | 194.8 ± 24.9 | 351.5 ± 21.8 *≠ |
|
|
||||
| PON | 70.2 ± 4.2 | 73.0 ± 3.4 | 64.0 ± 4.6 | 65.4 ± 7.2 |
|
|
||||
| P/GVt (x 10−4/μm3) | 3.90 ± 0.26 | 2.52 ± 0.15 * | 3.44 ± 0.34 | 1.88 ± 0.21*≠ |
| Experiment 2
| ||
|---|---|---|
| JAK2 diabetic + vehicle | JAK2 diabetic + JAK1/2 inhibitor | |
| Glom Vol (x 103 μm3) | 298.8 ± 32.4 | 264.2 ± 27.4* |
|
|
||
| PON | 67.2 ± 3.4 | 71.2 ± 3.5 |
|
|
||
| P/GVt (x 10−4/μm3) | 2.32 ± 0.21 | 2.82 ± 0.29 |
Abbreviations: Glom Vol – glomerular volume, P/GVt – Podocyte number per glomerular volume, PON - podocyte number/glomerulus.
Data are presented as means ± SEM, n = 5 (Experiment 1) or 6 (Experiment 2) per group.
p< 0.05, vs. Control,
vs. JAK2,
vs. Control DM.
Figure 6.
Glomerular basement membrane (GBM) thickness. GBM thickness was assessed by transmission electron microscopy as shown in the electronmicrograph (A). GBM thickness was modestly but significantly increased (B) in JAK2 diabetic mice compared to the other groups. N = 5 for all groups. *p < 0.05. Scale bars are 2 μm in length.
Figure 7.
Tubulointerstitial fibrosis was assessed by picrosirius red staining which showed minimal interstitial fibrosis in all groups. Scale bars are 200 μm in length.
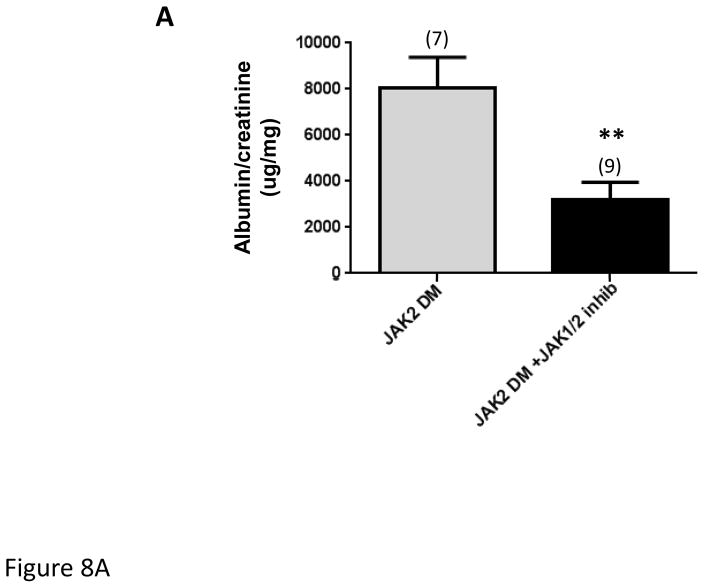
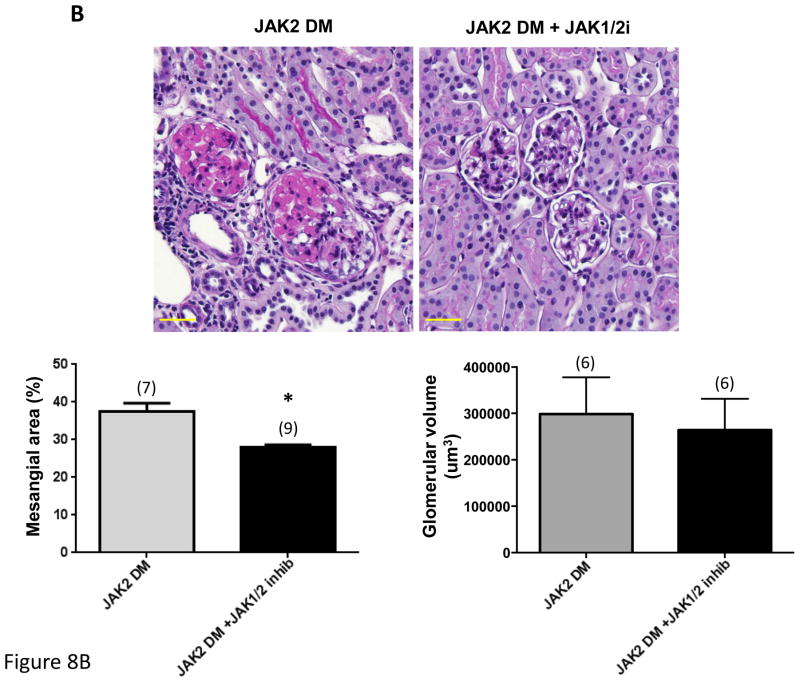
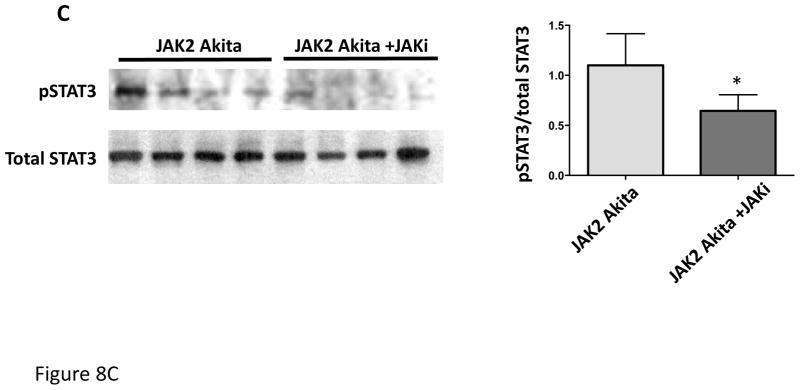
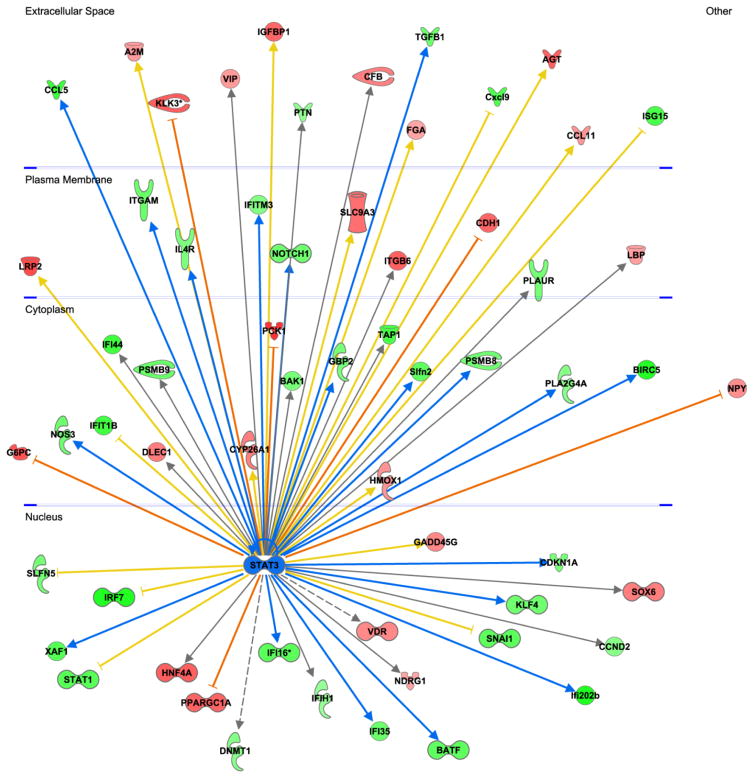
In a separate experiment, JAK2 diabetic mice were treated with an oral JAK1/2 inhibitor (LN3103801, gift of Lilly and Co.) daily for the final 2 weeks of the 4-week Ang II infusion period. All other aspects of the experimental design were identical to those noted above except that the control mice received the same volume of acidified water that was used as a vehicle for the JAK1/2 inhibitor. Treatment with the JAK1/2 inhibitor resulted in reduction in STAT3 phosphorylation (Fig. 8C), confirming reduction in upstream JAK activity. Treatment with the inhibitor also markedly reduced the albuminuria and the mesangial expansion found in the JAK2 diabetic mice (Fig. 8A, B). Podocyte number and density were numerically greater in the JAK1/2 inhibitor treated group (Table 2), but this difference was not statistically significant. The effects of the JAK1/2 inhibitor on tubulointerstitial pathology were not assessed since the amount of tubulointerstitial fibrosis was already minimal in the JAK2 diabetic mice, so improvement with the inhibitor would have been undetectable and not meaningful. Plasma creatinine was slightly but non-significantly lower in the inhibitor-treated group than in the group treated with vehicle only (0.084 ± 0.010 vs. 0.066 ± 0.006). There was no effect of the JAK1/2 inhibitor on blood pressure or lipid profiles (Suppl. Fig. 1 and Suppl. Table 1). Transcriptomic analysis of the effects of the JAK1/2 inhibitor on glomerular gene expression indicated that the inhibitor affected multiple STAT1- and STAT3-dependent pathways (Supplementary Table 2). Significant STAT3-dependent transcriptional changes are depicted in Fig. 9. Some prominent examples among these changes resulting from JAK1/2 inhibitor treatment include decreased expression of Tgf-β1, Notch1 and Ccl5, each of which has been implicated in promoting DKD progression 9–11. Stat1 gene expression was reduced by treatment with the JAK1/2 inhibitor (Fig. 9). There was no statistically significant change in expression with inhibitor treatment of any of the other Jak-Stat genes.
Figure 8.
Effect of treatment with a JAK1/JAK2 inhibitor on diabetic glomerular changes in JAK2 diabetic mice. Oral treatment with the JAK1/JAK2 inhibitor for the last 2 weeks of the experiment resulted in a significant decrease in albuminuria (A), mesangial expansion and glomerular volume (B) compared to treatment with vehicle alone as shown in PAS-stained glomerular sections (top) and expressed as PAS-positive percent mesangial area and as glomerular volume (bottom). (C) Glomerular levels of phosphorylated and total STAT3 and their ratios were determined by immunoblotting with specific antibodies. Animals treated with the JAK1/JAK2 inhibitor showed a significant reduction in relative phosphorylation of STAT3. Number of animals in each group is indicated in parentheses above each bar in the graphs. *p < 0.05, **p < 0.01. Scale bars are 50 μm in length.
Figure 9.
Glomerular transcriptomic responses to JAK1/JAK2 inhibitor treatment in JAK2 diabetic mice. Analysis of glomerular RNA microarray data revealed that treatment with the inhibitor resulted in changes in expression of multiple genes including those responsive to STAT3 (central node, shown in blue). STAT3-dependent genes are depicted on the periphery of the diagram and are displayed in the cellular compartment (nucleus, cytoplasm, plasma membrane, extracellular space) where their gene products would be expressed. Genes that were upregulated by treatment with the inhibitor are shown in red and downregulated genes are shown in green. The intensity of the color connotes the relative degree of expression change. Since JAK-STAT3 signaling was expected to be suppressed by treatment with the JAK1/2 inhibitor, genes that were upregulated by STAT3 were predicted to be downregulated by the inhibitor (green nodes with blue arrows from STAT3). Conversely, genes that were downregulated by STAT3 were predicted to be upregulated by the inhibitor (red nodes and orange inhibition lines). Genes that were regulated in an opposite direction to that predicted based on known canonical signaling pathways (e.g., were predicted to be decreased by JAK1/2 inhibition but were actually increased) are connected to STAT3 by a yellow arrow or line. Those genes for which there was no prediction based on prior knowledge are connected to STAT3 by a gray arrow.
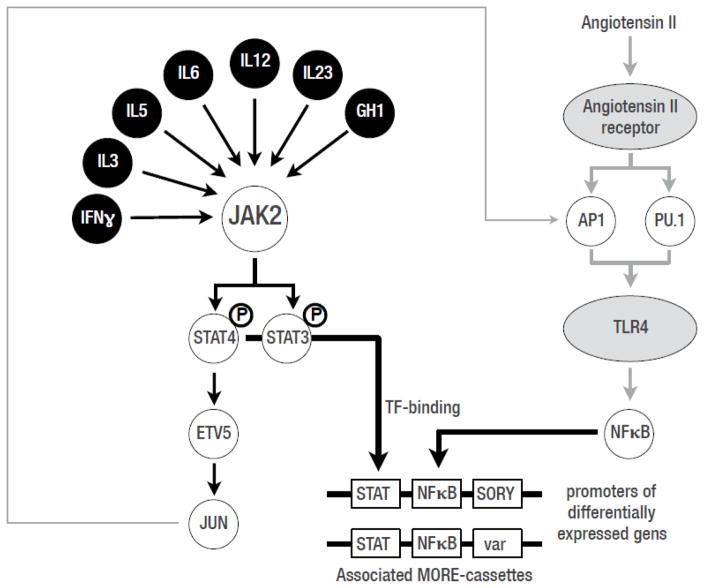
STAT transcription factors are known to activate gene expression in cooperation with other transcription factors as cofactors, which can be detected in responsive gene promoter sequences by the ordered presence of Transcription Factor Binding Sites (TFBSs). Cooperating TFBSs can be identified in a clearly defined organization within promoter sequences, termed Multiple Organized Regulatory Element cassettes (MORE) cassettes (previously known as “TFBSs-frameworks” 12). We detected MORE cassettes that were significantly associated with the promoters of inhibitor-influenced genes by identifying statistical overrepresentation of MORE cassettes in the promoters of those genes (detected frequency in the specific promoter set vs. the calculated random genome-wide frequency; see supplementary data). In order to focus on STAT-derived MORE cassettes we selected only promoters from the set of genes affected by the JAK1/2 inhibitor that contained at least one known STAT-transcriptional module from the MatBase library 13. Because these sets were too diverse to detect enrichment of MORE cassettes, we further restricted promoter sets to those containing one specific set of transcriptional modules consisting of STAT and one other defined TFBS. This resulted in 6 distinct promoter sets, two of which (STAT-NFKB, STAT-AP1) resulted in statistically increased representation among all promoters. Out of 3873 promoters in the set, 70 (1.8%) contained the STAT_NFKB-MORE-cassettes. This represented a 3.7-fold enrichment over the expected frequency despite the relatively small number of inhibitor-influenced genes. With the focus on STAT-dependent genes, we found associated MORE-cassettes that also contained TFBSs for factors involved in other pathways, such as AP1 and NFKB. This finding suggests that these MORE-cassettes were associated with the interaction of the JAK2-STAT pathway with the Ang II signaling pathway (perhaps via Toll-like receptor 4, TL4) (Fig. 10). Thus, this approach has identified a potential alternate molecular basis for the apparent crosstalk between JAK-STAT and Ang II initially demonstrated by Amiri, et al. 14, so the set of 70 genes may be of special interest as they are likely to be targeted by crosstalk between the two pathways (Fig. 10).
Figure 10.
Potential crosstalk between JAK-STAT and Ang II signaling pathways in response to JAK1/2 inhibition in glomeruli from JAK2 diabetic mice. These interactions were based on known interactions (Jun) and analysis of potentially cooperating transcription factor binding sites in genes that were responsive to inhibitor treatment that were identified by analysis of Multiple Organized Regulatory Element cassettes (MORE) cassettes (see Methods). Black circles: known JAK2 inducers; grey ovals: angiotensin II responsive receptors; white circles: transcription factors; white rectangles: transcription factor binding sites in MORE-cassettes for the respective transcription factors.
Discussion
Activation of JAK-STAT signaling has been implicated in the pathogenesis of DKD for some time. Initial studies in this area by Marrero’s group documented that exposure to elevated glucose concentrations resulted in activation of JAK2 dependent signaling in a variety of cell types as well as in the renal cortex from rodent models of early DKD 14–17. Induction of TGF-β and fibronectin expression was found to be dependent on JAK-STAT signaling and was abrogated by JAK2 inhibition 15, 17. In addition, experiments using the streptozotocin diabetic rat DKD model found that increased systolic blood pressure 18 and albuminuria 19 were both prevented by treatment with the relatively nonspecific JAK2 inhibitor, AG490, supporting the idea that JAK2 activation plays an important role in DKD.
Subsequently, in a transcriptomic analysis we found that kidney expression of JAK1, 2 and 3 and STAT1 and 3 was substantially increased in human subjects with DKD compared to healthy controls 4. Expression was increased dramatically in glomeruli in subjects with early disease and appeared to be progressively increased in the tubulointerstitial region in subjects with declining eGFR. This pattern corresponds to the natural progression of DKD which initially damages glomeruli and then the tubulointerstitium. The expression of tubulointerstitial JAK-STAT genes was tightly and inversely correlated to the decline in estimated glomerular filtration rate in these subjects 4. We then utilized Nephroseq, an online database that is part of the University of Michigan NIDDK O’Brien Kidney Center (www.nephroseq.org) to interrogate an independent transcriptomic dataset of human DKD subjects with reduced eGFR (~25–35 mL/min) published by other investigators 20. We found similar increases in tubulointerstitial expression of JAK1, JAK2, STAT1 and STAT3 genes in this set of 22 patients with progressive DKD21. The increases in JAK-STAT gene expression were not found in several mouse models of DKD even though there was evidence of glomerular JAK-STAT activation in the mice3, 4.
To determine whether increased expression of JAK-STAT family members contributed to the pathogenesis of early DKD in humans, we generated a new mouse model that overexpressed JAK2 specifically in the podocytes of a mouse model of DKD since our initial human studies showed high JAK2 expression in podocytes. The current study documents the successful generation of this humanized mouse model, as shown by increased JAK2 expression in isolated glomeruli, as well as the substantial enhancement of glomerulopathy that resulted from this single change in podocyte gene expression. While we did not formally demonstrate that the increased JAK2 expression in glomeruli was podocyte-specific, the Nphs2 Cre mouse has been shown to produce podocyte specific cre recombinase expression 8 in the hands of multiple investigators. We found enhanced albuminuria, mesangial expansion, glomerular basement membrane thickness, glomerular fibronectin expression and STAT3 phosphorylation, as well as reduced podocyte density in the podocyte JAK2 diabetic mice compared to non-transgenic diabetic animals and the other control mice. All these changes are hallmarks of diabetic glomerulopathy and meet most of the criteria established by the Animal Models of Diabetic Complications Consortium (now DiaComp) for models of human DKD 2. The fibronectin immunoblots showed a very large increase in glomerular fibronectin in diabetic mice vs. non-diabetic animals, whether transgenic or not. This unexpectedly large increase in fibronectin expression did not correspond to the more modest increase in mesangial matrix that was found in the diabetic animals. This may have been a specific feature of our model system in which we combined Ang II infusion with relatively short-term diabetes. Similarly, although there was no obvious increase in STAT3 phosphorylation in glomeruli from non-transgenic diabetic animals, our study was not designed to ascertain moderate differences in phospho-STAT3 levels between the 2 wild-type groups and STAT3 phosphorylation may have been relatively reduced in the non-transgenic diabetic mice in our model system compared to what has been found in other diabetic mouse model systems. Therefore, we do not think these findings undermine the growing body of evidence for JAK-STAT activation of glomeruli in many diabetic murine models 3, 15, 22..
Importantly, the major changes of DKD that were increased by podocyte JAK2 were reversed by 2-week treatment with a JAK1/2 inhibitor (LN3103801) which has a ~30 fold-specificity for JAK1 and JAK2 compared to JAK3 (unpublished data, Lilly and Co.). These improvements occurred with only 2 weeks of treatment in mice that had already been diabetic for several weeks and had already received Ang II infusion for 2 weeks. These findings confirm that the increased expression of JAK2 in podocytes led to enhanced JAK-STAT activation that was responsible for the enhanced albuminuria, mesangial expansion and podocyte depletion found in the diabetic podocyte JAK2 mice. Moreover, they strongly suggest that treatment with a JAK1/2 inhibitor in humans with early DKD and glomerular overexpression of JAK2 may have therapeutic benefits. In that regard, a Phase 2 multicenter double blind randomized controlled clinical trial in human subjects with DKD from type 2 diabetes of a JAK1/2 inhibitor, baricitinib, has recently found up to 40% reduction in albuminuria in subjects receiving baricitinib for 6 months compared to subjects on placebo 23. Importantly, this reduction in albuminuria occurred in subjects already on chronic ACE inhibition or angiotensin receptor blockade therapy 23.
Based on the current report and previously reported data we conclude that increased expression and activation of JAK2 in podocytes and probably in other glomerular and tubulointerstitial cells triggers a cascade of signaling processes that culminate in DKD progression. It is virtually certain that some of the effects of activated JAK2 are mediated by downstream STAT proteins, especially STAT3. In support of this notion, our transcriptomic analysis of mice that received the JAK1/2 inhibitor showed that such treatment down-regulated a number of STAT3-dependent genes such as Notch1, Tgf-β and CCR2, each of which have been shown to be a key driver of diabetic glomerulopathy 9, 11, 24. In addition, a bioinformatics analysis of transcription factor binding site organization in promoters of in inhibitor-influenced genes revealed a number of promoter cassettes that suggested crosstalk between the JAK-STAT and Ang II pathways potentially via toll-like receptor 4 (TLR4), which also may explain some of the salutary features of JAK1/2 inhibition in DKD. Many of the pathways that were affected by enhanced JAK2 expression and signaling and suppressed by the JAK1/2 inhibitor are involved in inflammation, suggesting that JAK2-STAT3 signaling in podocytes promotes glomerular inflammation in early DKD. Identification of the critical pathogenic effects of JAK2 signaling will be important in determining critical downstream molecules that could be targeted to help prevent or retard progression of DKD.
Not all JAK-STAT signaling abnormalities in DKD are JAK dependent. A recent study showed that STAT3 acetylation was increased in both mouse and human diabetic kidneys 25. Acetylation of STAT proteins can induce STAT dimerization which is critical for the translocation of STATs to the nucleus and their ability to modulate gene transcription 26. In human podocytes, exposure to advanced glycation end products (AGEs) resulted in enhanced p65 and STAT3 acetylation. Treatment with inhibitors that block acetylation-mediated association of STAT3 also attenuated proteinuria and kidney injury in db/db mice 25. These findings support a significant role for activated STAT3 acetylation in DKD independent of upstream JAK signaling, or at least of changes in upstream JAK signaling. Thus, while targeting JAK2 in diabetic patients is likely to be helpful in preventing progressive DKD it could also be important to target STAT3 activation directly to further reduce its pathogenic effects.
In summary, podocyte specific JAK2 overexpression in a mouse model, mimicking the condition in humans with early DKD, substantially augments diabetic glomerular changes. Treatment with a JAK1/2 inhibitor reversed much of the worsened DKD phenotype in this model. These studies have established a new mouse model of progressive DKD that can be evaluated at an early timepoint. More importantly, they serve as a proof-of-concept that increased expression of JAK2 in podocytes leads directly to downstream features of DKD in humans that may be halted by timely intervention with a specific inhibitor.
Methods
Mouse models
To generate a model of cell-type specific enhanced JAK2 expression, a FLAG-tagged loxP-stop-loxP mouse full-length JAK2 cDNA was inserted into the ROSA26 gene locus using the pBigT/pROSA26PA targeting system 6. This allowed generation of mice with cell-type specific overexpression of the JAK2 transgene by crossing the mice with tissue specific Cre recombinase mice. Expression of Cre recombinase excised the “floxed” polyadenylation sequence 5′ to the Jak2 sequence and permitted Jak2 transcription driven by the ubiquitously expressed ROSA26 promoter (Fig. 1). The targeted mutation was bred onto the 129S6 background and NPHS2 (podocin) Cre mice 8 were also established on the same background at The Jackson Laboratory (Bar Harbor, ME) using a speed congenic strategy. The podocin-Cre mouse has been demonstrated to express Cre recombinase only in podocytes 8. We then generated Ins2 Akita/+ Jak2loxP/loxP mice that have been crossed to NPHS2 Cre Jak2loxP/loxP mice to produce Ins2 Akita/+ Jak2loxP/loxP NPHS2-Cre/+ (podocyte JAK2) diabetic mice, as well as Jak2loxP/loxP NPHS2-Cre/+ mice for use as non-diabetic controls.
Physiological studies
Podocyte JAK2 diabetic, podocyte JAK2 non-diabetic, and diabetic and non-diabetic control mice were implanted with Alzet osmotic minipumps (Model 1004; ALZA Scientific Products, Mountain View, California, USA) at 10 wks of age. Pumps were filled with sterile 0.9% sodium chloride solution containing Ang II. For the initial comparison study between the 4 mouse groups (first experiment), Ang II (Sigma Chemical Co., St. Louis, Missouri, USA) was delivered at 1,400 ng/min/kg for 28 days. For the JAK1/2 inhibitor studies, Ang II was obtained from Phoenix Pharmaceutical (Burlingame, California) and was injected at a rate of 700 ng/min/kg into podocyte JAK2 diabetic mice given the higher apparent potency of the compound from this supplier. To achieve consistent physiologic responses in both experiments we used an Ang II dose in the second experiment that produced an increase in blood pressure similar to that achieved in the first experiment. In the inhibitor study (second experiment), half of the animals also received JAK2 inhibitor (compound 03103801, Eli Lilly and Co., Indianapolis, IN) orally at dose of 3 mg/kg/day in acidified water (citric acid, pH 3.2) for the latter 2 weeks of the Ang II infusion period. The other animals received the same volume of acidified water.
Systolic blood pressure was measured noninvasively before and at the end of the Ang II infusion period by an occlusion tail-cuff using a computerized system (CODA System, Kent Scientific). Spot urines were collected prior to euthanasia. Urinary albumin concentration was determined by ELISA (Albuwell, Exocell, Philadelphia, PA, USA) and urinary creatinine levels with a color endpoint reagent (C513-480, Teco Diagnostics, Anaheim, CA) as previously reported 27. Plasma lipid and glycosylated hemoglobin levels were measured by the Michigan Diabetes Research Center Chemistry Laboratory. Plasma creatinine values were determined by liquid chromatography electrospray ionization tandem mass spectrometry in the positive mode as previously described.28
Under general anesthesia, a blood sample was drawn, and then both kidneys were flushed under constant 100 mmHg pressure with phosphate buffered saline (PBS) containing 50 U/ml sodium heparin. Once flushed of blood, the left kidney from each mouse was ligated and the right kidney was perfused with ferric oxide slurry in PBS via the abdominal aorta. The left kidney was removed and weighed. Kidney cortical regions were dissected and immediately placed into 2.5% glutaraldehyde for transmission electron microscopy (TEM), snap frozen in liquid nitrogen, or fixed overnight in a 2% paraformaldehyde solution in PBS. Glomeruli were isolated from the perfused right kidney as previously reported 27. Isolated glomeruli were placed in RNAlater (Life Technologies) for RNA analysis or in lysis buffer for immunoblotting as previously reported 27. Animal study protocols, care and procedures were approved by the University of Michigan Committee on the Use and Care of Animals (the Institutional Animal Care and Use Committee for the University of Michigan).
Histological studies
Sections cut from the fixed kidneys were stained for Periodic Acid Schiff (PAS), Masson’s tricrome, or picrosirius red, and immunohistochemistry for Collagen IV staining (3 μm sections) or for podocyte counting (5 μm sections). Globally sclerotic glomeruli were defined as those with >50% PAS positive area per glomerular cross-section. To determine the percentage of globally sclerotic glomeruli, all cortical glomeruli in a representative section from each animal were examined and counted. From the non-globally sclerotic glomerular cross-sections, 20 were chosen randomly for quantification of glomerular tuft area and glomerular PAS positive area for each animal. Quantitation was performed using MetaMorph Imaging Software (version 6.1, Molecular Devices Corporation, Downingtown, PA) as previously reported 27. All histochemical quantitation was performed by a single, blinded investigator.
Podocyte counts were performed with a modification of the method of Venkatareddy, et al. 29 Podocyte nuclei were detected by anti-WT1 immunohistochemistry as previously published 27. Picrosirius red staining was performed by for 1 hour with saturated picric acid containing 0.1% Sirius Red F3BA (Sigma-Aldrich-Fluka Chemicals, St. Louis). Slides were washed twice with acidified water, dehydrated in three changes of 100% ethanol, and then washed in xylene and analyzed visually under a light microscope 30.
For transmission electron microscopy, glutaraldehyde-fixed kidney cortical sections were mounted on a copper grid and photographed under a Philips CM-100 transmission electron microscopy. Glomerular basement membrane (GBM) thickness was determined by the orthogonal intercept method 31, 32. Digital images from transmission electron microscopy, at direct magnification of 7900x, were overlaid with a simple grid approximating 2.5 × 2.5 cm for final print size. The shortest distance between the endothelial cytoplasmic membrane and the outer lining of the lamina rara externa underneath the cytoplasmic membrane of the epithelial foot processes was measured where gridlines transected the endothelial surface of the GBM. Measurements were made using NIH ImageJ software (http://imagej.nih.gov/ij/) and converted to classes based on 0.75 as a multiplier of the harmonic (inverse) value for each division. The apparent harmonic mean thickness was calculated, from which the true harmonic mean thickness was estimated.
Immunoblotting
Glomerular or cortical samples were sonicated and/or mechanically disrupted and used for sodium dodecyl sulphate (SDS)-polyacrylamide gel electrophoresis (PAGE) as previously reported 33. We used the following primary antibodies from Cell Signaling Technology: Jak2 (D2E12), Stat3, phospho-Stat3 (Tyr705) and β-actin. The fibronectin antibody was from EMD Millipore. The secondary antibodies were from Santa Cruz Biotechnology. All exposures were within the linear range of the film and normalized to β-actin content whenever feasible.
Glomerular mRNA expression profiles and bioinformatic analysis
RNA was harvested using the RNeasy Mini Kit with QIAshredder (Qiagen, Valencia, CA) from glomeruli from 12 podocyte JAK2 mice treated with Ang II (6 that received the JAK1/2 inhibitor for 2 wks; 6 that received vehicle alone for the same period). Gene expression profiling was performed using the Affymetrix Mouse Gene 2.1 ST platform according to the manufacturer’s instructions. The raw image files (CEL file) were processed using ChipInpsector software (Genomatix Software, www.genomatix.de). The CEL files were normalized, log2 transformed, analyzed at the single probe level and summarized at the gene level using the method implemented in Chip Inspector (http://www.genomatix.de/download/software/ChipInspector_Manual_V2) 3. A false discovery rate of <1% was applied to detect significantly regulated genes in all comparisons. Functional upstream regulators and downstream targets were extracted using Ingenuity Pathway Analysis software (http://www.ingenuity.com/products/ipa). Data were submitted to the Gene Expression Omnibus (http://www.ncbi.nlm.nih.gov/geo/).
Multiple Organized Regulatory Element cassettes (MORE-cassettes) are upstream regulatory promoter regions that contain 2 or more transcription factor binding sites (TFBSs). Details of this method are in the Supplementary Data and Methods.
Statistical analysis
Statistical methods for the transcriptomic analyses were noted above. Non-transcriptomic data were presented as means ± standard error of the mean. When comparing 2 groups, a Student’s t-test was used. For multiple comparisons, a one-way ANOVA followed by Tukey-Kramer post-hoc analysis was performed. p values ≤ 0.05 were considered statistically significant.
Supplementary Material
Acknowledgments
Sources of support: grants from National Institutes of Health (UO1 DK60994, R24DK082841) and Juvenile Diabetes Research Foundation International (2-SRA-2014-257-Q-R), and research support from the Michigan O’Brien Translational Kidney Core Center (P30 DK081943), the Michigan Diabetes Research Center (P30 DK020572) and the A. A. Taubman Medical Research Institute at the University of Michigan.
We thank Dr. Edward Leiter and Ms. Racheal Wallace (The Jackson Laboratory, Bar Harbor, ME) for establishing the 129S6. Cg-Ins2AkitaGt(ROSA)26Sortm1Jak2Bro/J stock (JAX#10680) under the aegis of the Diabetes Complications Consortium and NIH contract DK75000). This work was presented in preliminary form at the American Society of Nephrology Annual Meeting in 2013.
Footnotes
Supplementary information is available at Kidney International’s website
Disclosure
JBH has grant support from Abbvie, Astra-Zeneca and Shire; TLS is a consultant for Genentech; and TW is a consultant for Genomatix. None of the other authors have disclosures.
Publisher's Disclaimer: This is a PDF file of an unedited manuscript that has been accepted for publication. As a service to our customers we are providing this early version of the manuscript. The manuscript will undergo copyediting, typesetting, and review of the resulting proof before it is published in its final citable form. Please note that during the production process errors may be discovered which could affect the content, and all legal disclaimers that apply to the journal pertain.
References
- 1.U.S. Renal Data System. USRDS 2013 Annual Data Report: Atlas of Chronic Kidney Disease and End-Stage Renal Disease in the United States. 2013. National Institutes of Health, National Institute of Diabetes and Digestive and Kidney Diseases; Bethesda, MD: 2013. [Google Scholar]
- 2.Brosius FC, 3rd, Alpers CE, Bottinger EP, et al. Mouse models of diabetic nephropathy. Journal of the American Society of Nephrology: JASN. 2009;20:2503–2512. doi: 10.1681/ASN.2009070721. [DOI] [PMC free article] [PubMed] [Google Scholar]
- 3.Hodgin JB, Nair V, Zhang H, et al. Identification of cross-species shared transcriptional networks of diabetic nephropathy in human and mouse glomeruli. Diabetes. 2013;62:299–308. doi: 10.2337/db11-1667. [DOI] [PMC free article] [PubMed] [Google Scholar]
- 4.Berthier CC, Zhang H, Schin M, et al. Enhanced expression of Janus kinase-signal transducer and activator of transcription pathway members in human diabetic nephropathy. Diabetes. 2009;58:469–477. doi: 10.2337/db08-1328. [DOI] [PMC free article] [PubMed] [Google Scholar]
- 5.O’Shea JJ, Schwartz DM, Villarino AV, et al. The JAK-STAT pathway: impact on human disease and therapeutic intervention. Annu Rev Med. 2015;66:311–328. doi: 10.1146/annurev-med-051113-024537. [DOI] [PMC free article] [PubMed] [Google Scholar]
- 6.Srinivas S, Watanabe T, Lin CS, et al. Cre reporter strains produced by targeted insertion of EYFP and ECFP into the ROSA26 locus. BMC Dev Biol. 2001;1:4. doi: 10.1186/1471-213X-1-4. [DOI] [PMC free article] [PubMed] [Google Scholar]
- 7.Chang JH, Gurley SB. Assessment of diabetic nephropathy in the Akita mouse. Methods in molecular biology. 2012;933:17–29. doi: 10.1007/978-1-62703-068-7_2. [DOI] [PubMed] [Google Scholar]
- 8.Moeller MJ, Sanden SK, Soofi A, et al. Podocyte-specific expression of cre recombinase in transgenic mice. Genesis. 2003;35:39–42. doi: 10.1002/gene.10164. [DOI] [PubMed] [Google Scholar]
- 9.Niranjan T, Bielesz B, Gruenwald A, et al. The Notch pathway in podocytes plays a role in the development of glomerular disease. Nature medicine. 2008;14:290–298. doi: 10.1038/nm1731. [DOI] [PubMed] [Google Scholar]
- 10.McGowan TA, Zhu Y, Sharma K. Transforming growth factor-beta: a clinical target for the treatment of diabetic nephropathy. Current diabetes reports. 2004;4:447–454. doi: 10.1007/s11892-004-0055-z. [DOI] [PubMed] [Google Scholar]
- 11.de Zeeuw D, Bekker P, Henkel E, et al. The effect of CCR2 inhibitor CCX140-B on residual albuminuria in patients with type 2 diabetes and nephropathy: a randomised trial. The lancet Diabetes & endocrinology. 2015;3:687–696. doi: 10.1016/S2213-8587(15)00261-2. [DOI] [PubMed] [Google Scholar]
- 12.Nelson PJ, Werner T. Pathways and promoter networks analysis provides systems topology for systems biology approaches. Seminars in nephrology. 2010;30:477–486. doi: 10.1016/j.semnephrol.2010.07.005. [DOI] [PubMed] [Google Scholar]
- 13.Cartharius K, Frech K, Grote K, et al. MatInspector and beyond: promoter analysis based on transcription factor binding sites. Bioinformatics. 2005;21:2933–2942. doi: 10.1093/bioinformatics/bti473. [DOI] [PubMed] [Google Scholar]
- 14.Amiri F, Shaw S, Wang X, et al. Angiotensin II activation of the JAK/STAT pathway in mesangial cells is altered by high glucose. Kidney international. 2002;61:1605–1616. doi: 10.1046/j.1523-1755.2002.00311.x. [DOI] [PubMed] [Google Scholar]
- 15.Marrero MB, Banes-Berceli AK, Stern DM, et al. Role of the JAK/STAT signaling pathway in diabetic nephropathy. Am J Physiol Renal Physiol. 2006;290:F762–768. doi: 10.1152/ajprenal.00181.2005. [DOI] [PubMed] [Google Scholar]
- 16.Banes-Berceli AK, Shaw S, Ma G, et al. Effect of simvastatin on high glucose- and angiotensin II-induced activation of the JAK/STAT pathway in mesangial cells. Am J Physiol Renal Physiol. 2006;291:F116–121. doi: 10.1152/ajprenal.00502.2005. [DOI] [PubMed] [Google Scholar]
- 17.Wang X, Shaw S, Amiri F, et al. Inhibition of the Jak/STAT signaling pathway prevents the high glucose-induced increase in tgf-beta and fibronectin synthesis in mesangial cells. Diabetes. 2002;51:3505–3509. doi: 10.2337/diabetes.51.12.3505. [DOI] [PubMed] [Google Scholar]
- 18.Banes AK, Shaw S, Jenkins J, et al. Angiotensin II blockade prevents hyperglycemia-induced activation of JAK and STAT proteins in diabetic rat kidney glomeruli. Am J Physiol Renal Physiol. 2004;286:F653–659. doi: 10.1152/ajprenal.00163.2003. [DOI] [PubMed] [Google Scholar]
- 19.Banes-Berceli AK, Ketsawatsomkron P, Ogbi S, et al. Angiotensin II and endothelin-1 augment the vascular complications of diabetes via JAK2 activation. Am J Physiol Heart Circ Physiol. 2007;293:H1291–1299. doi: 10.1152/ajpheart.00181.2007. [DOI] [PubMed] [Google Scholar]
- 20.Woroniecka KI, Park AS, Mohtat D, et al. Transcriptome analysis of human diabetic kidney disease. Diabetes. 2011;60:2354–2369. doi: 10.2337/db10-1181. [DOI] [PMC free article] [PubMed] [Google Scholar]
- 21.Brosius FC, 3rd, Alpers CE. New targets for treatment of diabetic nephropathy: what we have learned from animal models. Curr Opin Nephrol Hypertens. 2013;22:17–25. doi: 10.1097/MNH.0b013e32835b3766. [DOI] [PMC free article] [PubMed] [Google Scholar]
- 22.Lu TC, Wang ZH, Feng X, et al. Knockdown of Stat3 activity in vivo prevents diabetic glomerulopathy. Kidney international. 2009;76:63–71. doi: 10.1038/ki.2009.98. [DOI] [PMC free article] [PubMed] [Google Scholar]
- 23.Tuttle KR. Baricitinib in Diabetic Kidney Disease: Results from a Phase 2, Multicenter, Randomized, Double-Blind, Placebo-Controlled Study. American Diabetes Association Meeting; Boston. 2015. [Google Scholar]
- 24.Zhu Y, Usui HK, Sharma K. Regulation of transforming growth factor beta in diabetic nephropathy: implications for treatment. Seminars in nephrology. 2007;27:153–160. doi: 10.1016/j.semnephrol.2007.01.008. [DOI] [PMC free article] [PubMed] [Google Scholar]
- 25.Liu R, Zhong Y, Li X, et al. Role of transcription factor acetylation in diabetic kidney disease. Diabetes. 2014;63:2440–2453. doi: 10.2337/db13-1810. [DOI] [PMC free article] [PubMed] [Google Scholar]
- 26.Zhuang S. Regulation of STAT signaling by acetylation. Cellular signalling. 2013;25:1924–1931. doi: 10.1016/j.cellsig.2013.05.007. [DOI] [PMC free article] [PubMed] [Google Scholar]
- 27.Zhang H, Schin M, Saha J, et al. Podocyte-specific overexpression of GLUT1 surprisingly reduces mesangial matrix expansion in diabetic nephropathy in mice. American journal of physiology Renal physiology. 2010;299:F91–98. doi: 10.1152/ajprenal.00021.2010. [DOI] [PMC free article] [PubMed] [Google Scholar]
- 28.Mathew AV, Zeng L, Byun J, et al. Metabolomic Profiling of Arginine Metabolome Links Altered Methylation to Chronic Kidney Disease Accelerated Atherosclerosis. J Proteomics Bioinform. 2015;(Suppl 14) doi: 10.4172/jpb.S14-001. [DOI] [PMC free article] [PubMed] [Google Scholar]
- 29.Venkatareddy M, Wang S, Yang Y, et al. Estimating podocyte number and density using a single histologic section. Journal of the American Society of Nephrology: JASN. 2014;25:1118–1129. doi: 10.1681/ASN.2013080859. [DOI] [PMC free article] [PubMed] [Google Scholar]
- 30.Grimm PC, Nickerson P, Gough J, et al. Computerized image analysis of Sirius Red-stained renal allograft biopsies as a surrogate marker to predict long-term allograft function. Journal of the American Society of Nephrology: JASN. 2003;14:1662–1668. doi: 10.1097/01.asn.0000066143.02832.5e. [DOI] [PubMed] [Google Scholar]
- 31.Jensen EB, Gundersen HJ, Osterby R. Determination of membrane thickness distribution from orthogonal intercepts. J Microsc. 1979;115:19–33. doi: 10.1111/j.1365-2818.1979.tb00149.x. [DOI] [PubMed] [Google Scholar]
- 32.Ramage IJ, Howatson AG, McColl JH, et al. Glomerular basement membrane thickness in children: a stereologic assessment. Kidney international. 2002;62:895–900. doi: 10.1046/j.1523-1755.2002.00527.x. [DOI] [PubMed] [Google Scholar]
- 33.Zhang H, Saha J, Byun J, et al. Rosiglitazone reduces renal and plasma markers of oxidative injury and reverses urinary metabolite abnormalities in the amelioration of diabetic nephropathy. American journal of physiology Renal physiology. 2008;295:F1071–1081. doi: 10.1152/ajprenal.90208.2008. [DOI] [PMC free article] [PubMed] [Google Scholar]
Associated Data
This section collects any data citations, data availability statements, or supplementary materials included in this article.


