BIOCHEMISTRY. For the article “A β-1,3-N-acetylglucosaminyltransferase with poly-N-acetyllactosamine synthase activity is structurally related to β-1,3-galactosyltransferases” by Dapeng Zhou, André Dinter, Ricardo Gutiérrez Gallego, Johannis P. Kamerling, Johannes F. G. Vliegenthart, Eric G. Berger, and Thierry Hennet, which appeared in number 2, January 19, 1999, of Proc. Natl. Acad. Sci. USA (96, 406–411), the authors have recently become aware that the β-1,3-N-acetylglucosaminyltransferase described in the article is not encoded by the gene presented but rather by a homologous gene. The mistake resulted from a confusion of two sets of cDNAs whose laboratory-internal designations GT5 (the real β3GnT gene) and GT9 (the gene published) were inadvertently substituted when the expression vectors had been constructed. The other figures and tables remain unaffected. Similarly, the title and conclusion of the article were not influenced by this substitution. We apologize for the inconvenience that this confusion may have caused for other researchers. Corrected versions of Figs. 1–3 are shown on pages 11674 and 11675.
Figure 1.
Primary structure and deduced amino acid sequence of the human and mouse β3GnT cDNA. Each cDNA includes an open reading frame of 1,194 bp coding for a protein of 397 amino acids. The human and mouse β3GnT proteins share 87% identity. The predicted transmembrane region is shaded, and potential N-glycosylation sites (N-X-[S/T]) are underlined.
Figure 2.
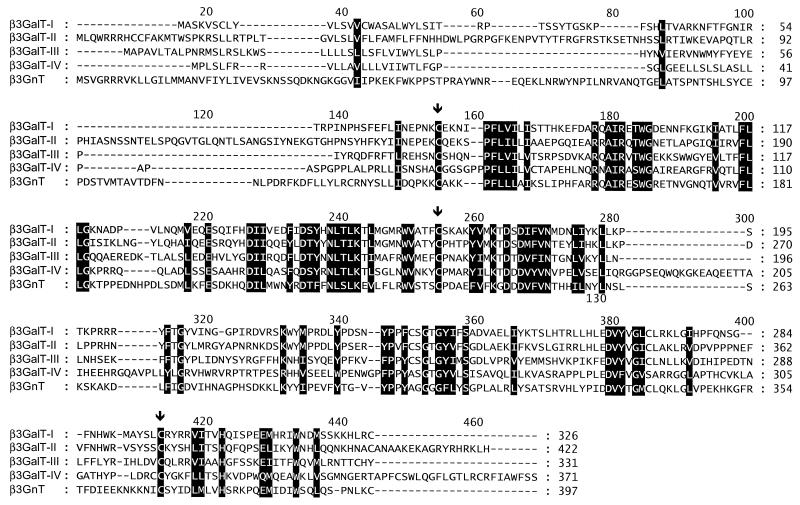
CLUSTALW alignment of mouse β3GalT-I, -II, -III, -IV, and mouse β3GnT proteins. Conserved residues are shaded. The black arrows show the position of the cysteines conserved in the five proteins.
Figure 3.
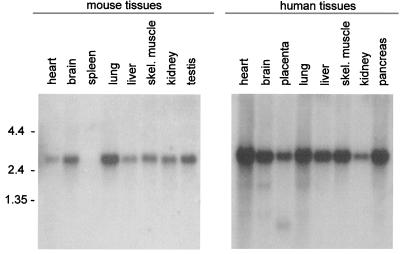
Expression pattern of the β3GnT gene in adult human and mouse tissues as determined by Northern blot analysis. Each lane represents about 2 μg of poly(A)+ RNA. At the left, the size of the RNA marker is indicated in kilobases.


