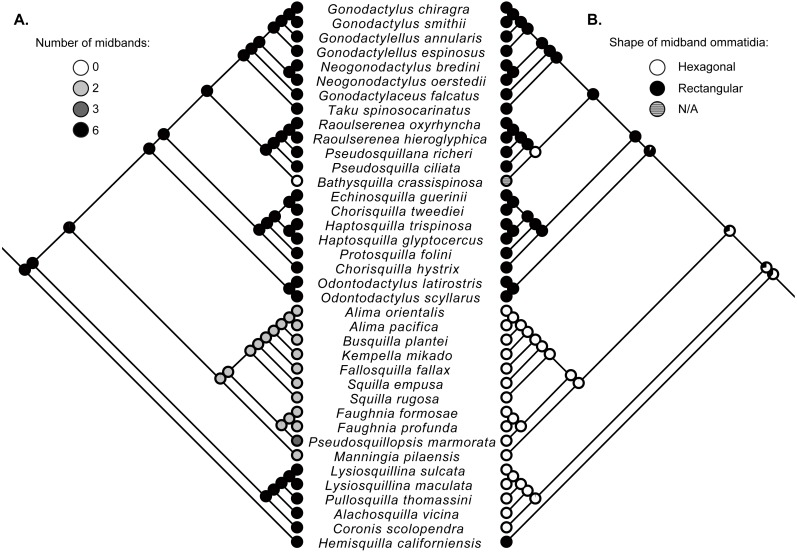
Figure 2. Ancestral state reconstructions.
Maximum-likelihood ancestral state reconstructions of the number of midband rows (A) and the shape of midband ommatidia (B) within the stomatopod eye based on a subset of taxa from the estimate of the stomatopod phylogeny (Fig. 1). Proportional likelihood of each character is represented by the pie chart at each internal node.

