

Abstract
We assess brain areas involved in speech production using a recently developed lesion-symptom mapping method (voxel-based lesion-symptom mapping, VLSM) with 50 aphasic patients with left-hemisphere lesions. Conversational speech was collected through a standardized biographical interview, and used to determine mean-length of utterance in morphemes (MLU), type token ratio (TTR) and overall tokens spoken for each patient. These metrics are used as indicators of grammatical complexity, semantic variation, and amount of speech, respectively. VLSM analysis revealed that damage to the anterior insula was predictive of low scores on MLU and Tokens, consistent with prior findings of the role of this region in speech production (Dronkers, 1996). Additionally, the inferior frontal gyrus, sensorimotor and anterior temporal areas were also associated with lower scores on both of these measures. Overall, Token and MLU maps were highly similar, suggesting an overlap between grammatical language networks and overall fluency. TTR maps also shared some portions of this network, but damage to posterior temporal regions also reduced scores on this measure. These results represent the first voxel-based lesion analysis of speech production performance in aphasic patients.
Keywords: aphasia, language, speech
1 Introduction
It has long been known that deficits in language production can be caused by injury to the left hemisphere. Neurologists and neuropsychologists typically classify these aphasias into two major categories - fluent and nonfluent - based upon how spoken language abilities are affected. In fluent aphasia, patients present with relatively effortless speech output – though the content of the speech may vary from good to incomprehensible. In contrast, non-fluent aphasia is characterized by slow, effortful speech, and reduced grammatical complexity and phrase length, but with a relative sparing of content word use (Goodglass, 1993).
Despite having been studied for over a century, the lesion correlates of these basic kinds of aphasia, particularly non-fluent aphasia, are far from clear. Initially, Paul Broca suggested that lesions in the inferior frontal gyrus, now corresponding to Brodmann’s areas (BA) 44 and 45, were implicated in speech production disorders (Schiller, 1992). However, as advances in technology have made patients’ lesion information easier to obtain (e.g. CT and MRI scans), lesion-symptom relationships derived from the classical models of aphasia have proven to be less predictive than expected. In many instances, left frontal lesions do not result in Broca’s aphasia (Basso, Lecours, Moraschini, & Vanier, 1985; Willmes & Poeck, 1993). Moreover, fluency problems can be reliably associated to lesions outside of Broca’s area, including underlying white matter tracts and anterior insula (Bates, Wilson, Saygin, Dick, Sereno, Knight, & Dronkers, 2003; Damasio, 1992; Dronkers, 1996; Mohr, Pessin, Finkelstein, Funkenstein, Duncan, & Davis, 1978). Conversely, lesions to Broca’s area can cause deficits in domains other than speech production, indeed even outside of language (Saygin, Wilson, Dronkers, & Bates, 2004).
There have also been a number of functional neuroimaging studies that have explored single word production. However, naturalistic or spontaneous speech production is not commonly explored because longer utterances can lead to unpredictable head movements causing image artifacts, especially for fMRI (Gracco, Tremblay, & Pike, 2005). Many of these studies have examined the neural substrates involved in single word retrieval and naming (Indefrey & Levelt, 2004) and for motor aspects of speech articulation (Wildgruber, Ackermann, Klose, Kardatzki, & Grodd, 1996; Wilson, Saygin, Sereno, & Iacoboni, 2004; Wise, Greene, Buchel, & Scott, 1999). These studies identify a large portion of the left hemisphere that is involved in word production, with some separable components. For example, Indefrey and Levelt (2004)’s meta-analysis of 82 functional imaging studies of single word production identified 11 regions in the left hemisphere (posterior inferior frontal gyrus, ventral precentral gyrus, SMA, mid and posterior superior and middle temporal gyri, posterior temporal fusiform gyrus, anterior insula, thalamus, and medial cerebellum), and 4 in the right (mid superior temporal gyrus, medial and lateral cerebellum, and SMA) as involved in core processes of word production. Additionally, task specific differences were identified, and used to differentiate between regions involved in lexical selection, syllabification, self monitoring, and phonetic retrieval, encoding and articulation. More specifically, left MTG was associated with lexical selection, left STG with self monitoring, sensorimotor cortex was connected with articulation, and phonological code retrieval was associated with Wernicke’s area. The findings from this meta-analysis suggest that many areas are associated in word production, but since this analysis involves only single word production, further research is needed to identify regions involved in producing complex conversational utterances.
A PET imaging study (Blank, Scott, Murphy, Warburton, & Wise, 2002) that prompted subjects with autobiographical questions (much like in our own biographical interview, see below) found involvement of an extensive left hemisphere network (extending from the frontal pole through pre-SMA areas, as well as the angular and fusiform gyri) in addition to the traditional perisylvian areas. Here, activation during propositional speech was contrasted with speech during more automatic tasks such as counting and repeating well-known phrases. However, these comparisons still do not differentiate between areas that may be involved in relative complexity or variety of propositional speech.
Studies of patients with semantic dementia have also found a number of speech production deficits, that mainly result from problems with retrieval of semantic information due to anterior temporal lobe atrophy (Gorno-Tempini, Dronkers, Rankin, Ogar, Rosen, Phenegrasamy, Johnson, Weiner, & Miller, 2004; Jefferies & Lambon Ralph, 2006). This disorder is interesting because it affects anterior and inferotemporal regions that are not typically affected in stroke populations, and are often subject to large susceptibility artifacts in neuroimaging work. Thus, it is possible to examine areas not typically examined by neuroimaging and aphasic stroke studies. (Bird, Lambon Ralph, Patterson, & Hodges, 2000) examined the narrative speech of SD patients and observed progressive deficits in noun and verb production. Interestingly, as SD progressed, production of nouns was affected more in comparison to verb production. , They also observed that lower frequency items were produced less often in the more severe cases. Together, the authors concluded that anterior temporal degeneration may be important for retrieval of semantic information important in narrative production.
As the variety of findings from neuropsychological and neuroimaging studies show, it is clear that a network of brain regions in the left hemisphere is involved in language production, but the specific functionality of regions within this network during naturalistic, conversational speech remains to be determined. This study examines brain areas important in conversational speech production using a novel combination of language production measures and lesion-mapping methods. We derive our dependent measures from raw conversational speech as an atheoretical way to map differences between a number of important kinds of spoken language production deficits in aphasia. Although the application of these non-clinical measures to explore lesion correlates of speech production is novel, these metrics have been used to study language acquisition for decades (Brown, 1973). Similar measures have been used in studies of brain-injured adults and children (Bates, Reilly, Wulfeck, Dronkers, Opie, Fenson, Kriz, Jeffries, Miller, & Herbst, 2001) and have found that this technique correlates well with diagnostic measures of aphasia. In addition, a strength of this method is that it does not rely on specific diagnostic cutoffs or subjective ratings of fluency to categorize aphasia syndromes (Bates et al., 2003). Furthermore, previous research on conversational speech in aphasia has not involved specific lesion analyses. To our knowledge this is the first lesion mapping study of speech production that uses non-clinical measures derived from naturalistic speech output.
We recorded structured interviews with a large group (N=50) of aphasic patients. The coded transcripts were then used to analyze: 1) overall “tokens” – the overall number of words spoken which represents overall speech fluency, 2) the mean length of utterance in morphemes (MLU), which is used as a measure of grammatical complexity, and 3) type/token ratio (TTR) which is the number of different kinds of words spoken divided by the overall number of words spoken as a measure of the lexical diversity of speech. Table 1 provides an example sentence (“Tall parents often have tall kids”) and the three measures calculated for that sentence. The structure of the interview can be found in Appendix A.
Table 1. Examples of Production Measures Analyzed.
| Measure | Description | Example: Tall parents often have tall kids. |
|---|---|---|
| Tokens | Fluency measure: counts the overall number of words spoken | “Tall – parents – often – have – tall - kids”
Tokens = 6 Number of words: 6 |
| MLU | (Mean Length of Utterance) Complexity measure: average of number of morphemes per utterance | “Tall - parent – s(Plu) – often – have – tall – kid – s(Plu)”
MLU = 8 Number of Morphemes: 8 Number of Utterances: 1 |
| TTR | (Type-Token Ratio) Semantic variety measure: divide number of unique words by total number of words | “Tall – parents – often – have – kids
TTR = 0.83 Number of unique words: 5 Number of words: 6 |
In addition to our speech sampling method, the second major methodological strength of the present study is our lesion-mapping procedure. Traditional lesion-mapping methods risk losing important information: patient groups typically comprise a broad range of lesioned areas and behavioral deficits, but are grouped either within a pre-specified lesion region of interest, or within narrowly defined behavioral categories for evaluation purposes. In addition, clinical measures can be very broad, and measure a conglomerate of neuroanatomically distinct abilities (Bates, Saygin, Moineau, Marangolo, & Pizzamiglio, 2005). The VLSM technique (Bates et al., 2003) is an important advancement because it preserves continuous lesion and behavioral information; no categorization based on lesion site, clinical diagnosis, or behavioral performance is necessary. In the case of speech production, this represents an enormous benefit, because it does not force investigators to rely upon grouping patients as specifically “impaired” on any aspect of spoken language – as surveyed above, such diagnostic categories have not led to consistent lesion-symptom relationships in the first place.
In summary, this study explores lesion correlates of speech production deficits with a novel combination of approaches. We merge non-clinical language production measures derived from naturalistic speech output from aphasic patients and voxel-based lesion symptom mapping to differentiate between neural substrates that are involved in overall fluency, complexity of speech, and semantic variety of speech. This combination has a variety of advantages that make it possible to improve upon previous lesion mapping work in speech production that has used relatively coarse measures.
2 Methods
2.1 Participants
Fifty aphasic patients participated in the study. They were voluntary participants recruited from the community in San Diego, CA or the VA Northern California Health Care System (VANCHCS) in Martinez, CA, and were paid for their participation. All patients were native English speakers with normal or corrected-to-normal hearing and vision and 45 patients were right handed. Computerized tomography (CT) or magnetic resonance imaging (MRI) scans and medical records of all patients were evaluated by a neurologist at the time of enrollment, and only patients with unilateral lesions due to a single cerebrovascular accident at least one year prior to testing were included. Further exclusionary criteria included suspected or diagnosed hearing difficulties, dementia, head trauma, tumor, or multiple infarcts. The age range of lesion onset was 19–75, with a mean age of 57.25 years.
The patients were classified with the Western Aphasia Battery (Kertesz, 1982), which was administered by a certified speech-language pathologist. By WAB criteria, 13 patients were classified with Broca’s aphasia, 4 with Wernicke’s aphasia, 23 with anomic aphasia, 5 with conduction aphasia, 5 were within normal limits (WNL)1, and 1 was unclassifiable. See Table 2 for more information about patient characteristics.
Table 2. Characteristics of aphasic patients.
Patient group determined using the Western Aphasia Battery (WAB), AQ: Aphasia Quotient, a measure of aphasia severit, based on the WAB (max=100). Lesion summaries are based on CT or MRI scans or medical records.
| Patient | Age | Hand | Diagnosis | AQ | Neurological Involvement |
|---|---|---|---|---|---|
| 1 | 58 | Right | WNL | 96.7 | posterior temporal, occipital |
| 2 | 19 | Right | Broca’s | frontal, temporal, parietal, insula, basal ganglia | |
| 3 | 49 | Right | Anomic | 84.4 | basal ganglia, insula |
| 4 | 75 | Right | Anomic | 90.74 | white matter infarcts |
| 5 | 46 | Right | Conduction | 82.6 | frontal, temporal, parietal |
| 6 | 60 | Right | Anomic | 92.2 | basal ganglia |
| 7 | 60 | Right | Conduction | 77.1 | frontal |
| 8 | 53 | Right | Broca’s | 18.9 | temporal, parietal, frontal, insula |
| 9 | 43 | Right | Broca’s | 35.8 | temporal, parietal, frontal, insula |
| 10 | 52 | Left | Anomic | 93 | temporal, parietal |
| 11 | 43 | Left | Anomic | 92.2 | superior temporal, occipital, subcortical |
| 12 | 29 | Right | Anomic | 68.3 | frontal, temporal, parietal, insula, basal ganglia |
| 13 | 66 | Right | Broca’s | 96.3 | frontal, parietal |
| 14 | 72 | Right | WNL | 98.8 | subcortical |
| 15 | 67 | Right | Anomic | 93 | subcortical |
| 16 | 71 | Right | Anomic | 99.2 | subcortical |
| 17 | 55 | Right | Anomic | 94.4 | temporal parietal |
| 18 | 68 | Right | Conduction | 34 | frontal, temporal, parietal |
| 19 | 71 | Right | Conduction | 67.2 | inferior parietal, small region on sup. temporal |
| 20 | 57 | Right | Broca’s | 70 | frontal, parietal |
| 21 | 46 | Right | Anomic | 88.5 | subcortical |
| 22 | 49 | Right | Broca’s | 26.7 | frontal, temporal, parietal |
| 23 | 61 | Right | Anomic | 86.7 | frontal |
| 24 | 58 | Right | Anomic | 92.9 | frontal, subcortical |
| 25 | 53 | Right | Anomic | 83.6 | frontal, tip of anterior temporal |
| 26 | 64 | Right | Wernicke’s | 37.8 | subcortical |
| 27 | 68 | Left | Wernicke’s | 38.4 | temporal, parietal |
| 28 | 64 | Right | Anomic | 90.9 | temporal, parietal |
| 29 | 27 | Right | WNL | 96 | frontal |
| 30 | 37 | Right | Other | 95.6 | frontal, parietal |
| 31 | 58 | Right | Anomic | 91.6 | frontal |
| 32 | 38 | Right | Anomic | 96.4 | frontal, temporal, parietal |
| 33 | 48 | Right | Broca’s | 20.8 | frontal, parietal, temporal |
| 34 | 70 | Right | Anomic | 58.9 | parietal, superior temporal |
| 35 | 54 | Right | Broca’s | 20.7 | frontal, temporal, parietal |
| 36 | 48 | Right | Broca’s | 34.6 | frontal, insular and subcortical extension, parietal |
| 37 | 51 | Right | Anomic | 99.6 | frontal |
| 38 | 44 | Left | Wernicke’s | 76.4 | frontal, temporal, parietal, insula |
| 39 | 57 | Right | Conduction | 87.5 | temporal parietal |
| 40 | 51 | Right | Anomic | 87.4 | frontal |
| 41 | 63 | Right | Anomic | 95.2 | subcortical |
| 42 | 61 | Right | Broca’s | 68.5 | superior temporal, parietal |
| 43 | 53 | Right | Broca’s | 44.7 | frontal, temporal, parietal |
| 44 | 59 | Right | Anomic | 92.6 | Superior temporal, parietal |
| 45 | 45 | Left | Broca’s | 34.1 | temporal, parietal, insula |
| 46 | 64 | Right | WNL | 96 | frontal, subcortical |
| 47 | 57 | Right | WNL | 98.6 | medial temporal, occipital |
| 48 | 45 | Right | Broca’s | 61.8 | frontal, anterior, temporal |
| 49 | 48 | Right | Anomic | 92.8 | frontal, temporal |
| 50 | 63 | Right | Wernicke’s | 72.1 | frontal, posterior, temporal |
The study was approved by the VA Northern California Health Care System and UCSD Human Research Protection Programs. Informed consent was obtained from all subjects prior to their participation.
2.2 Materials and Procedures
Patients were videotaped during a structured biographical interview focusing on family history, work, hobbies, and recent events, administered one-on-one in a quiet laboratory setting. Each interview consisted of 22 questions and took around 10–15 minutes to complete. The list of questions and open-ended probes is summarized in Appendix A.
All videotapes were transcribed according to the conventions of the Child Language Data Exchange System (MacWhinney & Snow, 1985), using a procedure similar to that described in (Bates et al., 2001). Transcripts were coded in ‘minchat’ format, where each utterance by the patient is marked individually, and bound morphemes, repetitions, false starts, retraces, unintelligible material and interruptions coded separately. Repeated and retraced utterances were excluded from analysis. In cases where the boundary of an utterance was unclear, or quite lengthy, transcribers applied the following rule from (Lee, 1974) - that only one “and” conjunction per sentence is allowed when the “and” connects two independent clauses. Four transcribers coded and checked the transcripts, and each went through a lengthy period of training, with inter-rater reliabilities (> 95%) being assured prior to transcription and coding. Transcribers were kept blind to the diagnosis and lesion site of each patient. The resulting transcripts were subsequently analyzed by the Child Language Analysis Program (CLAN) running on a Pentium IV computer to automatically extract information about numbers of word tokens and types, type/token ratios, number of morphemes, and mean length of utterance in morphemes. Results for total amount, variety and complexity of speech output are based on this coding. See Table 1 for an explanation of each measure.
2.3 Lesion Analysis
CT and/or MRI scans were available for each patient, and were used in creating digital reconstructions of their lesions onto 11 axial template slices from an atlas (DeArmond, Fusco, & Dewey, 1976) using a computer program developed at the VA Northern California Health Care System (Frey, Woods, Knight, Scabini, & Clayworth, 1987). The reconstructions were based on scans obtained at least 3 weeks post-onset. The reconstructions were performed by a board-certified neurologist with extensive experience in neuroradiology who was blind to the behavioral deficits of the patients. The reliability of these lesion reconstructions has been verified (Knight, Scabini, Woods, & Clayworth, 1988) and similar techniques have been used by other laboratories using different templates (Adolphs, Damasio, Tranel, Cooper, & Damasio, 2000; Bouvier & Engel, 2006). Templates were non-linearly transformed into standard MNI space (Collins, Neelin, Peters, & Evans, 1994) using a MATLAB procedure developed by Wilson (personal communication). This procedure involves rotating slices of the Colin brain by 7 degrees using the SPM software package for MATLAB, then aligning slices between the DeArmond and Colin brains using approximately 50 “control point pairs”, to match anatomical features between matching slices in both templates. Finally, slices were aligned using a nonlinear Matlab transform function (imtransform). Lesions were then smoothed at 8mm FWHM and threshold of 0.35. Lesion mapping was carried out using Voxel-Based Lesion-Symptom Mapping (VLSM, Bates et al, 2003).
The basic statistical process carried out in VLSM is summarized as follows: At each voxel, patients are divided into two groups according to whether they did or did not have a lesion affecting that voxel. Behavioral scores are then compared for these two groups with a t-test, yielding a single tailed p-value for each voxel. Colored VLSM maps are then produced that represent voxels where patients with lesions show a significantly different production score than those whose lesions are spared that voxel (at alpha level of p< .05 after correction for multiple comparisons using the false discovery rate, or FDR procedure (Benjamini & Hochberg, 1995). The color scale represents the degree of significance, or p-value, of this difference. The maps were smoothed in-plane with a circular filter with a radius of 3.5 mm. Voxels with fewer than 5 lesioned patients were excluded, in order to include only voxels where each group (intact and lesioned) was well represented. Since our sample contained mostly patients with strokes in the distribution of the middle cerebral artery (MCA), our lesion analysis will only provide results within this region of the left hemisphere. Figure 1 shows an overlay map for the lesions of the patients in this study, depicting regions that will be studied in this analysis. Lesion locations for each patient are also reported in Table 2.
Figure 1.
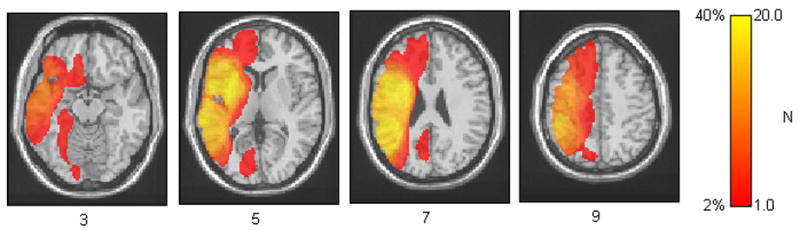
Lesion overlay of all lesions for patients. This figure represents the extent of brain tissue which will be covered in our analyses. Higher values represent voxels where a larger number of patients were lesioned. Regions of analysis are restricted to voxels with at least 5 lesioned patients.
Software to perform VLSM operates on Matlab (Mathworks, 2002) on lesion files in the ANALYZE image format, and is freely available online at http://crl.ucsd.edu/vlsm.
3 Results
We first report results on relevant indices of speech production measured from coded transcripts, and then detail the relationships between these measures and lesion sites.
3.1 Correlations between production measures
As mentioned above, one of our main goals is to tap into different aspects of speech production and distinguish potentially distinct neural mechanisms. However, if our measures (Tokens, TTR, MLU) were highly correlated with each other, they would be ill-suited for this purpose. Thus, we first conducted bivariate correlation analyses on these three speech production measures. The Tokens measure was significantly correlated with both TTR (R2=0.12, p=0.013) and MLU (R2=0.64, p<0.0001), but MLU and TTR were not correlated with each other (R2=0.002. p=0.63). This pattern also remained when outliers and patients who were classified as WNL were excluded from the analyses. Note that this correlation pattern is not unexpected because MLU and TTR are both derived from counts of tokens in speech, and therefore may reflect some common factors underlying both measures, such as motoric abilities.
3.1 Lesion Analyses
We performed lesion analyses to examine the neural correlates between areas implicated in overall fluency (measured by Tokens), complexity (measured by MLU) and semantic variety of speech (measured by TTR). Three axial slices from VLSM p-maps for Tokens, TTR and MLU are presented in Figure 2.
Figure 2.
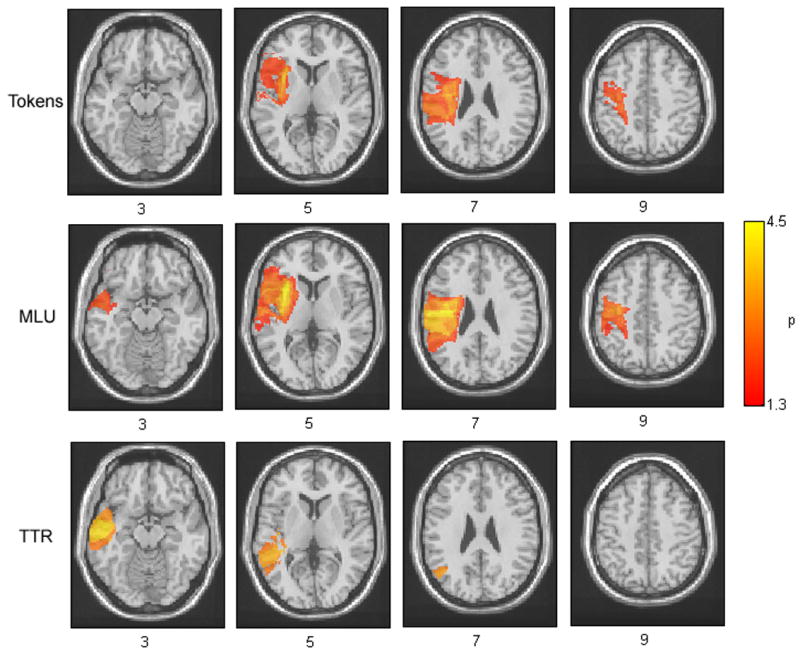
Axial VLSM displays showing relationships between speech production measures and brain injury. The behavioral measures displayed are (a) Fluency of speech, as measured by overall tokens spoken, (b) Complexity, as measured by mean length of utterance in morphemes and (c) Semantic variety, as measured by type token ratio. The values displayed at each voxels are the (log p) values of the t-tests between lesioned and intact patients at each voxel. Comparisons were conducted across all voxels that contained a minimum of five lesioned patients in that voxel. In all colored voxels p-values reached the FDR corrected significance level of 0.05.
The VLSM p-map for the overall number of Tokens produced (Figure 2) revealed lesion involvement in a large area including a portion of the left inferior frontal gyrus (IFG) and insula, as seen in slice 2, and portions of somatosensory and motor cortex, visible in slices 2, 3 and 4 extending posteriorly into the inferior parietal lobule (IPL) and portions of the supramarginal gyrus (SMG). In slice 3, white matter tract involvement including portions of the superior longitudinal fasciculus (SLF) were visible. The regions showing the highest degrees of significance on Tokens included both the insula in slice 2 and motor cortex and SLF in slice 3.
The VLSM p-map for MLU (Figure 2) revealed a broader area of lesion involvement extending throughout the left IFG, anterior temporal regions and insula in slices 1 and 2, and a broad region extending along the entire somatosensory and motor cortex in slices 2, 3, and 4 and continuing into the SLF and extending posteriorly through the IPL including the SMG. The regions that showed the highest significance values on MLU included the anterior portion of the insula in slice 2 and motor cortex in slices 2 and 3. It is notable that these regions overlapped significantly with Tokens, suggesting that lesions in similar neural regions predict both production of Tokens and MLU. One area that was associated with MLU but not Tokens is the inferior anterior temporal region, which is visible in slice 1.
Finally, the VLSM p-map for TTR, revealed a more posterior and temporal focus of lesion involvement comprising a region that extended from anterior MTG and STG in slice 1 through posterior STG in slice two and the inferior angular gyrus in slice 3. Voxels that reached the highest levels of significance on MLU were located along the range of the MTG and STG - visible in slices 1 and 2.
In order to examine the relationships between lesion sites and our production measures in greater detail, we chose five regions of interest (ROIs) (Table 3). The ROIs were points that corresponded to areas of maximal significance in Figure 2 and areas that are unique to each measure for the p-maps in Figure 2. The five ROIs that were chosen are summarized in Table 3, and were: anterior insula (aINS; based on slice 2), primary motor cortex (PMC; based on slice 3 and 4), anterior superior temporal gyrus (aSTG; based on slice 1), posterior middle temporal gyrus (pMTG; based on slice 2) and angular gyrus (AG; based on slice 3).
Table 3. Summary of region of interest (ROI) analyses.
Listed below are the corresponding Brodmann and Talairach coordinates of peak involvement and statistics for measures of Fluency, Complexity and Variety of conversational speech for the following regions of interest: anterior insula (aINS), angular gyrus (AG), posterior medial temporal gyrus (pMTG), anterior superior temporal gyrus (aSTG), and primary motor cortex (PMC). Bold values indicate regions which remained significant at p < 0.05 after FDR correction for multiple comparisons.
| ROI | Brodmann Areas | Talairach Coordinates | Tokens | MLU | TTR | |||||
|---|---|---|---|---|---|---|---|---|---|---|
| x | Y | z | T | P | T | P | T | P | ||
| aINS | (13) | −32 | 12 | 6 | 3.81 | 0.0001 | 4.85 | 0.0001 | 1.08 | 0.14 |
| AG | 39 | −44 | −64 | 36 | 0.59 | 0.28 | 1.29 | 0.10 | 3.30 | 0.0009 |
| pMTG | 22 | −48 | −64 | 16 | 0.13 | 0.45 | 1.20 | 0.12 | 3.68 | 0.0002 |
| aSTG | 38 | −48 | 8 | −14 | 2.02 | 0.024 | 2.51 | 0.008 | 3.27 | 0.0009 |
| PMC | 4 | −58 | −10 | 26 | 2.22 | 0.015 | 3.38 | 0.0007 | 0.71 | 0.24 |
The main difference between production measures of Tokens and MLU were visible in the anterior temporal region in slice 1 on Figure 2. For Tokens, voxels in the aSTG region failed to achieve significance for an alpha level of p <0.05 with FDR correction (critical alpha rate of p<0.017); they were significant when uncorrected [t=2.02, p < 0.024]. On the other hand, the voxels within aSTG do reach a FDR corrected level of significance for MLU [t=2.51, p < 0.008] and TTR [t=3.27, p<0.0009]. Intact and lesioned patients also showed significant differences in aINS and PMC for Tokens [aINS:t=3.81, p<0.0001, PMC: t=2.22, p<0.015] and MLU [aINS: t=4.85, p<0.0001, PMC: t=3.38, p=0.0007], but not TTR [aINS: t=1.08, p=0.14, PMC: t=0.71, p=0.24]. On the other hand, lesions in more posterior areas, including AG and pMTG resulted in deficits in TTR [AG: t=3.30, p<0.0009, pMTG: t=3.68, p<0.0002] but not Tokens[AG: t=0.59, p=0.28, pMTG: t=.13, p=0.45] or MLU [AG: t=1.29, p=.10, pMTG: t=1.20, p=0.12].
4 Discussion
4.1 Lesion correlates of fluency and complexity
Speech output indices of fluency (measured by Tokens) and complexity (measured by MLU) have highly overlapping lesion correlate regions. Since the behavioral correlates of fluency and complexity were correlated with one another, it seems unsurprising that this relationship should emerge.
Deficits in production of both fluent (Tokens) and complex speech (MLU) were associated with lesions in motor and somatosensory cortex, including anterior insula and extending medially to include parts of the superior longitudinal fasciculus. The anterior insula has previously also been identified as a lesion site associated with speech production deficits (Bates et al., 2003; Dronkers, 1996) and this area is thought to be involved in motor coordination of speech related movements (Ackermann & Riecker, 2004). Therefore, the lesion sites we identified that led to deficits in fluency and speech complexity are in areas already known to be involved aspects of speech production.
Additionally, IFG lesions were related to reductions in both fluency (Tokens) and complexity (MLU). This region has been implicated in various language comprehension and production tasks but its precise functional role remains a point of active study. Major theories have classified it as an important area in syntactic encoding and production (Kaan & Swaab, 2002), verbal working memory (Paulesu, Frith, & Frackowiak, 1993), syntax-specific working memory (Indefrey, Brown, Hellwig, Amunts, Herzog, Seitz, & Hagoort, 2001), syntactic movement (Grodzinsky, 2006), motor aspects of speech production (Nishitani, Schurmann, Amunts, & Hari, 2005), and semantic integration (Swaab, Brown, & Hagoort, 1997). IFG is a rather large region, and the possibility remains that there are several functionally distinct regions that can account for many of these proposed functions.
We did not find evidence for a specific morpho-syntactic role for the IFG, since this region was not specifically implicated in the production of complex speech over that of fluent speech. On the other hand, our results are consistent with an explanation that the IFG may be involved in motor sequencing of complex and fluent speech production. A growing body of evidence has found that inferior frontal cortex shares some properties of premotor cortex and is involved in the processing of both orofacial and hand gestures and action comprehension (Binkofski & Buccino, 2004; Saygin, Wilson, Dronkers, & Bates, 2004; Saygin, Wilson, Hagler, Bates, & Sereno, 2004). According to this evidence, lesions to the IFG causes deficits in our fluency and complexity measures due to difficulty in programming complex motor movements necessary for speech. However there is also additional evidence that IFG is involved more generally in tasks that require serial prediction even in absence of overt motion, such as predicting subsequent pitch (Schubotz & von Cramon, 2002). In this view, IFG would be involved more abstractly in programming either serial motor movements (Nishitani, Schurmann, Amunts, & Hari, 2005), and/or serially ordered linguistic structures.
4.2 Lesion correlations of semantic variety
We found several regions that are involved in impairments in the production of semantic variety of speech, including: anterior temporal cortex, the AG, pMTG and pSTG. While anterior temporal cortex was also involved in deficits in fluent and complex speech production, posterior MTG, STG and AG were uniquely implicated in deficits in production of semantic variety in speech. These areas have been typically identified as important in semantic processing and comprehension, but not commonly reported as lesion correlates of language production (Bates et al., 2001).
Lesions in anterior temporal regions have been known to result in deficits in comprehension of sentences (Dronkers, Wilkins, Van Valin, Redfern, & Jaeger, 2004) and discourse (Crinion, Warburton, Lambon-Ralph, Howard, & Wise, 2006). Neuroimaging studies have found greater activation of anterior temporal areas to sentences rather than random strings of words (Stowe, Broere, Paans, Wijers, Mulder, Vaalburg, & Zwarts, 1998; Vandenberghe, Nobre, & Price, 2002). Thus it appears that anterior temporal cortex is involved in the comprehension of contextual and compositional meaning that occurs in structured speech beyond that of single words. Our data show that the aSTG region is important in processing complex semantic structures not only during comprehension, but also during production. Bird et. al. (2000) also report that degeneration of anterior temporal regions can impair semantic aspects of narrative speech production. Thus, the semantic processing that occurs in the anterior temporal cortex appears to be important for both comprehension and production of language.
We also found that lesions in more posterior left temporal and inferior parietal areas, which are traditionally associated with comprehension deficits (Goodglass, 1993) were correlated with reductions in semantic variety of speech. Interestingly, a recent study of auditory sentence comprehension using a similar lesion mapping technique did not find classical Wernicke’s area to be the main lesion correlates of deficits; but instead identified MTG and AG (Dronkers, Wilkins, Van Valin, Redfern, & Jaeger, 2004). Our findings lend support to Dronkers and colleagues (2004) suggestion that previous findings that have associated Wernicke’s area with language comprehension might be “epiphenomenal” due to the contribution of related adjacent areas to comprehension tasks.
Recent neuroimaging studies have also shown involvement of the posterior STG during speech production (Blank, Scott, Murphy, Warburton, & Wise, 2002; Okada & Hickok, 2006; Richard J. S. Wise, Scott, Blank, Mummery, Murphy, & Warburton, 2001). These findings have been associated with self-monitoring of speech, or maintenance of recent phonemic information involved in the storage, learning, and retrieval of semantic information. Our results add crucial information to findings from neuroimaging – since lesion studies reveal information about the necessary neural regions for intact functioning of a task. We found that reduction in semantic variety of speech was associated with lesions that include the posterior STG and MTG, but that damage to these areas does not reduce speech fluency or complexity. This suggests that posterior STG and MTG may be involved in retrieval of semantic information during speech production. Together, our findings add to a growing body of evidence suggesting that the posterior temporal lobe is also involved in aspects of language production, although further study is necessary to understand the specific functionality of these regions.
Together, anterior temporal and posterior temporal areas appear to be working in conjunction during language comprehension and production tasks. The evidence suggests an important role for the superior and middle temporal gyri in the retrieval of semantic information that occurs during language production. At the same time, anterior temporal areas appear to be involved in the integration of complex semantic meaning that must necessarily occur during both the production and comprehension of language.
5 Conclusions
Deficits in the production of both complex and fluent speech were associated with lesions to a perisylvian network of anterior language areas that have typically been associated with language production deficits, and also to motor and primary somatosensory areas that are important in the motoric and sensory aspects of speech production. The role of these regions include a range of components involved in coordinating articulatory movements to producing fluent and complex speech, for we found lesions in these areas led to deficits in speech fluency and complexity. On the other hand, deficits in the production of lexically-diverse speech had more posterior lesion correlates, encompassing the posterior STG and MTG, and the anterior STG. These areas have traditionally been associated with language comprehension abilities. Thus, production of semantically diverse speech relies upon a network of anterior and posterior temporal areas that are involved in both the rapid integration and retrieval of semantic information that occurs during both language production and comprehension.
Acknowledgments
This work was supported by NIDCD RO1 DC00216 (Bates/Dronkers) and NINDS P01 NS040813 to ND. Thanks to Meiti Opie, Nancy Mickel, Monica Smoak, for their help in transcribing the biographical interviews. We are also grateful to Fred Dick for his comments on earlier drafts, and to Stephen Wilson and Carl Ludy for their technical assistance.
APPENDIX A: BIOGRAPHICAL INTERVIEW
The biographical interview should be administered at the beginning of the subject’s first testing session. It is designed to elicit as much free conversation as possible. Encourage patient to speak for at least 10 minutes, if possible. Try to minimize use of “yes” - “no” questions.
BIOGRAPHICAL INTERVIEW
OPENING/GREETING
1. Hello M(r., rs., iss). How are you today?
2. What do you think of this (sunny, rainy, cloudy, cold) day?
3. Can you tell me where you live, come from, your address?
4. How did you get here today?
FAMILY
5. Do you live with anyone? Are you married? What is your wife’s/husband’s name?
6. Do you have any children?
7. Tell me about your family.
8. What does your daughter/son do?
9. Where does he/she live?
10. Do you have any grandchildren?
11. Tell me what you do with them.
CURRENT EVENTS
12. Ask some general questions pertaining to local, national news, TV shows, or other familiar facts. This must be appropriate to the patient’s educational or social background.
PERSONAL HISTORY
13. What did you do before you became ill?
14. Where did you work?
15. Where were you born?
16. Where did you grow up?
17. What language(s) did you speak as a child/adult? Dialects?
18. Did you go to high school? College?
19. Where were your parents born?
20. What did your father/mother do?
21. Do you have sisters/brothers?
22. Tell me where they live.
Footnotes
WNL patients were initially diagnosed with aphasia after lesion onset, but had recovered much of their language ability by time of testing. A separate set of analyses was conducted without this group but did not change the pattern of results.
Publisher's Disclaimer: This is a PDF file of an unedited manuscript that has been accepted for publication. As a service to our customers we are providing this early version of the manuscript. The manuscript will undergo copyediting, typesetting, and review of the resulting proof before it is published in its final citable form. Please note that during the production process errors may be discovered which could affect the content, and all legal disclaimers that apply to the journal pertain.
References
- Ackermann H, Riecker A. The contribution of the insula to motor aspects of speech production: A review and a hypothesis. Brain and Language. 2004;89(2):320–328. doi: 10.1016/S0093-934X(03)00347-X. [DOI] [PubMed] [Google Scholar]
- Adolphs R, Damasio H, Tranel D, Cooper G, Damasio AR. A role for somatosensory cortices in the visual recognition of emotion as revealed by three-dimensional lesion mapping. Journal of Neuroscience. 2000;20(7):2683–2690. doi: 10.1523/JNEUROSCI.20-07-02683.2000. [DOI] [PMC free article] [PubMed] [Google Scholar]
- Basso A, Lecours AR, Moraschini S, Vanier M. Anatomoclinical correlations of the aphasias as defined through computerized tomography: exceptions. Brain and Language. 1985;26(2):201–229. doi: 10.1016/0093-934x(85)90039-2. [DOI] [PubMed] [Google Scholar]
- Bates E, Reilly J, Wulfeck B, Dronkers N, Opie M, Fenson J, et al. Differential effects of unilateral lesions on language production in children and adults. Brain and Language. 2001;79(2):223–265. doi: 10.1006/brln.2001.2482. [DOI] [PubMed] [Google Scholar]
- Bates E, Saygin AP, Moineau S, Marangolo P, Pizzamiglio L. Analyzing aphasia data in a multidimensional symptom space. Brain and Language. 2005;92(2):106–116. doi: 10.1016/j.bandl.2004.06.108. [DOI] [PubMed] [Google Scholar]
- Bates E, Wilson SM, Saygin AP, Dick F, Sereno MI, Knight RT, et al. Voxel-based lesion-symptom mapping. Nature Neuroscience. 2003;6(5):448–450. doi: 10.1038/nn1050. [DOI] [PubMed] [Google Scholar]
- Benjamini Y, Hochberg Y. Controlling the false discovery rate: A practical and powerful approach to multiple testing. Journal of the Royal Statistical Society. Series B (Methodological) 1995;56(1):289–300. [Google Scholar]
- Binkofski F, Buccino G. Motor functions of the Broca’s region. Brain and Language. 2004;89(2):362–369. doi: 10.1016/S0093-934X(03)00358-4. [DOI] [PubMed] [Google Scholar]
- Bird H, Lambon Ralph MA, Patterson K, Hodges JR. The Rise and Fall of Frequency and Imageability: Noun and Verb Production in Semantic Dementia. Brain and Language. 2000;73(1):17–49. doi: 10.1006/brln.2000.2293. [DOI] [PubMed] [Google Scholar]
- Blank SC, Scott SK, Murphy K, Warburton E, Wise RJS. Speech production: Wernicke, Broca and beyond. Brain. 2002;125(8):1829–1838. doi: 10.1093/brain/awf191. [DOI] [PubMed] [Google Scholar]
- Bouvier SE, Engel SA. Behavioral deficits and cortical damage loci in cerebral achromatopsia. Cereb Cortex. 2006;16(2):183–191. doi: 10.1093/cercor/bhi096. [DOI] [PubMed] [Google Scholar]
- Brown R. A First Language: The early stages. Cambridge, MA: Harvard University Press; 1973. [Google Scholar]
- Collins DL, Neelin P, Peters TM, Evans AC. Automatic 3D intersubject registration of MR volumetric data in standardized Talairach space. Journal of Computer Assisted Tomography. 1994;18(2):192–205. [PubMed] [Google Scholar]
- Crinion JT, Warburton EA, Lambon-Ralph MA, Howard D, Wise RJS. Listening to Narrative Speech after Aphasic Stroke: the Role of the Left Anterior Temporal Lobe. Cerebral Cortex. 2006;16(8):1116–1125. doi: 10.1093/cercor/bhj053. [DOI] [PubMed] [Google Scholar]
- Damasio AR. Aphasia. New England Journal of Medicine. 1992;326(8):531–539. doi: 10.1056/NEJM199202203260806. [DOI] [PubMed] [Google Scholar]
- DeArmond SJ, Fusco MM, Dewey MM. Structure of the human brain : a photographic atlas. 2. New York: Oxford University Press; 1976. [Google Scholar]
- Dronkers NF. A new brain region for coordinating speech articulation. Nature. 1996;384(6605):159–161. doi: 10.1038/384159a0. [DOI] [PubMed] [Google Scholar]
- Dronkers NF, Wilkins DP, Van Valin JRD, Redfern BB, Jaeger JJ. Lesion analysis of the brain areas involved in language comprehension. Cognition. 2004;92(1–2):145–177. doi: 10.1016/j.cognition.2003.11.002. [DOI] [PubMed] [Google Scholar]
- Frey RT, Woods DL, Knight RT, Scabini D, Clayworth CC. Defining functional areas with averaged CT scans. Society for Neuroscience Abstracts. 1987;13:1266. [Google Scholar]
- Goodglass H. Understanding Aphasia. San Diego: Academic Press; 1993. [Google Scholar]
- Gorno-Tempini ML, Dronkers NF, Rankin KP, Ogar JM, Rosen HJ, Phenegrasamy L, et al. Cognition and anatomy in three variants of primary progressive aphasia. Annals of Neurology. 2004;55(3):335–346. doi: 10.1002/ana.10825. [DOI] [PMC free article] [PubMed] [Google Scholar]
- Gracco VL, Tremblay P, Pike B. Imaging speech production using fMRI. NeuroImage. 2005;26(1):294–301. doi: 10.1016/j.neuroimage.2005.01.033. [DOI] [PubMed] [Google Scholar]
- Grodzinsky Y. A blueprint for a brain map of syntax. In: Grodzinsky Y, Amunts K, editors. Broca’s Region. New York: Oxford University Press; 2006. [Google Scholar]
- Indefrey P, Brown CM, Hellwig F, Amunts K, Herzog H, Seitz RJ, et al. A neural correlate of syntactic encoding during speech production. Proceedings of the National Academy of Science. 2001;98(10):5933–5936. doi: 10.1073/pnas.101118098. [DOI] [PMC free article] [PubMed] [Google Scholar]
- Indefrey P, Levelt WJM. The spatial and temporal signatures of word production components. Cognition. 2004;92(1–2):101–144. doi: 10.1016/j.cognition.2002.06.001. [DOI] [PubMed] [Google Scholar]
- Jefferies E, Lambon Ralph MA. Semantic impairment in stroke aphasia versus semantic dementia: a case-series comparison. Brain. 2006;129(8):2132–2147. doi: 10.1093/brain/awl153. [DOI] [PubMed] [Google Scholar]
- Kaan E, Swaab TY. The brain circuitry of syntactic comprehension. Trends in Cognitive Sciences. 2002;6(8):350–356. doi: 10.1016/s1364-6613(02)01947-2. [DOI] [PubMed] [Google Scholar]
- Kertesz A. Western Aphasia Battery. New York: Grune & Stratton; 1982. [Google Scholar]
- Knight RT, Scabini D, Woods DL, Clayworth C. The effects of lesions of superior temporal gyrus and inferior parietal lobe on temporal and vertex components of the human AEP. Electroencephalography and Clinical Neurophysiology. 1988;70(6):499–509. doi: 10.1016/0013-4694(88)90148-4. [DOI] [PubMed] [Google Scholar]
- Lee LL. Developmental Sentence Analysis. Chicago, IL: Northwestern University Press; 1974. [Google Scholar]
- MacWhinney B, Snow C. The child language data exchange system. Journal of Child Language. 1985;12(2):271–295. doi: 10.1017/s0305000900006449. [DOI] [PubMed] [Google Scholar]
- Mathworks I. Matlab. Natick, MA: 2002. [Google Scholar]
- Mohr JP, Pessin MS, Finkelstein S, Funkenstein HH, Duncan GW, Davis KR. Broca aphasia: pathologic and clinical. Neurology. 1978;28(4):311–324. doi: 10.1212/wnl.28.4.311. [DOI] [PubMed] [Google Scholar]
- Nishitani N, Schurmann M, Amunts K, Hari R. Broca’s Region: From Action to Language. Physiology. 2005;20(1):60–69. doi: 10.1152/physiol.00043.2004. [DOI] [PubMed] [Google Scholar]
- Okada K, Hickok G. Left posterior auditory-related cortices participate both in speech perception and speech production: Neural overlap revealed by fMRI. Brain and Language. 2006;98(1):112–117. doi: 10.1016/j.bandl.2006.04.006. [DOI] [PubMed] [Google Scholar]
- Paulesu E, Frith CD, Frackowiak RSJ. The neural correlates of the verbal component of working memory. Nature. 1993;362(6418):342–345. doi: 10.1038/362342a0. [DOI] [PubMed] [Google Scholar]
- Saygin AP, Wilson SM, Dronkers NF, Bates E. Action comprehension in aphasia: linguistic and non-linguistic deficits and their lesion correlates. Neuropsychologia. 2004;42(13):1788–1804. doi: 10.1016/j.neuropsychologia.2004.04.016. [DOI] [PubMed] [Google Scholar]
- Saygin AP, Wilson SM, Hagler DJ, Jr, Bates E, Sereno MI. Point-light biological motion perception activates human premotor cortex. Journal of Neuroscience. 2004;24(27):6181–6188. doi: 10.1523/JNEUROSCI.0504-04.2004. [DOI] [PMC free article] [PubMed] [Google Scholar]
- Schiller F. Paul Broca, explorer of the brain. New York: Oxford University Press; 1992. [Google Scholar]
- Schubotz RI, von Cramon DY. Predicting perceptual events activates corresponding motor schemes in lateral premotor cortex: an fMRI study. Neuroimage. 2002;15(4):787–796. doi: 10.1006/nimg.2001.1043. [DOI] [PubMed] [Google Scholar]
- Stowe LA, Broere CA, Paans AM, Wijers AA, Mulder G, Vaalburg W, et al. Localizing components of a complex task: sentence processing and working memory. Neuroreport. 1998;9(13):2995–2999. doi: 10.1097/00001756-199809140-00014. [DOI] [PubMed] [Google Scholar]
- Swaab T, Brown C, Hagoort P. Spoken sentence comprehension in aphasia: Event-related potential evidence for a lexical integration deficit. Journal of Cognitive Neuroscience. 1997;9(1):39–66. doi: 10.1162/jocn.1997.9.1.39. [DOI] [PubMed] [Google Scholar]
- Vandenberghe R, Nobre AC, Price CJ. The Response of Left Temporal Cortex to Sentences. Journal of Cognitive Neuroscience. 2002;14(4):550–560. doi: 10.1162/08989290260045800. [DOI] [PubMed] [Google Scholar]
- Wildgruber D, Ackermann H, Klose U, Kardatzki B, Grodd W. Functional lateralization of speech production at primary motor cortex: a fMRI study. Neuroreport. 1996;7(15–17):2791–2795. doi: 10.1097/00001756-199611040-00077. [DOI] [PubMed] [Google Scholar]
- Willmes K, Poeck K. To what extent can sphasic syndromes be localized. Brain. 1993;116:1527–1540. doi: 10.1093/brain/116.6.1527. [DOI] [PubMed] [Google Scholar]
- Wilson SM, Saygin AP, Sereno MI, Iacoboni M. Listening to speech activates motor areas involved in speech production. Nature Neuroscience. 2004;7(7):701–702. doi: 10.1038/nn1263. [DOI] [PubMed] [Google Scholar]
- Wise RJS, Greene J, Buchel C, Scott SK. Brain regions involved in articulation. The Lancet. 1999;353(9158):1057–1061. doi: 10.1016/s0140-6736(98)07491-1. [DOI] [PubMed] [Google Scholar]
- Wise RJS, Scott SK, Blank SC, Mummery CJ, Murphy K, Warburton EA. Separate neural subsystems within ‘Wernicke’s area’. Brain. 2001;124(1):83–95. doi: 10.1093/brain/124.1.83. [DOI] [PubMed] [Google Scholar]