

Abstract
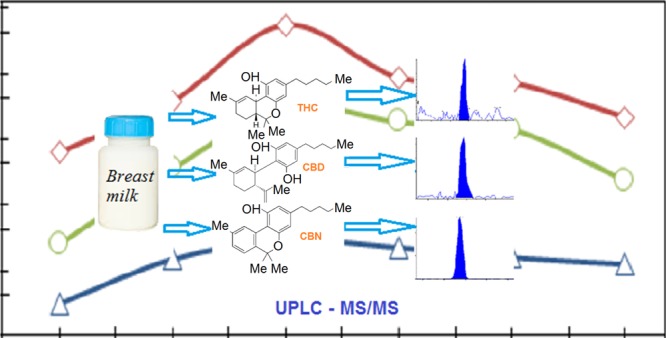
Maternal exposure to marijuana during the lactation period—either active or passive—has prompted concerns about transmission of cannabinoids to breastfed infants and possible subsequent adverse health consequences. Assessing these health risks requires a sensitive analytical approach that is able to quantitatively measure trace-level cannabinoids in breast milk. Here, we describe a saponification–solid phase extraction approach combined with ultra-high-pressure liquid chromatography–tandem mass spectrometry for simultaneously quantifying Δ9-tetrahydrocannabinol (THC), cannabidiol (CBD), and cannabinol (CBN) in breast milk. We demonstrate for the first time that constraints on sensitivity can be overcome by utilizing alkaline saponification of the milk samples. After extensively optimizing the saponification procedure, the validated method exhibited limits of detections of 13, 4, and 66 pg/mL for THC, CBN, and CBD, respectively. Notably, the sensitivity achieved was significantly improved, for instance, the limits of detection for THC is at least 100-fold more sensitive compared to that previously reported in the literature. This is essential for monitoring cannabinoids in breast milk resulting from passive or nonrecent active maternal exposure. Furthermore, we simultaneously acquired multiple reaction monitoring transitions for 12C- and 13C-analyte isotopes. This combined analysis largely facilitated data acquisition by reducing the repetitive analysis rate for samples exceeding the linear limits of 12C-analytes. In addition to high sensitivity and broad quantitation range, this method delivers excellent accuracy (relative error within ±10%), precision (relative standard deviation <10%), and efficient analysis. In future studies, we expect this method to play a critical role in assessing infant exposure to cannabinoids through breastfeeding.
1. Introduction
Marijuana has been increasingly used for medical and recreational activities both globally and domestically.1,2 Worldwide, there were 177 million people aged 15–64 years, who used marijuana at least once in 2012, as reported by the United Nations Office on Drugs and Crime.1 In the United States, an estimated proportion using marijuana in the past month among person ≥12 years old increased from 6.2% in 2002 to 7.5% in 2013.3 As of November, 2016, 26 states and the District of Columbia have legalized medical marijuana use, and 8 states and the District of Columbia have legalized marijuana for recreational use, although both recreational and medical marijuana use remain illegal by federal law in the United States.
Within this context, it is anticipated that the use of marijuana in lactating women is increasing as well.4 Because cannabinoids, marijuana-specific components, for instance, Δ9-tetrahydrocannabinol (THC), cannabidiol (CBD), and cannabinol (CBN) (Figure 1), are highly lipophilic, a certain fraction of absorbed amounts following maternal marijuana exposure will be secreted into breast milk,5,6 resulting in breastfed infants’ exposure to these compounds. This exposure has raised concerns about possible negative impacts on infants’ early growth and neurodevelopment, including attention problems and decreased cognitive function.4,5,7
Figure 1.

Molecular structures of major cannabinoids.
Despite many previous efforts,5,8,9 infant health risks associated with cannabinoid exposure via breast milk remain largely undetermined, precluding evidence-based guidance for medical providers and lactating mothers. Filling this void of actionable public health information requires an efficient analytical approach with sufficient sensitivity to quantitatively measure trace-level cannabinoids in breast milk.
Analytical methods for measuring cannabinoids in breast milk are limited in the literature. Currently, there is only one analytical method available in the open literature in which the researchers proposed a liquid–liquid extraction (LLE) procedure to separate cannabinoids from milk matrix, exhibiting a limit of detection (LOD) of 1.5 ng/mL for THC.10 The simple LLE procedure may provide sufficient sensitivity to measure levels of cannabinoids in those who actively use marijuana for medical or recreational purposes, but may not be suitable for detecting the passive marijuana smoke exposure that lactating mothers may experience. Moreover, false-negative detection of cannabinoids in milk samples from passive or nonrecent past users by the analytical methods with high LODs will underestimate actual infant exposures and associated health risks.
Here, we describe an alkaline saponification–solid phase extraction (SPE) approach to separate cannabinoids from milk matrix. We demonstrate that saponification of the sample is crucial to separate cannabinoids from milk fats and, thus, to obtain the high selectivity and sensitivity essential for quantifying trace-level cannabinoids in breast milk from passive or nonrecent active marijuana exposure. Subsequently, we achieve chromatographic separation using ultra-high-pressure liquid chromatography (UPLC) and detection by tandem mass spectrometry (MS/MS). Additionally, to enable measurement of cannabinoids in breast milk from both active and passive users, we monitor multiple reaction monitoring (MRM) transitions for two naturally occurring analyte isotopes, 13C and 12C, respectively. This combined analysis significantly reduces the burden of sample preparation and facilitates data acquisition. Finally, we demonstrate that this method yields excellent accuracy, precision, linearity, robustness, and most importantly, ultrasensitivity at the picogram level.
2. Results and Discussion
2.1. LLE by a Variety of Solvents
Human milk is a complex mixture composed of thousands of constituents including proteins, lipids, minerals, and many other solids.11 An effective cleanup procedure, separating cannabinoids from milk matrix, is crucial to achieve desired selectivity and sensitivity, especially considering that cannabinoids are highly lipophilic. Early in the method development process, we investigated LLE methods for extracting cannabinoids from milk matrix, and examined the performance of a variety of organic solvents, including hexane, ethyl acetate, acetone, methanol, and acetonitrile (0.5 mL milk sample extracted with 1.5 mL organic solvent, vortex shaking for 10 min for three times at room temperature) (Figure 2). Despite high average preparation efficiencies achieved when using 1.5 mL acidified methanol (5% formic acid) as LLE solvent (Figure 2), none of the solvents, used either alone or combined, provided preparation efficiencies that are able to reach the picogram per milliliter sensitivity level required to evaluate passive cannabinoid exposure. For instance, the average MS spiking IS preparation efficiency (PE) for THC was less than 2.5% (Figure 2). Low PE by direct LLE approaches most likely result from interactions between cannabinoids and various milk constituents (i.e., proteins and fats), and/or potentially heavy ion suppression by co-extracted interferences.
Figure 2.

Performance of LLE by a variety of organic solvents. Abbreviations: ACN, acetonitrile; IPA, isopropanol; DCM, dichloromethane; FA, formic acid.
2.2. Effects of Precipitation Salt and Ion-Pairing Reagent on Sensitivity
Seeking an effective approach to reduce co-extracted interferences and to increase the recovery, we examined the effects of salt protein precipitation and an ion-pairing reagent on sensitivity by adding 250 mg ammonium sulfate and 25 mM dibutylammonium acetate (ion-pairing reagent) separately into two sets of parallel samples. Subsequently, we performed LLE using 1.5 mL of acidified methanol (0.5 mL milk sample, vortex shaking 10 min for three times at room temperature). Unfortunately, these tests yielded no significant improvement in sensitivity (Figure 3).
Figure 3.
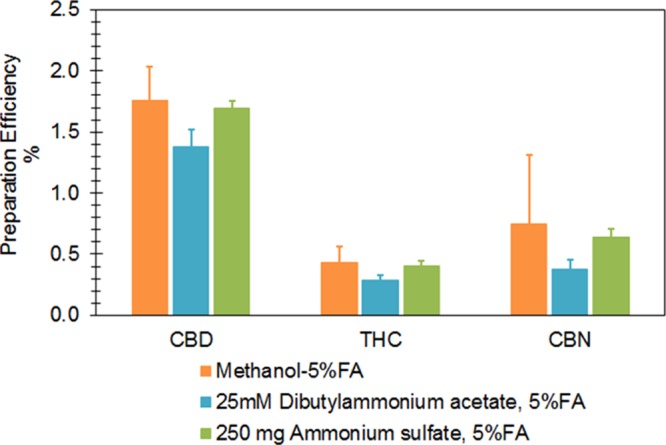
Examination of effects of precipitation salt and ion-pairing reagent on sensitivity. Abbreviation: FA, formic acid.
2.3. Potential Chelation of Cannabinoids to Mineral Ions
We further speculated that the low sensitivity might be a result of potential chelation of cannabinoid molecules to mineral ions (e.g., Ca2+ and Mg2+), as these ions are relatively abundant in human breast milk11 and may have a non-negligible influence on recovery. If this were the case, adding a chelating agent, ethylenediaminetetraacetic acid (EDTA), would improve sensitivity by “freeing” cannabinoids from metal ions by forming stronger chelates with the ions. We then performed LLE with freshly prepared methanol containing 10 mM EDTA-Na2, 50 mM ammonium formate, and 5% formic acid (0.5 mL milk sample, vortex shaking 10 min for three times at room temperature). Despite higher MS spiking IS preparation efficiencies observed for THC and CBD following this approach, preparation efficiencies (Figure 4) for all analytes following these tests were still too low to detect trace-level cannabinoids resulting from passive/light marijuana exposure. We conclude that cannabinoid chelation to mineral ions is not a key factor influencing extraction recovery (ER) and sensitivity.
Figure 4.
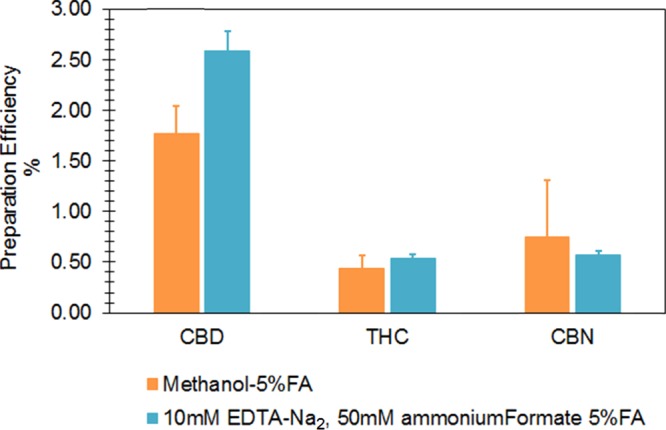
Examination of potential chelation of cannabinoids to mineral ions. Abbreviation: FA, formic acid.
2.4. Evaluation of Protein Digestion on Sensitivity
Before the LLE procedure, we evaluated the effect of protein digestion on sensitivity using proteinase K (10 units/mL in the sample, incubated at 37 °C for 2 h). If cannabinoids bind with milk proteins, this procedure could potentially liberate cannabinoids from proteins, thus increasing ER and sensitivity. After preparing the samples using the LLE procedure (0.5 mL milk sample, 1.5 mL acidified methanol, vortex shaking 10 min for three times at room temperature), we observed even lower IS PE following the protein digestion procedure (Figure 5). The lower efficiency might be caused by several factors: (1) cannabinoids could degrade during the protein digestion procedure; (2) cannabinoids could bind to the proteinase; and/or (3) the digested products could interfere with MS ionization, resulting in ion suppression.
Figure 5.
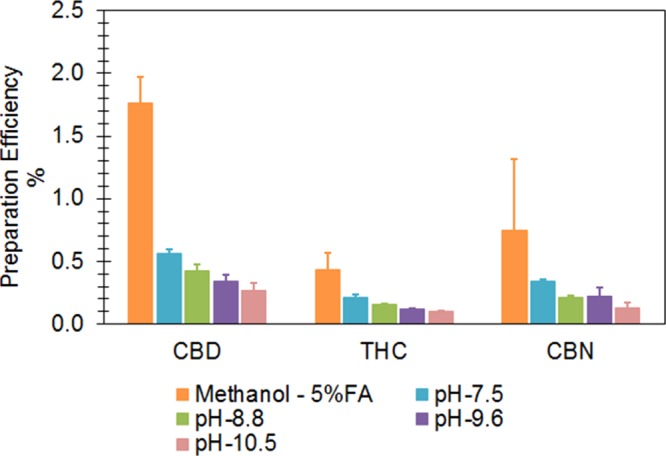
Protein digestion conducted at different pH levels, followed by LLE with 1.5 mL acidified methanol.
2.5. Minimization of the Influences of Lipids on Sensitivity
Given that breast milk contains a large amount of lipids, potentially up to 5% by weight,11 and that cannabinoids are highly lipophilic, we sought to determine whether cannabinoid–lipid binding could be the cause of low sensitivity. We also speculated that formation of esters between cannabinoids and fatty acids could exist in breast milk, resulting in low recovery. To test these hypotheses, we assessed alkaline saponification using methanolic NaOH (details regarding experimental parameters are described in Section 2.6). In contrast to previous tests (Figures 2–5), we observed remarkable improvement in IS PE following saponification (Figure 6). We believe two major mechanisms underlie the improvement in sensitivity and efficiency. First is the conversion of triacylglycerols into water-soluble materials. Triacylglycerols account for >95% of breast milk lipids,11 and their conversion during saponification would reduce any triacylglycerol–cannabinoid binding and also reduce any ion suppression attributable to triacylglycerols. This might be true for similar interferences, as well. The second mechanism is the liberation of cannabinoids from fatty acids during saponification. If formation of esters between cannabinoids and fatty acids exists, the separation of the two, by converting fatty acids into sodium salts, would essentially eliminate the fatty acids from extracts.
Figure 6.
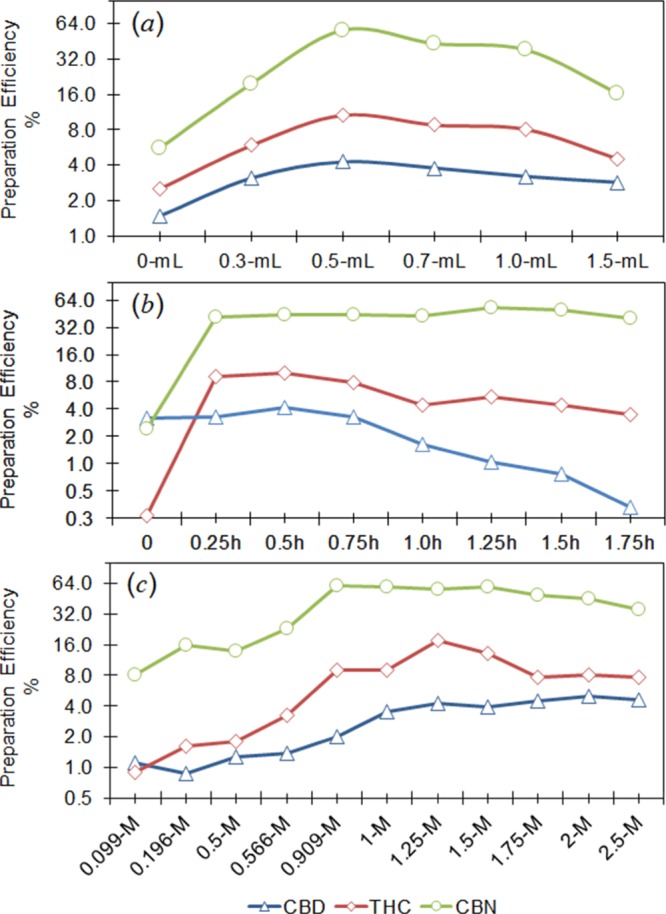
Optimization of saponification conditions. (a) Change in the average PE (%) with the volume of methanol; (b) change in the average PE with saponification duration; and (c) change in the average PE with methanolic NaOH concentration.
2.6. Optimization of Alkaline Saponification
We optimized the saponification procedure by evaluating methanolic NaOH volume/concentration and saponification duration, while maintaining the temperature at 70 °C (Figure 6). We found that adding 0.5 mL of 1.25 M methanolic NaOH into each milk sample and incubating the sample for 30 min at 70 °C provided the highest MS sensitivity. The optimum saponification solution consisted of an approximate sample/methanol ratio of 1.0 and a NaOH concentration of 0.57 M.
2.7. Combined Analysis of Milk Samples with Low and High Concentrations
Because milk samples from recent active users may have concentrations of 12C-analyte isotope far beyond the dynamic linear ranges of our MS detector, highly concentrated samples normally need to be diluted and re-prepared. Inspired by the study reported by Kotandeniya et al.,12 in which they combined the analysis of urinary cotinine and 4-(methylnitrosamino)-1-(3-pyridyl)-1-butanol (NNAL) using naturally occurring 13C-transitions and 12C-transitions, respectively, we simultaneously monitored the 13C-analyte isotopes and used them to quantify high-concentration samples exceeding the linear MS responses for 12C-analyte isotopes to reduce the repetitive analysis rate because MRM transitions for naturally occurring 13C-analytes are at low levels. Although there are a number of studies which reported that the natural abundance of the stable isotopes of carbon, that is, 13C/12C, was approximately constant in various plants and grasses,13 no data are available regarding the ratio of 13C/12C in marijuana plants. Thus, this approach was based on the assumption that the natural abundance of the stable isotopes of carbon, 13C and 12C, is approximately constant. We compared the concentrations quantified on the basis of 12C-transitions with those acquired using 13C-transitions, and we observed excellent agreement between them (Table 2). Because this approach can be used to evaluate both passive and active marijuana exposure, it would significantly reduce the rate of repetitive sample preparation and facilitate sample analysis.
Table 2. MRM Transitions and Mass Spectrometry Settingsa.
| precursor/product ionsb | optimum
MS settings (V) |
|||||
|---|---|---|---|---|---|---|
| analyte | ESI mode | quantitation (Q)/confirmation (C) | DP | CE | CXP | EP |
| THC | + | 315.1 → 193.1 Q | 65 | 31 | 12 | 10 |
| + | 315.1 → 123.1 C | 65 | 43 | 12 | 10 | |
| 13C-THC | + | 316.1 → 194.1 Q | 65 | 31 | 12 | 10 |
| + | 316.1 → 124.1 C | 65 | 43 | 12 | 10 | |
| THC-D3 | + | 318.1 → 196.1 IS | 60 | 32 | 12 | 8 |
| CBD | + | 315.2 → 193.1 Q | 65 | 31 | 12 | 10 |
| + | 315.2 → 259.0 C | 65 | 24 | 12 | 10 | |
| 13C-CBD | + | 316.2 → 194.1 Q | 65 | 31 | 11 | 10 |
| + | 316.2 → 260.0 C | 65 | 24 | 11 | 10 | |
| CBD-D3 | + | 318.2 → 196.2 IS | 50 | 31 | 13 | 8 |
| CBN | – | 309.1 → 279.1 Q | –60 | –44 | –16 | –10 |
| – | 309.1 → 222.1 C | –60 | –58 | –16 | –10 | |
| 13C-CBN | – | 310.1 → 280.1 Q | –60 | –44 | –16 | –10 |
| – | 310.1 → 223.1 C | –60 | –58 | –16 | –10 | |
| CBN-D3 | – | 312.1 → 282.1 IS | –60 | –44 | –16 | –10 |
Abbreviations: ESI, electrospray ionization; DP, declustering potential; CE, collision offset energy; CXP, collision cell exit potential; EP, entrance potential; IS, internal standard.
Two transitions for each native analyte (quantitation/confirmation) and one transition for IS were monitored.
2.8. Performance Evaluation of the Proposed Method
We evaluated method performance and determined LODs and limits of quantitation (LOQs) by preparing and analyzing 20 sets of 7 pools (10, 20, 50, 100, 150, 300, and 500 pg/mL). We first determined the standard deviation (SD) of each pool’s concentration, and then we plotted the SD of each pool against the concentration, and finally obtained S0 given as the Y intercepts. LODs and LOQs, calculated as 3S0 and 10S0, respectively, are presented in Table 3. Figure 7 depicts chromatograms of three samples with concentrations close to LODs. The sensitivity achieved in this method for THC is at least 100-fold higher than literature values (i.e., LOD of 1.5 ng/mL for THC).10 No analytical method is currently available for measuring CBD and CBN in breast milk. For data reporting, we will be consistently using LODs obtained on the basis of 12C-analyte isotopes, although we used 13C-analyte isotopes to quantify high concentrations. We believe the marked increase in sensitivity will play an essential role in quantifying trace-level cannabinoids in breast milk resulting from passive or nonrecent active maternal marijuana exposure in future studies.
Table 3. Method Accuracy, Precision, LOD, LOQ, Average PE, Recovery, ME, and Calibration Rangesa,b.
| intraday |
interday |
|||||||||||||
|---|---|---|---|---|---|---|---|---|---|---|---|---|---|---|
| analyte | target (ng/mL) | measured (ng/mL) | error % | RSD % | measured (ng/mL) | error % | RSD % | efficiency % | recovery % | ME % | calibration range (ng/mL) | R2 | LOD (ng/mL) | LOQ (ng/mL) |
| THC | 0.150 | 0.151 | 0.5 | 2.4 | 0.154 | 2.3 | 3.2 | 8.3 | 21 | 39 | 0.001–50 | >0.999 | 0.013 | 0.043 |
| 25.0 | 25.2 | 0.9 | 3.3 | 25.4 | 1.5 | 2.5 | 7.5 | 21 | 35 | |||||
| 13C-THC | 25.0 | 25.0 | 0.1 | 2.5 | 25.3 | 1.1 | 2.9 | 7.5 | 21 | 36 | 12.5–500 | >0.998 | ||
| 250 | 251 | 0.2 | 0.2 | 245 | –2.2 | 3.1 | 12 | 23 | 53 | |||||
| CBD | 0.300 | 0.313 | 4.3 | 2.2 | 0.291 | –3.0 | 4.7 | 4.4 | 12 | 36 | 0.001–50 | >0.999 | 0.066 | 0.220 |
| 25.0 | 24.7 | –1.4 | 2.3 | 25.0 | 0.0 | 2.3 | 3.1 | 9.4 | 33 | |||||
| 13C-CBD | 25.0 | 24.9 | –0.6 | 1.9 | 25.0 | 0.2 | 1.7 | 3.1 | 9.6 | 32 | 12.5–500 | >0.998 | ||
| 250 | 246 | –1.8 | 1.7 | 239 | –4.5 | 3.3 | 4.7 | 11 | 43 | |||||
| CBN | 0.150 | 0.155 | 3.0 | 2.5 | 0.156 | 4.3 | 2.6 | 61 | 47 | 129 | 0.001–50 | >0.999 | 0.004 | 0.014 |
| 25.0 | 25.1 | 0.5 | 0.8 | 25.6 | 2.4 | 3.1 | 43 | 39 | 112 | |||||
| 13C-CBN | 25.0 | 25.2 | 0.9 | 1.3 | 25.7 | 2.6 | 3.4 | 48 | 38 | 128 | 12.5–500 | >0.998 | ||
| 250 | 252 | 0.7 | 0.5 | 242 | –3.2 | 4.3 | 47 | 60 | 78 | |||||
Unit: ng/mL.
Abbreviations: LOD, limit of detection; LOQ, limit of quantitation; RSD, relative standard deviation; R2, correlation coefficient of calibration plots.
Figure 7.

Representative chromatograms of milk samples with concentrations close to LODs.
We used three sets of samples at low, medium, and high concentrations to determine optimized extraction recoveries, matrix effects (MEs), and sample PE. Average extraction recoveries ranged from 9.4 to 60%, sample PE was in the range of 3.1–61%, and the ion suppression due to the ME varied from −67 to 29% (Table 3). Basically, we noticed that the recovery and ME at low, medium, and high levels for THC, CBD, and CBN were of comparable magnitudes, for example, PE for THC is in the range from 7.5 to 8.3%. Compared to lower concentrations, these measures (matrix effect and recovery) at higher concentrations are less important because there are no detection issues at higher concentrations. Considering there are few data available in the literature to get reliable ranges of milk concentrations in general population, we used a high concentration of 250 ng/mL as a representative level to obtain the average values of recovery, ME, and sample PE in this study, although a level of 500 ng/mL was applied as the upper calibration end. A high upper calibration level will be helpful to reduce the repetitive rates of sample preparation and analysis.
The biggest challenge we met when developing this analytical method was that cannabinoids are highly lipophilic, and they can bind to lipids in human milk very tightly. After reviewing the literature, we only identified one study using the LLE method to separate THC from milk matrix.10 We examined the LLE method, and found it could not effectively extract the analytes from milk matrix, although it still worked for samples from active users as they had high concentrations, for example, above 1.0 ng/mL. We examined kinds of tests as described in the article and found that alkaline saponification of the milk samples is the only effective way to obtain high sensitivity that is indispensable for quantifying the concentrations of cannabinoids in milk samples from those persons exposed to second-hand marijuana smoke. Although the recovery and efficiency are low, this is the best method that can be achieved currently. We are continuously investigating whether there will be alternative approaches available in future, so as to improve the recovery, efficiency, and ME.
Finally, we evaluated the accuracy and precision of the proposed method by conducting replicate analyses of QC samples over 12 consecutive weeks. The validation results show excellent interday and intraday accuracy (within ±10%) and imprecision (<10%) (Table 3).
3. Experimental Methods
3.1. Chemicals and Materials
We purchased high-purity methanol (≥99.9%), 2-propanol (≥99.9%), formic acid (≥99.5%), and ammonium formate (≥99%) from Fisher Scientific (Fair Lawn, NJ). We purchased liquid chromatography–mass spectrometry (LC–MS) grade water (J.T. Baker, ≥99.9%) and acetonitrile (Burdick & Jackson, ≥99.9%) from VWR (Radnor, PA). We purchased ammonium sulfate, sodium hydroxide (NaOH), ethylenediaminetetraacetic acid disodium salt dehydrate (EDTA-Na2), and 0.5 M dibutylammonium acetate from Sigma-Aldrich Laboratories, Inc. (St. Louis, MO). We purchased native and isotopically labeled standards, including THC, THC-d3, CBD, CBD-d3, CBN, and CBN-d3 from Cerilliant (Round Rock, TX). We bought the SPE (C18, 100 mg) column and 96-well plate from Phenomenex (Torrance, CA). All chemicals were used without further purification.
3.2. Standard Solution Preparation
Human breast milk purchased from BioreclamationIVT (New York) was screened and used as blank matrix for calibration and quality control (QC) samples. The CDC Human Subjects Review Board determined that the use of breast milk from anonymous individuals for method development was not human subject research.
We prepared working solutions for calibrators and QC samples from serial dilutions of primary stock solutions with 60% methanol in water and stored these solutions in Teflon-capped amber glass vials at −24 °C. Calibrators (0.001–500 ng/mL) and QC samples (0.15, 25, and 250 ng/mL) were created by spiking 50 μL of each working solution into 500 μL of milk pool. Concentrations for THC-d3, CBD-d3, and CBN-d3 in the internal standard (IS) spiking solution were 0.01, 0.03, and 0.01 ng/μL, respectively.
3.3. Sample Preparation
We prepared calibrators, QC samples, batch blanks, and unknown samples following the same procedures. First, milk samples stored at temperatures ≤−65 °C were thawed and gently vortex-mixed for 5 min at room temperature. A sample volume of 0.50 mL was transferred to each 2.0 mL microcentrifugation vial, followed by the addition of 50 μL of calibrator and QC working solutions to each sample. Working solutions were replaced with water for blanks and unknown samples. Then, 50 μL of IS solution and 0.50 mL of 1.25 M methanolic NaOH were added to each vial. After gentle mixing, the vials were incubated at 70 °C for 15 min, mixed a second time, and then incubated for an additional 15 min at 70 °C. After cooling and equilibrating at 4 °C for 1 h, samples were gently vortex-mixed and centrifuged for 30 min at −6 °C, and then approximately 0.90 mL of clear solution was transferred into a 96-deep well plate in order. After adding 0.4 mL of water into each well and gentle mixing, samples were loaded onto a 96-well SPE plate, preconditioned with 1.0 mL of methanol and 1.0 mL of water. After soaking for 15 min, the mixtures were pushed through the SPE under approximately 1.0 psi positive pressure. Samples were subsequently washed with 1.0 mL of water and 1.0 mL of methanol and water (v/v: 60:40). After drying for 15 min with nitrogen (25 psi), 1.0 mL of methanol was added to each sample. Then, the eluent was collected in a second 96-well plate and dried using nitrogen on a TurboVap evaporator (Biotage, Charlotte, NC) at room temperature. The residuals were reconstituted in 50 μL of methanol and water (v/v: 50:50), and 10 μL of each sample was injected into the UPLC system.
3.4. Instrumentation and Operation
We used a Shimadzu UPLC system (Columbia, MD) with a Kinetex reversed-phase column (100 mm × 2.1 mm, particle size 2.6 μm, C18) (Phenomenex, Torrance, CA) to achieve chromatographic separation. The gradient program contained 5.0 mM of ammonium formate with 0.05% formic acid (solvent A), and 100% acetonitrile (solvent B). We maintained the column flow rate at 0.4 mL/min and the temperature at 40 °C throughout the analysis. To minimize MS contamination, we directed the LC flow during the first 2.75 min and the last 1.5 min to a waste container, using the incorporated switching valve on MS, and only allowed the flow occurring between 2.75 and 4.5 min to the MS. Detailed gradient elution programs are shown in Table 1.
Table 1. UPLC Gradient Elution Program.
| time | module | event | parameter |
|---|---|---|---|
| 0.01 | system controller | start | |
| 1.20 | pumps | %B | 40 |
| 2.50 | pumps | %B | 75 |
| 3.00 | pumps | %B | 75 |
| 4.50 | pumps | %B | 96 |
| 5.50 | pumps | %B | 96 |
| 5.51 | pumps | %B | 40 |
| 7.50 | system controller | stop |
We performed MS/MS analysis using a Sciex triple quadrupole 6500 with a TurboIonSpray source (Foster City, CA). We used positive electrospray ionization (ESI+) mode to acquire MRM transition data for THC and CBD, and ESI– mode for CBN. Because the MS response of some 12C-analyte isotopes may exceed the dynamic linear response of our MS detector, we also monitored naturally occurring 13C-analyte isotopes. If the response of the 12C-isotope exceeded the linear response of the MS, the 13C-isotope was used for quantification. Monitoring of 13C-isotopes allowed quantification of samples that would have required dilution and repeat preparation for quantification using the 12C-analyte isotopes. Two MRM transitions for each native analyte and one transition for the isotope labeled IS were simultaneously monitored. Optimum MS source parameters were as follows:
Source temperature: 600 °C.
Ionspray voltage (ESI+/ESI–): 5500/–4500 V.
Ion source gas-1: 80 psi.
Ion source gas-2: 90 psi.
Curtain gas: 35 psi.
Target scan time (ESI+/ESI–): 0.19/0.18 s.
Detailed MRM transitions and voltage settings are shown in Table 2.
3.5. Determination of ER, Overall Efficiency, and ME
We determined ER, ME, and sample PE using three sets of samples at low (0.15 ng/mL for THC and CBN; 0.30 ng/mL for CBD), medium (25 ng/mL), and high (250 ng/mL) concentrations, as described elsewhere.14 In the first set, seven blank samples were fortified with native and deuterated IS solutions at the beginning of the sample preparation. In the second set of seven blank samples, spiking solutions were added immediately before LC injection. The third set of seven samples were prepared by spiking native and IS solutions in methanol and water (v/v: 50:50). The ER, ME, and PE values were calculated as follows
where A, B, and C were average peak areas of set 1, set 2, and set 3, respectively (Table 3).
3.6. Software for Data Acquisition
We used Analyst software (version 1.6.2) to acquire the chromatogram and quantify the concentration. Calibration curves were constructed using peak area ratios of analytes to the corresponding ISs for each batch via linear least-squares regression with a 1/x weighting factor.
Acknowledgments
This work was funded by the U.S. Centers for Disease Control and Prevention (CDC). We thank Nancy Maddox for her valuable comments.
The authors declare no competing financial interest.
References
- UNODC (United Nations Office on Drugs and Crime) . World Drug Report, 2014.
- Azofeifa A. National estimates of marijuana use and related indicators—national survey on drug use and health, United States, 2002–2014. MMWR Surveill. Summ. 2016, 65, 1. 10.15585/mmwr.ss6511a1. [DOI] [PubMed] [Google Scholar]
- SAMHSA . Results from the 2013 National Survey on Drug Use and Health: Summary of National Findings, 2014.
- Metz T. D.; Stickrath E. H. Marijuana use in pregnancy and lactation: a review of the evidence. Am. J. Obstet. Gynecol. 2015, 213, 761–778. 10.1016/j.ajog.2015.05.025. [DOI] [PubMed] [Google Scholar]
- Jaques S. C.; Kingsbury A.; Henshcke P.; Chomchai C.; Clews S.; Falconer J.; Abdel-Latif M.; Feller J.; Oei J. Cannabis, the pregnant woman and her child: weeding out the myths. J. Perinatol. 2014, 34, 417–424. 10.1038/jp.2013.180. [DOI] [PubMed] [Google Scholar]
- Huestis M. A. Human cannabinoid pharmacokinetics. Chem. Biodiversity 2007, 4, 1770–1804. 10.1002/cbdv.200790152. [DOI] [PMC free article] [PubMed] [Google Scholar]
- Astley S. J.; Little R. E. Maternal marijuana use during lactation and infant development at one year. Neurotoxicol. Teratol. 1990, 12, 161–168. 10.1016/0892-0362(90)90129-Z. [DOI] [PubMed] [Google Scholar]
- Perez-Reyes M.; Wall M. Presence of delta9-tetrahydrocannabinol in human milk. N. Engl. J. Med. 1982, 307, 819–820. 10.1056/NEJM198209233071311. [DOI] [PubMed] [Google Scholar]
- Gray T.; Huestis M. Bioanalytical procedures for monitoring in utero drug exposure. Anal. Bioanal. Chem. 2007, 388, 1455–1465. 10.1007/s00216-007-1228-9. [DOI] [PMC free article] [PubMed] [Google Scholar]
- Marchei E.; Escuder D.; Pallas C. R.; Garcia-Algar O.; Gómez A.; Friguls B.; Pellegrini M.; Pichini S. Simultaneous analysis of frequently used licit and illicit psychoactive drugs in breast milk by liquid chromatography tandem mass spectrometry. J. Pharm. Biomed. Anal. 2011, 55, 309–316. 10.1016/j.jpba.2011.01.028. [DOI] [PubMed] [Google Scholar]
- Picciano M. F. Nutrient composition of human milk. Pediatr. Clin. North Am. 2001, 48, 53–67. 10.1016/S0031-3955(05)70285-6. [DOI] [PubMed] [Google Scholar]
- Kotandeniya D.; Carmella S. G.; Ming X.; Murphy S. E.; Hecht S. S. Combined analysis of the tobacco metabolites cotinine and 4-(methylnitrosamino)-1-(3-pyridyl)-1-butanol in human urine. Anal. Chem. 2015, 87, 1514–1517. 10.1021/ac504047j. [DOI] [PMC free article] [PubMed] [Google Scholar]
- Bender M. M. Mass spectrometric studies of carbon 13 variations in corn and other grasses. Radiocarbon 1968, 10, 468–472. 10.1017/S0033822200011103. [DOI] [Google Scholar]
- Matuszewski B. K.; Constanzer M.; Chavez-Eng C. Strategies for the assessment of matrix effect in quantitative bioanalytical methods based on HPLC-MS/MS. Anal. Chem. 2003, 75, 3019–3030. 10.1021/ac020361s. [DOI] [PubMed] [Google Scholar]