Abstract
Frequency domain near infrared spectroscopy (FD-NIRS) and diffuse correlation spectroscopy (DCS) have emerged as synergistic techniques for the non-invasive assessment of tissue health. Combining FD-NIRS oximetry with DCS measures of blood flow, the tissue oxygen metabolic rate can be quantified, a parameter more closely linked to underlying physiology and pathology than either NIRS or DCS estimates alone. Here we describe the first commercially available integrated instrument, called the “MetaOx”, designed to enable simultaneous FD-NIRS and DCS measurements at rates of 10 + Hz, and offering real-time data evaluation. We show simultaneously acquired characterization data demonstrating performance equivalent to individual devices and sample in vivo measurements of pulsation resolved blood flow, forearm occlusion hemodynamic changes and muscle oxygen metabolic rate monitoring during stationary bike exercise.
OCIS codes: (120.4640) Optical instruments, (120.6200) Spectrometers and spectroscopic instrumentation, (170.1470) Blood or tissue constituent monitoring
1. Introduction
Diffuse optical methods that rely on the deep penetration of near infrared light in biological tissues have emerged as useful non-invasive tools to monitor tissue physiology. Oxy- and deoxy- hemoglobin species (HbO, HbR) are the dominant tissue chromophores in the low absorption so-called “near-infrared window” (~650-900 nm), allowing the quantification of total hemoglobin content (HbT, closely linked to tissue blood volume) and hemoglobin oxygen saturation (SO2). If measurements are acquired at several wavelengths, including some in the >800 nm range, the concentration of additional chromophores such as water, lipids and cytochrome c can be determined as well [1–3]. Quantitative measurements require the disentangling of absorption and scattering effects. To this end, the most commonly used approaches have been the frequency domain method (FD-NIRS) [4–6], where both the amplitude and phase of diffusely reflected RF modulated light are measured, as well as the time domain method (TD-NIRS) [7,8] based on characterizing the broadening of a short pulse of light that has traveled through tissue. Wide ranging applications of quantitative imaging and spectroscopy have been reported in the context of breast cancer [9,10], brain health and function [11–13], muscle physiology [14] and beyond.
In parallel, over the last two decades, a complementary optical technique, termed diffuse correlation spectroscopy (DCS) has been developed [15,16]. DCS uses the temporal fluctuations of diffusely reflected light to quantify the motion of tissue scatterers, which are primarily red blood cells. DCS can thus quantify tissue blood flow, and has been validated against a number of established perfusion measurement methods [17–23]. While DCS has been used on its own, for example to characterize blood flow in breast tumors [24] or brain functional activation [25–27], the combination with NIRS is particularly synergistic. By combining oximetry and flow measures, the tissue oxygen metabolic rate (MRO2) can be quantified, a parameter closely linked to underlying physiology and pathological states [2,21]. This measure is of particular importance when applied to the brain (cerebral MRO2, i.e. CMRO2) given the strong dependence of this organ on aerobic metabolism [28]. A large number of studies involving combined NIRS-DCS measurements for CMRO2 assessment have been reported in the context of clinical neuromonitoring, neonatal development and brain functional studies [29,30].
Clearly, combining NIRS and DCS technologies into a single instrument capable of taking both measurements in parallel, with a unified user interface could benefit the further development of this research field. Such integration requires solving issues of interference between the two laser sources and the respective detection systems, as well as the synchronization of the measurements. At the same time, real-time feedback about the measurement quality can help the operator obtain useful data, especially under the time constrained conditions typical of clinical applications.
Here we present one implementation of such an instrument resulting from a collaboration between ISS Inc. of Champaign, IL and the Massachusetts General Hospital. We describe the design rationale and characteristics of the “MetaOx” instrument and show simultaneous operation performance data similar to previous standalone FD-NIRS and DCS instruments. We also report demonstrative data from simultaneous measurements during a forearm arterial occlusion protocol on healthy volunteers, pulsation resolved blood flow monitoring on the forehead, and muscle oxygen metabolism rate monitoring during exercise on a stationary bike.
2. Instrument design
The overall design goal was to integrate FD-NIRS and DCS devices in a single instrument housing with a unified user interface, enabling quantification of hemoglobin oxygenation, tissue blood flow, and tissue oxygen metabolism.
2.1 FD-NIRS
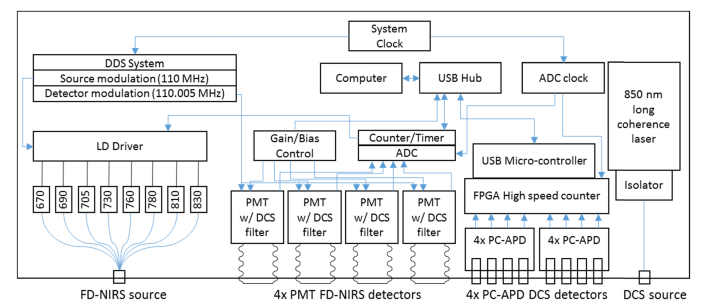
The design of the FD-NIRS component was based on previous frequency domain spectrometers developed by ISS Inc., with several improvements aimed at optimal performance. As shown in Fig. 1, the instrument provides a multi-wavelength source and 4 detectors, enabling optical property quantification by the frequency domain multi-distance (FD-MD) method [4]. While a 2 source and 2 detector design can also be used to create a four separation measurement at lower cost [31], the 1 source, 4 detector approach allows a simplified gain setting procedure and enables a larger dynamic range.
Fig. 1.
Instrumentation diagram detailing functional blocks for both the FD-NIRS and DCS subsystems.
On the source side, the light from 8 individual laser diodes is combined by means of a 2.5 mm diameter 8-into-1 optical fiber bundle and brought to the instrument front panel into an SMA connector. The laser diodes are modulated at 110 MHz (adjustable) using a direct digital synthesis system, and emit at 670, 690, 700, 730, 760, 780, 810 and 830 nm, 2-5 mW on average. The instrument provides 4 photo-multiplier tube (PMT) based detectors, using Hamamatsu R9880U-01 PMTs with quantum efficiency of up to 15% and an active area diameter of 8 mm.
The FD-NIRS laser diodes are illuminated in a time multiplexed fashion, typically on for 12.5 ms each, offering a 10 Hz total acquisition rate. A brief dark period is included in each cycle to evaluate the amount of non-modulated light leakage (e.g. room light and DCS laser light). The PMT gain is modulated at 110.005 MHz, resulting in 5 kHz intermediate frequency demodulated signals that are digitized using an IOTech Daq3000 USB 16 bit card, operating at a 1MHz overall sampling rate (this card also provides counter/timer functions, and they are used to control the source time multiplexing). AC and DC amplitudes, as well as phase values are provided for each combination of FD-NIRS emitter and detector. The typical FD-NIRS SNR is at least 300, the phase noise at 1 Hz is <0.5 degrees, while the new PMTs together with optimizations in the dynode circuit enable a typical modulation depth of 70%, significantly higher than the 50% figure achieved by previous FD-NIRS instruments from ISS [32].
2.2 DCS
As shown in Fig. 1, the DCS device uses one long-coherence laser source based on an 850 nm diode-pumped solid state laser from Crystalaser, Inc. (DL850-100S). The power available at the front panel connector is <60 mW. Detection is provided by 8 photon counting APD based detectors (2x Excelitas SPCM-AQ4C 4-channel modules) with ~40% total photon detection efficiency at 850 nm and a circular active area of 170 microns diameter. Photon counting pulses are received by a hi-speed FPGA-based photon counting board with 200 ns timing resolution and >30 Mcps counting ability. The pulses are then relayed to the host computer for further processing in software using a multi-tau scheme with symmetric normalization[37,38], allowing a flexible auto-correlation curve computation rate (>20 Hz can be easily achieved while maintaining real-time display on a laptop with a Core i7 mobile processor). Of note, the maximum practical count rate is limited by the APDs used in this system, which have a deadtime of up to 25 ns.
2.3 System integration, user interface and data analysis
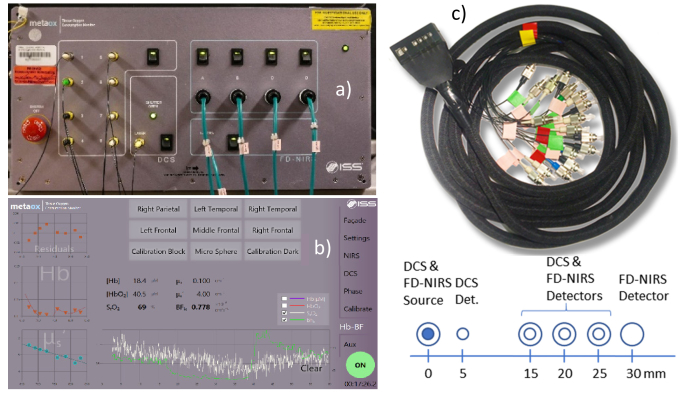
The FD-NIRS and DCS devices are housed in a single chassis, sharing a power supply and external USB connection (Fig. 2). Four auxiliary analog input channels are provided using the IOTech DAQ card to enable recording signals from additional devices, such as clinical monitors. To enable simultaneous operation, a short-pass filter was used in front of the FD- NIRS PMTs to block DCS laser light. No filter was needed in front of the DCS photon counting APDs because the DCS laser power was approx. 20 times higher than the FD-NIRS lasers and the impact of NIRS light on the DCS signals was negligible as long as the FD-NIRS and DCS sources were co-located. The system is controlled from a unified touch screen user interface that, in addition to multi-location measurement acquisition, allows selective power up of the component devices, provides real time feedback on the signal levels as well as the level of room-light interference, provides real-time DCS auto-correlation curves, and automates FD-NIRS calibration. The measurement interface provides real-time optical properties, total hemoglobin and hemoglobin oxygen saturation, as well as the DCS blood flow index computed using the actual optical properties measured by the FD-NIRS device extrapolated to the DCS wavelength (as seen in Fig. 2(b)). Figure 2(c) shows a typical flat profile 3D printed probe that uses prisms to allow the optical fibers to run parallel to the tissue surface. For this article we employed a probe featuring co-located DCS and FD-NIRS source fibers, a DCS detector fiber at 5 mm separation, co-located DCS and FD-NIRS detector fibers/fiber bundles at 15, 20 and 25 mm separation, and an FD-NIRS only detector fiber bundle at 30 mm separation. All FD-NIRS optodes used 2.5 mm fiber bundles while the DCS source used a 200 micron multi-mode fiber, and the DCS detectors used 5.6 micron core single mode fibers. 2 and 4 DCS single mode fibers were inserted at the 20 and 25 mm separation locations, respectively, to take advantage of all 8 available detectors.
Fig. 2.
(a) Instrument photograph and (b) user interface measurement tab screenshot (c) Photograph and schematic of the optical probe used for the measurements reported in this article.
FD-NIRS analysis
The frequency domain multi-distance method [4,33] is used to compute optical properties from the slope of the AC amplitude and phase vs. source-detector distance. The dependence on the source detector separation of the measured AC amplitude (IAC) as well as the phase (φ) of the diffusely reflected light is assumed to be described by the following equations:
| (1) |
| (2) |
where SAC, and Sφ are the slopes characterizing the relationship between the source-detector separation r and ln(r2IAC) and φ, respectively, and depend on the optical properties µa, µs’. CAC and Cφ are constants independent of r. Under the assumption that , the optical properties are obtained as:
| (3) |
| (4) |
where ω is the modulation frequency of the light sources and ct is the speed of light in tissue. The µa(λ) values calculated from Eq. (4) are then corrected for water absorption to obtain the hemoglobin driven absorption coefficient: µaw(λ) = µa(λ)-Cwater εwater(λ) where Cwater is the water fraction and εwater(λ) is the wavelength dependent water extinction coefficient,. The water fraction is set as a parameter by the user. In vivo measurements shown in this article assumed a water fraction of 0.7.
To determine the oxy- (HbO) and deoxy-hemoglobin (HbR) concentrations we assume that µaw(λ) = CHbO ε,HbO(λ) + CHbR ε,HbR(λ), or in matrix form:
| (5) |
where µaw = (µaw(λ1);…; µaw(λn)) is the vector containing the water-corrected absorption coefficient values at the instrument wavelengths, C = (C,HbO, C,HbR) is a column vector reflecting the concentration of the hemoglobin species, and:
| (6) |
is a matrix containing the absorption spectra of the hemoglobin species at the measurement wavelengths. Finally, by inverting Eq. (5) we obtain:
| (7) |
DCS analysis
The DCS measurements are analyzed using the semi-infinite medium correlation diffusion equation [34]:
| (8) |
where , is the probability of scattering from a moving scatterer, is the wavenumber at the DCS wavelength, ,,and (for a tissue refractive index of 1.35). Note that we measure experimentally the normalized temporal intensity auto-correlation function, g2(τ), related to the normalized field auto-correlation function g1(τ) through the Siegert relation (β is a factor dependent on the characteristics of the light collection system):
| (9) |
As has been the practice in DCS studies, we modeled the motion of scatterers as diffusive, , where D is the effective diffusion coefficient and employed the product αD as a DCS blood flow index (BFi). We will use the BFi notation for the rest of this manuscript, noting that for the phantom measurements presented below, , the Brownian diffusion coefficient, while for the tissue measurements, BFi is representative of blood flow as validated in numerous studies[2], likely driven by the shear-induced diffusion of red blood cells[35].
Optical properties from the FD-NIRS subsystem are used to derive real-time estimates of absorption and scattering at the DCS wavelength. The absorption is derived from the calculated hemoglobin concentration, the assumed water fraction and their known extinction coefficients at 850 nm for tissue data, and from an extrapolated linear fit for phantom data. Scattering is fit to a linear decay with wavelength, and extrapolated to 850 nm.
3. Characterization data
System performance testing has been conducted using liquid phantoms and the multi-distance dual FD-NIRS and DCS fiber optic probe described in Section 2.2. Separations of 1.5, 2, 2.5, and 3 cm were used for FD-NIRS, and 0.5 (one fiber), 1.5 (one fiber), 2 (two fibers), and 2.5 cm (four fibers) were used for DCS. The liquid phantoms were made using Intralipid and India Ink for absorption and scattering titrations, and using a polystyrene microsphere suspension for diffusion coefficient measurements.
3.1 FD-NIRS characterization
Absorption titration
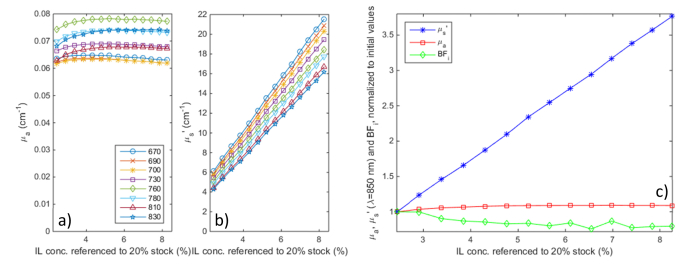
A liquid phantom was made by mixing 20% intralipid suspension with water to achieve a scattering coefficient of ~6/cm at 830 nm. There was initially no absorption (beyond the water itself). Progressive amounts of diluted India Ink were then added to increase optical absorption. The beaker holding the phantom was stirred using a magnetic stirrer after every ink step, and the phantom was allowed to come to rest for about 90 seconds before taking a measurement (monitored by following the return of the DCS BFi to baseline levels).
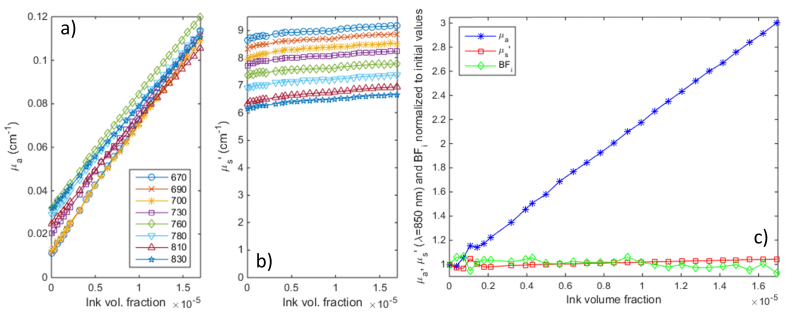
Titration results are shown in Fig. 3 above: as the ink concentration was increased, absorption values correlate with excellent linearity to the ink concentration, with an offset due to water absorption (see below). The cross talk into scattering and DCS BFi is very small, just ~8.5% for scattering and ~7% for BFi for a 600% increase in absorption vs. baseline values.
Fig. 3.
Absorption titration results. a) absorption and b) scattering values at all 8 wavelengths as India Ink was added to a diluted Intralipid solution; c) normalized changes in absorption and scattering at 850 nm and the DCS blood flow index (at 2.5 cm separation, computed based on optical properties extrapolated to 850 nm) during the titration.
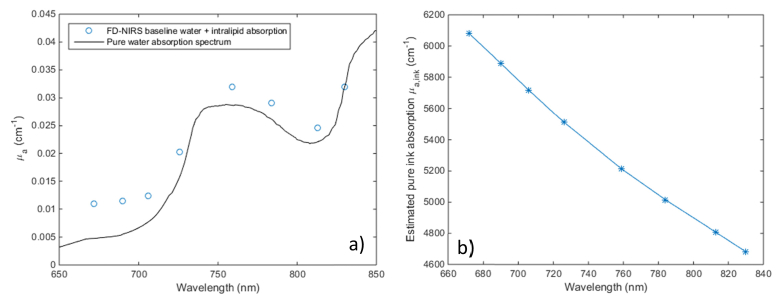
Figure 4 below displays the absorption measured for the Intralipid – water mixture before ink was added, as well as the ink extinction coefficients from the titration. While the measured absorption values are somewhat higher than expected based on literature values of water absorption [36] (in particular at the shorter wavelengths where the water absorption is particularly low), they closely follow the water spectrum. The recovered ink extinctions coefficients, shown in Fig. 4(b), agree well (within 10%) with literature data [39], given the expected batch to batch and manufacturer to manufacturer variation of commercial ink.
Fig. 4.
a) Comparison of baseline Intralipid-water solution measured absorption before adding India Ink vs. literature values for the absorption spectrum of pure water; b) Estimated pure ink absorption
Scattering titration
A liquid phantom was made by mixing 20% intralipid with water to achieve ~4/cm scattering at 830 nm and India Ink was added to an absorption of ~0.07/cm at 830 nm. Additional amounts of 20% intralipid were added until scattering increased to 340% of the initial value.
Figure 5 displays the scattering titration results. The variation of scattering coefficients with intralipid concentration displays excellent linearity as the scattering increases to nearly 3.5 times its the initial value, a range beyond the what is typically encountered in biological tissues. The crosstalk into absorption is minimal (up to 8% over the entire range), while the DCS BFi decreases up to 20%. This can be explained by a combination of overestimating the scattering increase (the recovered scattering change is + 260% while the actual intralipid concentration was increased by 240%), as well as potential lipid particle aggregation at higher concentrations. Nevertheless, the BFi error is small in comparison to the scattering increase during the titration.
Fig. 5.
Scattering titration results. a) absorption and b) scattering values at all 8 wavelengths as 20% concentrated Intralipid was added to a diluted Intralipid + India Ink solution; c) normalized changes in absorption and scattering at 830 nm and the DCS blood flow index (at 2.5 cm separation, computed based on optical properties extrapolated to 850 nm) during the titration.
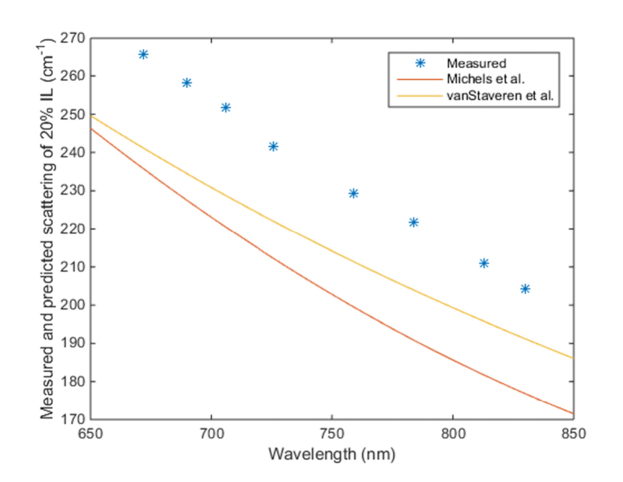
Figure 6 displays the extrapolated scattering coefficient of “pure” 20% Intralipid from our titration measurements vs. previous literature values from Michels et al. [40] and vanStaveren et al. [41] (scaled up from 10% Intralipid). Our measurements are 5-12% higher than these literature values, but they could still be considered in good agreement given some variation is expected between batches of Intralipid, especially as the cited references were published by European groups one and two decades ago, respectively.
Fig. 6.
Estimated scattering coefficient of 20% Intralipid solution compared to literature values.
3.2 DCS characterization
We used a polystyrene microsphere suspension with an average particle diameter of 1.73 microns. We slowly varied the temperature from near freezing to 26 degrees C, while continuously recording the temperature. We kept the heating rate to 1 degree every 3 minutes, to keep natural convection effects to a negligible level. Figure 7 shows the plot of the DCS BFi vs temperature, together with the expected values calculated from the Brownian motion equation [42]:
Fig. 7.
Brownian motion variation as a microsphere suspension was warmed up from 0 to 26 deg. C. a) Measured vs predicted blood flow index, b) Absorption and c) Scattering vs. temperature.
| (10) |
Water viscosity was estimated using the Vogel Eq. where, A = −3.7188, B = 578.919, C = −137.546 and T is the absolute temperature.
The absolute value of the DCS BFi, here equal to the Brownian diffusion coefficient, matches our measurements corresponding to the 2.5 cm DCS source detector separation remarkably well. For example, at a temperature of 20 degrees C, we predict BFi = Db = 2.5 x 10⁻⁹ cm2/s and we measure 2.66 x 10⁻⁹ cm2/s, a difference of only 6%. Note that this is computed using the actual measured optical properties of the liquid phantom. The optical properties remain relatively stable over the temperature range, with up to 20% increase in absorption and 3% increase in scattering. While an increase in water absorption with temperature of up to ~0.6%/degree can be expected [43], our changes are somewhat higher. This could be explained by an underestimation of the baseline absorption. The slight scattering increase observed might reflect the thermal expansion of the polysterene microspheres (70 ppm/degree).
3.3 Instrument stability and cross-talk
We recorded data for 12 hours on a water-intralipid phantom similar to the baseline used for the absorption titration. We also recorded the phantom temperature. Once the temperature stabilized (about 20 minutes after the measurements were initiated), there was no observable drift (<0.5%) in absorption, scattering or diffusion coefficient. On the same phantom, we turned on and off the FD-NIRS and DCS lasers, respectively, and did not observe any measurable changes in BFi (assuming fixed optical properties) or in absorption and scattering, respectively.
4. In vivo example data
4.1 Forearm occlusion
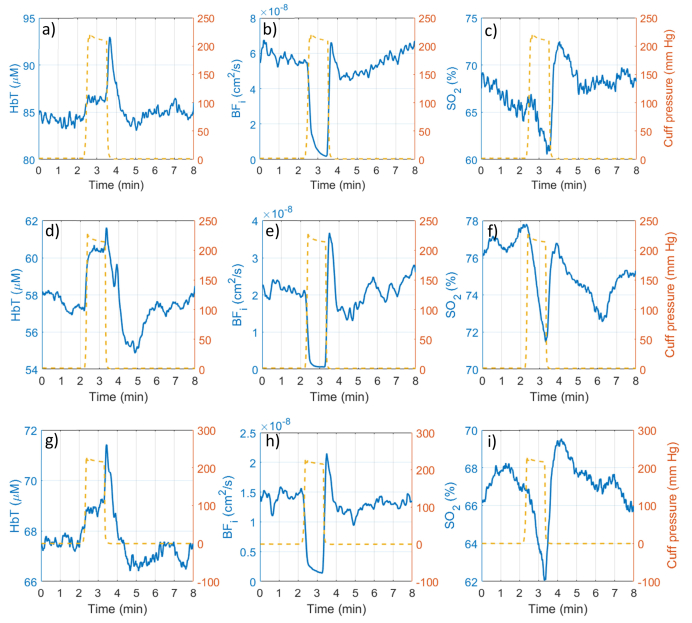
To demonstrate the simultaneous operation of the FD-NIRS and DCS devices within the instrument, we performed a forearm arterial occlusion protocol. The combined probe was strapped to the subject’s forearm while a blood pressure cuff was inflated on the subjects’ upper-arm. After a baseline period, the cuff was inflated to above systolic pressure (~200 mmHg) quickly. Occlusion was maintained for 60 seconds, followed by release. The cuff pressure was monitored using a Biopac TSD120 blood pressure cuff transducer together with a Biopac DA100C general purpose amplifier. The Biopac system provided an analog signal that was recorded using one of the auxiliary inputs of the instrument.
The time courses of total hemoglobin concentration, hemoglobin oxygen saturation and DCS blood flow index for 3 subjects are shown in Fig. 8 below. FD-NIRS data was processed into total hemoglobin (HbT) and hemoglobin oxygen saturation (SO2) and downsampled to 2 Hz for display, while DCS data was downsampled to 1 Hz for display. The blood pressure cuff applied pressure is shown overlaid onto the timecourses using a secondary y-axis.
Fig. 8.
Example forearm occlusion data from three different subjects. a,d,g) Total hemoglobin concentration (HbT), b,e,h) DCS blood flow index; c,f,i) hemoglobin oxygen saturation (SO2) traces are shown before, during and after the 60 second occlusion. The blood pressure cuff applied pressure profile is shown in orange superimposed on the time courses.
After the baseline period, a brief venous occlusion period occurs as the cuff is inflated resulting in a small (2%-4%) increase in total hemoglobin, followed by a plateau at full occlusion, and hyperemic spike when the cuff is released. The blood flow experiences a steep decrease to essentially zero, followed by recovery with a noticeable spike upon release. The hemoglobin oxygen saturation drops during the occlusion, then increases beyond the baseline level upon release due to the hyperemic washout, and slowly returns towards the baseline. These features were very repeatable between subjects, with some variability seen in the baseline values and magnitude of changes. The higher HbT concentration and higher baseline blood flow seen in the first subject suggest the tissue under the probe was predominantly muscle, while the lower values in the other two subjects suggest the presence of a less vascularized subcutaneous fat layer. For all subjects, the blood flow was reliably stopped, and the amount of decrease in hemoglobin oxygen saturation was similar (6%-8%).
4.2 Pulsation resolved blood flow monitoring
Figure 9 shows 10 Hz FD-NIRS and DCS data acquired on the forehead of a healthy adult volunteer. Panel a) shows the FD-NIRS AC signal at 2 cm separation and 830 nm wavelength. Panel b) shows the oxy-hemoglobin concentration derived from the complete multi-distance measurement. Panel c) shows the blood flow index derived from the averaged auto-correlation functions recorded by the 2 individual fibers at 2 cm source-detector separation (each receiving ~150,000 photons/s). While the individual cardiac cycles (HR = 62 bpm) are visible in the raw FD-NIRS AC signal at several separations (not all shown), their amplitude is less than 1%, and they are no longer visible in the oxy-hemoglobin timecourse, due to the higher noise level of the chromophore concentration estimates. At the same time, the individual cardiac cycles are very well resolved by the DCS BFi, with a maximum systolic to minimum diastolic flow ratio of ~2-2.5. DCS acquisition at higher rates is also feasible if additional pulsation detail is needed, within the SNR limits imposed by the available light.
Fig. 9.
Example high speed (10 Hz) FD-NIRS and DCS data acquired on the forehead of a healthy subject: a) raw FD-NIRS AC signal at 2 cm separation for λ = 830 nm; b) Oxy-hemoglobin concentration from the multi-distance measurements; c) DCS blood flow index from the 2 cm separation fibers.
4.3 Muscle oxygen metabolism monitoring during exercise
An athletically fit male volunteer exercised on a stationary cycle ergometer at increasingly higher power levels while maintaining a constant pedaling rate (by following a timer). The FD-NIRS + DCS probe was attached to the right leg in the rectus femoris area. The subject began cycling at 30 W for 4 minutes, then the power was increased in 30 W increments every 4 minutes up to 270 W by increasing the pedaling resistance. The pedaling rate was kept constant to keep any motion related contribution to the blood flow index data constant as well. The relative tissue oxygen metabolic rate was computed as:
| (11) |
The data is shown in Fig. 10. The hemoglobin oxygen saturation in panel a) shows a slowly decreasing trend that accelerates at the higher effort levels. The tissue blood flow in panel b) shows an increasing trend that saturates at the higher effort levels. These contributions combine to result in an overall increasing oxygen metabolic rate that is first sustained by increases in tissue blood flow, and, when the blood delivery limits are being reached, by an increase in oxygen extraction. The approximately linear relationship between rMRO2 and exercise power shown in panel c) has been seen before in NIRS studies that used an arterial occlusion maneuver to estimate the oxygen consumption rate [44]. We do note that these are only preliminary results that serve to highlight the utility of the combined instrument for continuous monitoring of this parameter, and motivate further studies.
Fig. 10.
Example data acquired during exercise on a stationary bike at various intensity levels (while maintaining a constant pedaling rate). a) Tissue hemoglobin oxygen saturation (multi-distance FD-NIRS); b) Tissue blood flow index (2 cm separation); c) relative tissue oxygen metabolic rate normalized to 30 W period.
5. Discussion and conclusion
Compared to previous devices used in NIRS-DCS studies, we demonstrate for the first time an integrated instrument that enables simultaneous operation of the two optical sub-systems, and brings them under a unified user interface that provides real-time display of the raw data, as well as derived parameters, such as total hemoglobin concentration, hemoglobin oxygen saturation and DCS blood flow index. Compared to previous FD-NIRS / DCS instruments used by our group for clinical studies [31], the FD-NIRS performance has been improved through the use of PMT detectors that can achieve higher modulation depth and other system design choices, while on the DCS side, the implementation of a software correlator allows flexibility in setting the acquisition rates and the additional 4 detectors allow for multiple separation DCS measures and/or improved SNR at given location. Also, the concurrent operation is significantly more convenient and allows acquiring data continuously, without the need to switch between instruments. These improvements facilitate the execution of clinical studies while helping ensure data quality.
Through phantom and in-vivo measurements, we have demonstrated that simultaneous operation of the FD-NIRS and DCS components is possible without performance degradation vs. standalone systems. At the same time, the synchronized operation allows the DCS blood flow index to take into account the actual optical properties and provide accurate flow estimates even under conditions where substantial changes in absorption and scattering occur with minimal cross-talk. This allows monitoring of fast dynamic physiological changes where interleaved acquisition of NIRS and DCS data would degrade measurement quality, as well as real-time monitoring of the oxygen metabolism rate by combining NIRS oximetry and DCS perfusion parameters.
Disclosures
MAF: Canon (P), SAC: Canon (P). DMH and NR are employees of ISS Inc.
Acknowledgments
We would like to acknowledge Drs. David Boas, Erin Buckley and Arjun Yodh for helpful discussions, Zachary Starkweather, Dr. Ivy Lin, and Dr. Jason Sutin, for the help on optical probes development, and Dr. Beniamino Barbieri at ISS Inc. for technical support.
Funding
National Institute for Child Development (NICHD) (R43HD071761, awarded to ISS Inc., subcontract to MAF) and National Institute for General Medical Science (NIGMS) (R01GM116177, MAF); Massachusetts General Hospital (MGH) ECOR (SAC).
References and links
- 1.Delpy D. T., Cope M., “Quantification in tissue near–infrared spectroscopy,” Philos. Trans. R. Soc. Lond. B Biol. Sci. 352(1354), 649–659 (1997). 10.1098/rstb.1997.0046 [DOI] [Google Scholar]
- 2.Durduran T., Choe R., Baker W. B., Yodh A. G., “Diffuse Optics for Tissue Monitoring and Tomography,” Rep. Prog. Phys. 73(7), 076701 (2010). 10.1088/0034-4885/73/7/076701 [DOI] [PMC free article] [PubMed] [Google Scholar]
- 3.Bale G., Elwell C. E., Tachtsidis I., “From Jobsis to the present day: a review of clinical near-infrared spectroscopy measurements of cerebral cytochrome-c-oxidase,” J. Biomed. Opt. 21(9), 091307 (2016). 10.1117/1.JBO.21.9.091307 [DOI] [PubMed] [Google Scholar]
- 4.Fantini S., Franceschini M. A., Fishkin J. B., Barbieri B., Gratton E., “Quantitative determination of the absorption spectra of chromophores in strongly scattering media: a light-emitting-diode based technique,” Appl. Opt. 33(22), 5204–5213 (1994). 10.1364/AO.33.005204 [DOI] [PubMed] [Google Scholar]
- 5.Fishkin J. B., So P. T., Cerussi A. E., Fantini S., Franceschini M. A., Gratton E., “Frequency-domain method for measuring spectral properties in multiple-scattering media: methemoglobin absorption spectrum in a tissuelike phantom,” Appl. Opt. 34(7), 1143–1155 (1995). 10.1364/AO.34.001143 [DOI] [PubMed] [Google Scholar]
- 6.Tromberg B. J., Coquoz O., Fishkin J. B., Pham T., Anderson E. R., Butler J., Cahn M., Gross J. D., Venugopalan V., Pham D., “Non-invasive measurements of breast tissue optical properties using frequency-domain photon migration,” Philos. Trans. R. Soc. Lond. B Biol. Sci. 352(1354), 661–668 (1997). 10.1098/rstb.1997.0047 [DOI] [PMC free article] [PubMed] [Google Scholar]
- 7.Delpy D. T., Cope M., van der Zee P., Arridge S., Wray S., Wyatt J., “Estimation of optical pathlength through tissue from direct time of flight measurement,” Phys. Med. Biol. 33(12), 1433–1442 (1988). 10.1088/0031-9155/33/12/008 [DOI] [PubMed] [Google Scholar]
- 8.Patterson M. S., Chance B., Wilson B. C., “Time resolved reflectance and transmittance for the non-invasive measurement of tissue optical properties,” Appl. Opt. 28(12), 2331–2336 (1989). 10.1364/AO.28.002331 [DOI] [PubMed] [Google Scholar]
- 9.Grosenick D., Rinneberg H., Cubeddu R., Taroni P., “Review of optical breast imaging and spectroscopy,” J. Biomed. Opt. 21(9), 091311 (2016). 10.1117/1.JBO.21.9.091311 [DOI] [PubMed] [Google Scholar]
- 10.Fantini S., Sassaroli A., “Near-Infrared Optical Mammography for Breast Cancer Detection with Intrinsic Contrast,” Ann. Biomed. Eng. 40(2), 398–407 (2012). 10.1007/s10439-011-0404-4 [DOI] [PMC free article] [PubMed] [Google Scholar]
- 11.Franceschini M. A., Thaker S., Themelis G., Krishnamoorthy K. K., Bortfeld H., Diamond S. G., Boas D. A., Arvin K., Grant P. E., “Assessment of infant brain development with frequency-domain near-infrared spectroscopy,” Pediatr. Res. 61(5), 546–551 (2007). 10.1203/pdr.0b013e318045be99 [DOI] [PMC free article] [PubMed] [Google Scholar]
- 12.Hallacoglu B., Sassaroli A., Wysocki M., Guerrero-Berroa E., Schnaider Beeri M., Haroutunian V., Shaul M., Rosenberg I. H., Troen A. M., Fantini S., “Absolute measurement of cerebral optical coefficients, hemoglobin concentration and oxygen saturation in old and young adults with near-infrared spectroscopy,” J. Biomed. Opt. 17(8), 081406 (2012). 10.1117/1.JBO.17.8.081406 [DOI] [PMC free article] [PubMed] [Google Scholar]
- 13.Ferrari M., Quaresima V., “A brief review on the history of human functional near-infrared spectroscopy (fNIRS) development and fields of application,” Neuroimage 63(2), 921–935 (2012). 10.1016/j.neuroimage.2012.03.049 [DOI] [PubMed] [Google Scholar]
- 14.Grassi B., Quaresima V., “Near-infrared spectroscopy and skeletal muscle oxidative function in vivo in health and disease: a review from an exercise physiology perspective,” J. Biomed. Opt. 21(9), 091313 (2016). 10.1117/1.JBO.21.9.091313 [DOI] [PubMed] [Google Scholar]
- 15.Boas D. A., Campbell L. E., Yodh A. G., “Scattering and Imaging with Diffusing Temporal Field Correlations,” Phys. Rev. Lett. 75(9), 1855–1858 (1995). 10.1103/PhysRevLett.75.1855 [DOI] [PubMed] [Google Scholar]
- 16.Boas D. A., Yodh A. G., “Spatially varying dynamical properties of turbid media probed with diffusing temporal light correlation,” J. Opt. Soc. Am. A. 14(1), 192–215 (1997). 10.1364/JOSAA.14.000192 [DOI] [Google Scholar]
- 17.Durduran T., Zhou C., Buckley E. M., Kim M. N., Yu G., Choe R., Gaynor J. W., Spray T. L., Durning S. M., Mason S. E., Montenegro L. M., Nicolson S. C., Zimmerman R. A., Putt M. E., Wang J., Greenberg J. H., Detre J. A., Yodh A. G., Licht D. J., “Optical measurement of cerebral hemodynamics and oxygen metabolism in neonates with congenital heart defects,” J. Biomed. Opt. 15(3), 037004 (2010). 10.1117/1.3425884 [DOI] [PMC free article] [PubMed] [Google Scholar]
- 18.Carp S. A., Dai G. P., Boas D. A., Franceschini M. A., Kim Y. R., “Validation of diffuse correlation spectroscopy measurements of rodent cerebral blood flow with simultaneous arterial spin labeling MRI; towards MRI-optical continuous cerebral metabolic monitoring,” Biomed. Opt. Express 1(2), 553–565 (2010). 10.1364/BOE.1.000553 [DOI] [PMC free article] [PubMed] [Google Scholar]
- 19.Yu G., Floyd T. F., Durduran T., Zhou C., Wang J., Detre J. A., Yodh A. G., “Validation of diffuse correlation spectroscopy for muscle blood flow with concurrent arterial spin labeled perfusion MRI,” Opt. Express 15(3), 1064–1075 (2007). 10.1364/OE.15.001064 [DOI] [PubMed] [Google Scholar]
- 20.Buckley E. M., Cook N. M., Durduran T., Kim M. N., Zhou C., Choe R., Yu G., Schultz S., Sehgal C. M., Licht D. J., Arger P. H., Putt M. E., Hurt H. H., Yodh A. G., “Cerebral hemodynamics in preterm infants during positional intervention measured with diffuse correlation spectroscopy and transcranial Doppler ultrasound,” Opt. Express 17(15), 12571–12581 (2009). 10.1364/OE.17.012571 [DOI] [PMC free article] [PubMed] [Google Scholar]
- 21.Roche-Labarbe N., Carp S. A., Surova A., Patel M., Boas D. A., Grant P. E., Franceschini M. A., “Noninvasive optical measures of CBV, StO(2), CBF index, and rCMRO(2) in human premature neonates’ brains in the first six weeks of life,” Hum. Brain Mapp. 31(3), 341–352 (2010). 10.1002/hbm.20868 [DOI] [PMC free article] [PubMed] [Google Scholar]
- 22.Kim M. N., Durduran T., Frangos S., Edlow B. L., Buckley E. M., Moss H. E., Zhou C., Yu G., Choe R., Maloney-Wilensky E., Wolf R. L., Grady M. S., Greenberg J. H., Levine J. M., Yodh A. G., Detre J. A., Kofke W. A., “Noninvasive measurement of cerebral blood flow and blood oxygenation using near-infrared and diffuse correlation spectroscopies in critically brain-injured adults,” Neurocrit. Care 12(2), 173–180 (2010). 10.1007/s12028-009-9305-x [DOI] [PMC free article] [PubMed] [Google Scholar]
- 23.Zhou C., Eucker S. A., Durduran T., Yu G., Ralston J., Friess S. H., Ichord R. N., Margulies S. S., Yodh A. G., “Diffuse optical monitoring of hemodynamic changes in piglet brain with closed head injury,” J. Biomed. Opt. 14(3), 034015 (2009). 10.1117/1.3146814 [DOI] [PMC free article] [PubMed] [Google Scholar]
- 24.Durduran T., Choe R., Yu G., Zhou C., Tchou J. C., Czerniecki B. J., Yodh A. G., “Diffuse optical measurement of blood flow in breast tumors,” Opt. Lett. 30(21), 2915–2917 (2005). 10.1364/OL.30.002915 [DOI] [PubMed] [Google Scholar]
- 25.Li J, Dietsche G, Iftime D., “Noninvasive detection of functional brain activity with near-infrared diffusing-wave spectroscopy,” J. Biomed. Opt. 10(4), 044002 (2005). [DOI] [PubMed] [Google Scholar]
- 26.Durduran T., Yu G., Burnett M. G., Detre J. A., Greenberg J. H., Wang J., Zhou C., Yodh A. G., “Diffuse optical measurement of blood flow, blood oxygenation, and metabolism in a human brain during sensorimotor cortex activation,” Opt. Lett. 29(15), 1766–1768 (2004). 10.1364/OL.29.001766 [DOI] [PubMed] [Google Scholar]
- 27.Roche-Labarbe N., Fenoglio A., Radhakrishnan H., Kocienski-Filip M., Carp S. A., Dubb J., Boas D. A., Grant P. E., Franceschini M. A., “Somatosensory evoked changes in cerebral oxygen consumption measured non-invasively in premature neonates,” Neuroimage 85(Pt 1), 279–286 (2014). 10.1016/j.neuroimage.2013.01.035 [DOI] [PMC free article] [PubMed] [Google Scholar]
- 28.Fox P. T., Raichle M. E., “Focal physiological uncoupling of cerebral blood flow and oxidative metabolism during somatosensory stimulation in human subjects,” Proc. Natl. Acad. Sci. U.S.A. 83(4), 1140–1144 (1986). 10.1073/pnas.83.4.1140 [DOI] [PMC free article] [PubMed] [Google Scholar]
- 29.Durduran T., Yodh A. G., “Diffuse correlation spectroscopy for non-invasive, micro-vascular cerebral blood flow measurement,” Neuroimage 85(Pt 1), 51–63 (2014). 10.1016/j.neuroimage.2013.06.017 [DOI] [PMC free article] [PubMed] [Google Scholar]
- 30.Buckley E. M., Parthasarathy A. B., Grant P. E., Yodh A. G., Franceschini M. A., “Diffuse correlation spectroscopy for measurement of cerebral blood flow: future prospects,” Neurophotonics 1(1), 011009 (2014). 10.1117/1.NPh.1.1.011009 [DOI] [PMC free article] [PubMed] [Google Scholar]
- 31.Lin P. Y., Roche-Labarbe N., Dehaes M., Carp S., Fenoglio A., Barbieri B., Hagan K., Grant P. E., Franceschini M. A., “Non-invasive optical measurement of cerebral metabolism and hemodynamics in infants,” J. Vis. Exp. 73, e4379 (2013). [DOI] [PMC free article] [PubMed] [Google Scholar]
- 32.Fantini S., Franceschini M.-A., Maier J. S., Walker S. A., Barbieri B. B., Gratton E., “Frequency-domain multichannel optical detector for noninvasive tissue spectroscopy and oximetry,” Opt. Eng. 34(1), 32–42 (1995). 10.1117/12.183988 [DOI] [Google Scholar]
- 33.Fantini S., Franceschini M. A., Gratton E., “Semi-infinite-geometry boundary problem for light migration in highly scattering media: a frequency-domain study in the diffusion approximation,” J. Opt. Soc. Am. B. 11(10), 2128–2138 (1994). 10.1364/JOSAB.11.002128 [DOI] [Google Scholar]
- 34.Cheung C., Culver J. P., Takahashi K., Greenberg J. H., Yodh A. G., “In vivo cerebrovascular measurement combining diffuse near-infrared absorption and correlation spectroscopies,” Phys. Med. Biol. 46(8), 2053–2065 (2001). 10.1088/0031-9155/46/8/302 [DOI] [PubMed] [Google Scholar]
- 35.Boas D. A., Sakadzic S., Selb J., Farzam P., Franceschini M. A., Carp S. A., “Establishing the diffuse correlation spectroscopy signal relationship with blood flow,” Neurophotonics 3(3), 031412 (2016). 10.1117/1.NPh.3.3.031412 [DOI] [PMC free article] [PubMed] [Google Scholar]
- 36.Kou L., Labrie D., Chylek P., “Refractive indices of water and ice in the 0.65- to 2.5-µm spectral range,” Appl. Opt. 32(19), 3531–3540 (1993). 10.1364/AO.32.003531 [DOI] [PubMed] [Google Scholar]
- 37.Magatti D., Ferri F., “Fast multi-tau real-time software correlator for dynamic light scattering,” Appl. Opt. 40(24), 4011–4021 (2001). 10.1364/AO.40.004011 [DOI] [PubMed] [Google Scholar]
- 38.Schätzel K., “Noise on photon correlation data. I. Autocorrelation functions,” J. Quantum Opt. 2(4), 287–305 (1990). 10.1088/0954-8998/2/4/002 [DOI] [Google Scholar]
- 39.Cook J. R., Bouchard R. R., Emelianov S. Y., “Tissue-mimicking phantoms for photoacoustic and ultrasonic imaging,” Biomed. Opt. Express 2(11), 3193–3206 (2011). 10.1364/BOE.2.003193 [DOI] [PMC free article] [PubMed] [Google Scholar]
- 40.Michels R., Foschum F., Kienle A., “Optical properties of fat emulsions,” Opt. Express 16(8), 5907–5925 (2008). 10.1364/OE.16.005907 [DOI] [PubMed] [Google Scholar]
- 41.van Staveren H. J., Moes C. J., van Marie J., Prahl S. A., van Gemert M. J., “Light scattering in Intralipid-10% in the wavelength range of 400-1100 nm,” Appl. Opt. 30(31), 4507–4514 (1991). 10.1364/AO.30.004507 [DOI] [PubMed] [Google Scholar]
- 42.Einstein A., “Über die von der molekularkinetischen Theorie der Wärme geforderte Bewegung von in ruhenden Flüssigkeiten suspendierten Teilchen,” Ann. Phys. 322(8), 549–560 (1905). 10.1002/andp.19053220806 [DOI] [Google Scholar]
- 43.Cumming J. B., “Temperature dependence of light absorption by water,” Nucl Instr and Methods in Phys Res Sect A. 713, 1–4 (2013). 10.1016/j.nima.2013.02.024 [DOI] [Google Scholar]
- 44.van Beekvelt M. C., van Engelen B. G., Wevers R. A., Colier W. N., “In vivo quantitative near-infrared spectroscopy in skeletal muscle during incremental isometric handgrip exercise,” Clin. Physiol. Funct. Imaging 22(3), 210–217 (2002). 10.1046/j.1475-097X.2002.00420.x [DOI] [PubMed] [Google Scholar]


