Abstract
In this study, an electroporation-based surface-enhanced Raman scattering (SERS) technique was employed to differentiate the human myeloid leukemia cells from the normal human bone marrow mononuclear cells with the aim to develop a fast and label-free method for leukemia cell screening. The Ag nanoparticles were delivered into living cells by electroporation, and then high quality SERS spectra were successfully obtained from 60 acute promyelocytic leukemia cells (HL60 cell line), 60 chronic myelogenous leukemia cells (K562 cell line) and 60 normal human bone marrow mononuclear cells (BMC). Principal component analysis (PCA) combined with linear discriminant analysis (LDA) differentiated the leukemia cell SERS spectra (HL60 plus K562) from normal cell SERS spectra (BMC) with high sensitivity (98.3%) and specificity (98.3%). Furthermore, partial least squares (PLS) approach was employed to develop a diagnostic model. The model successfully predicted the unidentified subjects with a diagnostic accuracy of 96.7%. This exploratory work demonstrates that the electroporation-based SERS technique combined with PCA-LDA and PLS diagnostic algorithms possesses great promise for cancer cell screening.
OCIS codes: (170.0170) Medical optics and biotechnology, (240.6695) Surface-enhanced Raman scattering, (170.4580) Optical diagnostics for medicine
1. Introduction
Worldwide, leukemia is one of the deadliest diseases. Myeloid leukemia is the most common type of leukemia in adults and is the result of an abnormal differentiation and proliferation of haematopoietic cells in the bone marrow [1]. A great deal of research has gone into the development of novel approaches for leukemia early detection and screening. Since more than a decade ago, Raman microscopy has been a promising analytical tool for researchers working in the field of biomedical research, primarily because it is capable of detecting molecular vibrations that provide molecular information, including its structure and its environment [2]. Raman spectroscopy combined with statistical methods has been widely applied in disease diagnostics, including leukemia, oesophagus cancer, breast cancer, colorectal cancer, bladder cancer, lung cancer, and skin cancer [3–5]. However, the conventional Raman spectroscopy technique has many disadvantages. Because of typical Raman cross sections are between 10−30 and 10−25 cm2 per molecule, Raman scattering signal is very weak [6]. Moreover, in order to avoid the damage to the cell sample, the applicable maximum intensity of the excitation laser is limited. Therefore, the typical data collection times for Raman spectroscopy of a living cell using a confocal Raman spectrometer can be up to several minutes per point. The data collection times will be too long for practical applications such as high resolution living cell Raman imaging and high-throughput cancer cell screening.
Surface enhanced Raman scattering (SERS) can overcome the shortfall of conventional Raman technique and has great potential for biomedical applications. Raman signals can be enhanced by many orders of magnitude when a molecule or molecular structure is located in the close vicinity of nanostructured noble metal surfaces such as Au or Ag [7]. In addition, the adsorption of molecules on metal particles reduces the background fluorescence signal. With advantages in detection sensitivity, selectivity and specificity, SERS has been used in determining intracellular or extracellular constituents and studying cell–drug interactions [8]. When Au or Ag nanoparticles (NPs) are delivered into living cells and serve as the enhancing agents, Raman signal of living cells could be enhanced significantly by SERS. SERS signal in living cells provides a tool for sensitive and selective detection of intracellular biological macromolecules, such as nucleic acids, amino acids, lipids and proteins. Meanwhile, most clinical applications of SERS are focused on developing SERS based immunoassay. The surface of Au or Ag NPs could be functionalized with Raman reporter molecules, antibodies or ligands in order to favour their internalization by living cells and to target them to selected cellular compartments for SERS biosensing or imaging, such as SERS flow cytometry, pH sensors or organelle-targeting imaging [9–11]. In general, the delivery of SERS sensors into living cells is a primary pretreatment for intracellular SERS detection.
However, it is difficult to deliver NPs into living cells rapidly. Because the cell membrane acts as a barrier to the diffusion of NPs between the external medium and the cytoplasm. At present, “passive uptake” is the dominant technique for delivering NPs into living cells. The NPs are taken up by the cells via endocytosis [12]. During the process of endocytosis, a part of the cellular membrane undergoes invagination, thereby enclosing some NPs that are absorbed on or close to the membrane [13]. According to some reports, the surface coating of NPs plays a decisive role in the internalization process. Mirkin et al. have synthesized, characterized, and applied oligonucleotide-modified NPs (DNA-AuNPs) [14]. This nanomaterial consists of a AuNP core that is functionalized with a dense shell of synthetic oligonucleotides. The density of DNA on the particle surface was found to be a deciding factor of DNA-AuNP uptake. Marisca et al. found that the collagen-coated Au NPs exhibit lower cytotoxicity, but higher uptake levels than synthetic poly-coated Au NPs [15]. There is a major disadvantage of the traditional “passive uptake” method: it is time consuming. NPs have to be incubated with cells at 37°C for several hours or more prior to the SERS measurements. For many biomedical applications, such as cancer cell screening, keeping the preparation process for such a long time brings extra procedures and increase the cost. We have reported a method based on ultrasound which allows fast delivery of NPs into living cells for intracellular SERS measurements [16]. However, the NPs delivery efficiency of this method was significantly influenced by many factors, such as ultrasonic power, frequency, duration, cell condition, operation temperature and so on.
To overcome the disadvantages of existing NPs delivery methods, very recently, we have developed an optimized electroporation method that can rapidly deliver NPs into living cells within several minutes and successfully carried out intracellular SERS detection [17]. As a physical delivery method, electroporation involves the application of controlled electrical pulses to induce transient and reversible pores in the cell membrane. For a moment, the cell membrane becomes highly permeable to exogenous substances in the surrounding media such as NPs. It has been proved that electroporation delivery method can significantly shorten the sample preparation times for SERS spectroscopy based analyses of living cells [17,18].
In this paper, we explored the applications of electroporation-based SERS technology for leukemia cell biochemical analysis and diagnosis. Principal component analysis (PCA) and linear discriminate analysis (LDA) were used to classify the SERS spectra acquired from human myeloid leukemia cells (HL60 and K562 cell lines) and normal human bone marrow mononuclear cells (BMC). To the best of our knowledge, this is the first report on SERS analyses of leukemia cells based on electroporation for cancer cell screening purposes.
2. Materials and methods
2.1 Preparation of Ag NPs
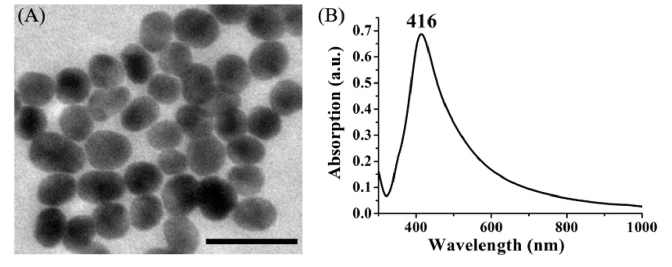
Colloidal silver was prepared by the aqueous reduction of silver nitrate with hydroxylamine hydrochloride using the method developed by Leopold and Lendl [19]. 4.5 mL sodium hydroxide (0.1 mol/L) was added to 5 ml hydroxylamine hydrochloride (6 × 10⁻² mol/L) and then the mixtures were added to 90 mL silver nitrate (1.11 × 10⁻³ mol/L). The mixed solution was kept stirring for 15 min. The final silver colloid showed a milky gray color. Figure 1 shows the transmission electron microscope (TEM) image and the absorption spectrum of the silver colloid. The average size of the Ag NPs is 43 ± 5 nm. The UV-Vis-NIR spectral absorption maximum was located at 416 nm.
Fig. 1.
(A) TEM image of Ag NPs. Scale bar: 100 nm. The average size of the Ag NPs is 43 ± 5 nm. (B) UV-Vis-NIR absorption spectrum of the Ag colloids.
2.2 Cell culture
Human myelocytic leukemia cell lines used in this study were obtained from the Fujian Province Tumor Hospital. HL60 cells and K562 cells were suspended and grown in the RPMI-1640 medium (supplemented with 100 IU/mL penicillin/streptomycin and 10% fetal calf serum) at 37°C and 5% CO2 with 100% relative humidity. Before electroporation, HL60 and K562 cells were harvested by centrifugation at 800 rpm for 10 min, respectively. And then cells were re-suspended in PBS, centrifuged again to remove any residual medium, after which PBS was added to obtain a final concentration of 105 cells/mL.
Normal human bone marrow mononuclear cells (BMC) were kindly provided by the Fujian Institute of Hematology. Ethical approval was obtained in order to study the human bone marrow aspirate samples. Bone marrow aspirates were obtained from healthy volunteers, and the bone marrow mononuclear cells were isolated from bone marrow aspirates according to the published cell isolation protocol [20]. Before electroporation, BMC were washed by PBS, counted (105 cells/mL), and used for the experiments.
2.3 Electroporation process and parameters
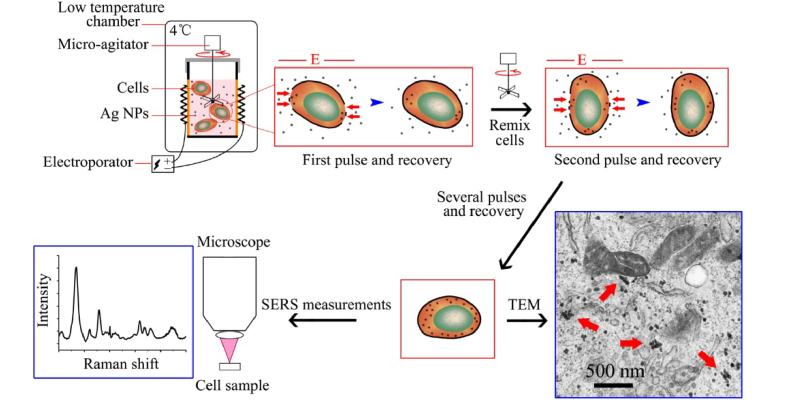
A BTX-ECM 830 Electroporator (Bio-Rad Laboratories Ltd.) was used in this study. The schematic illustration of the procedure for delivery of Ag NPs into cells by electroporation was shown in Fig. 2. Firstly, 480 µL cell suspension and 20 µL Ag colloids were mixed thoroughly in an electrode cuvette (with a pair of flat electrodes, 4 mm apart). Then, a constant voltage of 200 V (corresponding to field strength of 500 V/cm) was used, and 500 µs duration pulses were applied for five times with 2 min of interval time. During the interval time, a micro-agitator was used to remix cells and NPs. Cells during the whole electroporation process were kept under 4°C. After electroporation, the cells were washed by PBS to remove any residual NPs. Finally, cells were re-suspended in 500 µl PBS. Before SERS measurements, cells were stained with a 1:1 concentration of Trypan Blue (Sigma) for 1 min, and then the viability of cells was counted by hemocytometer. The viabilities of HL60 cells, K562 cells and normal cells (BMC) treated by electroporation were 91.4%, 93.3% and 90.7%, respectively.
Fig. 2.
Schematics of using electroporation to deliver Ag NPs into living cells for SERS measurements (adapted from our previous study [17]).
2.4 SERS measurements
SERS spectra were recorded over a spectral range of 500-1750 cm−1 with a confocal Raman spectrometer (Renishaw, Great Britain) under a 785 nm laser excitation. A Leica 50 × microscope objective was used; the detection of Raman signal was carried out with a Peltier cooled charge-coupled device (CCD) camera. The WIRE 2.0 software package (Renishaw) was employed for the spectral acquisition and analysis. The 520 cm−1 band of a silicon wafer was used for the frequency calibration. We adjusted the settings of the Raman microscope to facilitate whole-cell SERS measurement. The laser spot size was enlarged up by adjustment of the pinhole size. Using a 50 × objective (numerical aperture: 0.75), the enlarged laser beam of about 15 μm size can easily cover the entire single cell (10~15 μm size) and good quality SERS spectrum can be acquired with a 10 s integration time. The incident laser power was about 2 mW on the cell sample.
We performed repeated whole-cell SERS spectral measurement on each cells. Ten whole-cell SERS spectra were acquired repeatedly from each cell and 60 cells for each cell line were measured. Each time, only 40 µL cell suspension was dropped onto a stainless steel substrate for SERS measurement. Due to PBS evaporation over time, the 40 µL samples are completely dry after approximately 20 min. Therefore, only six cells were measured in this process, which cost only about 10 min (the integration time for each spectrum was 10 s; ten whole-cell SERS spectra were acquired repeatedly from each cell). This process was repeated to complete SERS measurement for total of 60 cells. Briefly, the cell SERS measurement was divided to many batches in order to avoid the negative effect from PBS evaporation.
2.5 Data processing and analysis
The measured spectra represented a composition of cell SERS signal and autofluorescence background. Thus, an automated algorithm for autofluorescence background removal was applied to extract SERS spectra from the raw spectra data [21]. And then, all background-subtracted SERS spectra were normalized to the integrated area under the curve. This process enabled a better comparison of the spectral characteristics and relative SERS peak intensities among the three cell groups [22]. The mean spectrum of 10 normalized spectra measured repeatedly from a cell was calculated and used to represent this cell, and 60 mean SERS spectra were obtained in each cell group for the subsequent spectra analysis.
The normalized SERS data set was fed into the SPSS 15.0 software package (SPSS Inc., Chicago) for PCA and LDA analysis. Firstly, the high dimensional SERS data set was reduced, and new relevant variables, principal component scores (PCs), were obtained by using PCA algorithm. And then, an independent sample T-test was used to identify diagnostically significant PC scores calculated by PCA for each case using an alpha of 5% [23]. The statistically significant PC scores (p<0.05) were retained and loaded into the LDA algorithm with the leave-one-out, cross-validation method for generating effective diagnostic model for cell sample classification.
To test the predictive power of SERS spectral data for leukemia cells detection, the partial least squares (PLS) approach was also performed on the same spectral data using Unscrambler software package V9.7 (CAMO Software AS, Trondheim, Norway). Latent variables (LVs) were calculated to explain the diagnostic relevant variations rather than the significant differences in the data set [24]. The optimal number of LVs included in a PLS model and the performance of the PLS model were validated in an unbiased manner using a leave-one-out cross-validation method [25]. The correlation coefficient (R), R2, and the root-mean standard error (RMSE) were calculated to assess the fitting of the models.
The entire data set (consisting of 180 spectra) was divided into two parts: a calibration set (that was used to build a prediction model) and a test set (that was used to test the model’s predictive ability). The calibration set was composed of 150 randomized spectra (consisting of 50 HL60 cells, 50 K562 cells, and 50 BMC), and the test set was composed of the remaining 30 spectra (consisting of 10 HL60 cells, 10 K562 cells, and 10 BMC). In the calibration set, we used 1, 2 and 3 to represent the three different cell groups (1 for HL60 cells, 2 for K562 cells, and 3 for BMC, respectively).
3. Results
From the TEM image of cell in Fig. 2, we can clearly find some Ag NPs located in the cytoplasm of cell after the treatment with electroporation. Some Ag NPs clusters are also seen in the electron micrograph as labeled by red arrows. Using Ag NPs as the enhancing substrate, we have successfully acquired intracellular SERS spectra from 60 normal cells (BMC), 60 HL60 cells and 60 K562 cells.
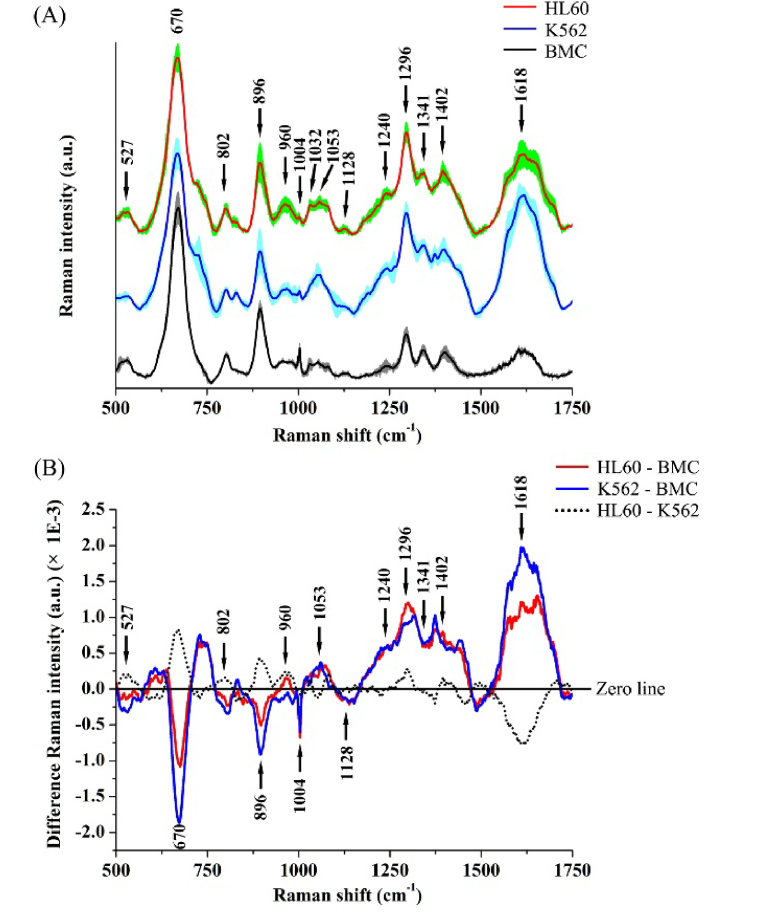
Figure 3(A) shows the mean SERS spectra of HL60 cells, K562 cells and normal cells (BMC) with the standard deviations (SDs) overlying as shaded color fill. It can be seen that while significant SERS spectral differences exist between normal and leukemia cell samples, primary SERS peaks at 527, 670, 802, 896, 960, 1004, 1053, 1296, 1341, 1402 and 1618 cm−1 can all be observed in both normal and leukemia cells, with the strongest signals at 670, 896, 1296 and 1618 cm−1. Tentative SERS peaks assignments are listed in Table 1, according to some literatures [13,26–28]. The relative intensity differences between leukemia and normal cells can be observed more clearly in the difference SERS spectra (Fig. 3(B)). The two difference spectra for HL60 cells vs. BMC and K562 cells vs. BMC are very similar. The significant SERS spectra changes such as SERS peak intensities, peak positions and spectral band widths, in the spectral ranges of 650-700, 870-920, 1000-1100, 1200-1450 and 1530-1670 cm−1, contain signals primarily related to DNA/RNA bases, lipids, collagen and proteins. For example, the Raman peak located at 670 cm−1 assigned to thymine/guanine showed lower relative intensity for HL60 cells and K562 cells as compared to BMC, indicating a decrease in the percentage of nucleic acid relative to the total SERS-active constituents in leukemia cells. This is further confirmed by the similarly reduced intensity of the 896 cm−1 of ribose-phosphate bases in HL60 cells and K562 cells. In addition, the cell SERS peak at 1053 cm−1 due to the C-C trans and stretching mode of lipid exhibited higher SERS signal in HL60 cells and K562 cells than in BMC, suggesting the lipid concentration in the probe volume of the laser beam is higher in leukemia cells than in normal cells. Besides, some SERS peaks assigned to protein vibration bands are stronger in intensity in leukemia cells. This is the case for the 1296 cm−1 amide III band and the 1618 cm−1 amide I band of protein, which shows a higher protein concentration in HL60 and K562 cells than in BMC.
Fig. 3.
(A) Comparison of mean SERS spectra from HL60 cells (n = 60), K562 cells (n = 60) and normal cells (BMC) (n = 60). The shaded areas represent the standard deviations of the means. The mean SERS spectrum (mean ± SD) of each cell group was averaged from the 60 mean SERS spectra in corresponding cell group. Note that the mean SERS spectra of cells are vertically shifted for clarity. (B) Difference spectra calculated from the mean SERS spectra of HL60 cells and BMC (i.e., HL60-BMC) (red line), K562 cells and BMC (blue line), and HL60 cells and K562 cells (black dotted line), respectively.
Table 1. SERS peak positions and tentative assignments.
| Peak positions (cm−1) | Tentative assignments |
|---|---|
| 527 | Saccharides; Proteins |
| 670 | Nucleic acid: T, G |
| 802 | Uracil: ring breathing mode |
| 896 | Ribose-phosphate |
| 960 | Tyrosine |
| 1004 | Phenylalanine: ring breathing |
| 1032 | Phenylalanine: CH in plane deformation |
| 1053 | Lipid: C-C trans and stretching |
| 1082 | Proteins: C-N stretching; Lipids: CC stretching chain, C-O stretching |
| 1128 | Protein: C-N stretching; Lipids: C-C stretching |
| 1240 | Protein: Amide III (beta sheet); Collagen |
| 1296 | Protein: Amide III |
| 1341 | Protein: CH deformation |
| 1402 | Collagen: bending modes of methyl groups |
| 1618 | Protein: Amide I |
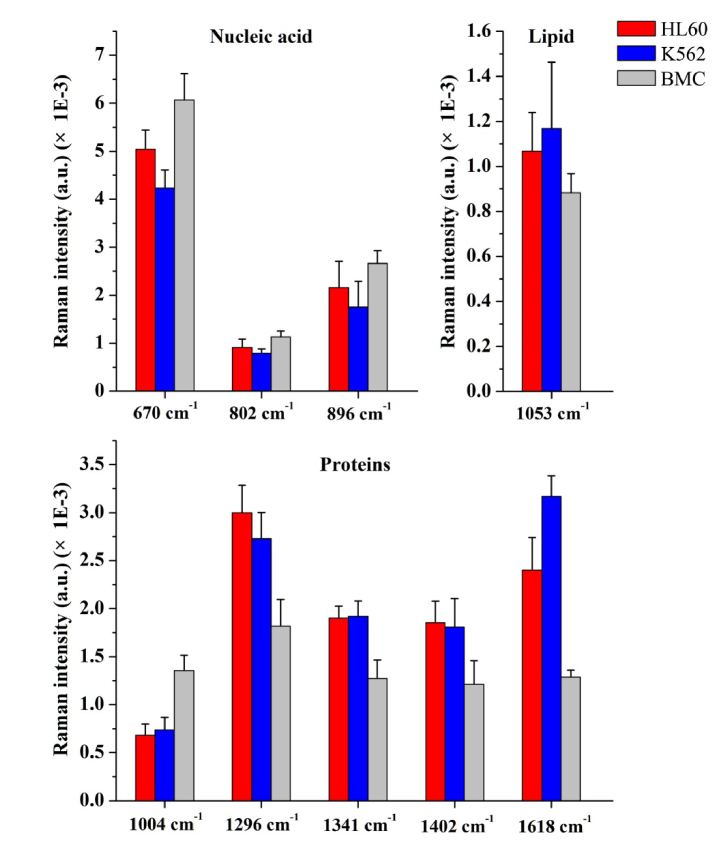
In addition, nine important SERS peaks located at 670, 802, 896, 1004, 1053, 1296, 1341, 1402 and 1618 cm−1 were identified among the three cell groups. Figure 4 shows the comparison of the SERS peak intensities at the nine identified spectral peaks. The differences are statistically significant (p<0.05) between normal cells (BMC) and leukemia cells (HL60 or K562) for all SERS peaks, and the spectral intensities of 670, 802, 896, 1004, 1053, 1296 and 1618 cm−1 can be used for differentiating HL60 cells from K562 cells. These results indicate that there are some significant changes in SERS spectra of different cell groups, suggesting a potential of SERS for leukemia cell diagnosis applications.
Fig. 4.
Histogram of the nine SERS peak intensities (mean ± SD) for HL60 (red), K562 (blue) and BMC (gray) samples. The differences are statistically significant (p<0.05) between normal cells (BMC) and leukemia cells (HL60 or K562) for all SERS peaks, and between HL60 and K562 for 670, 802, 896, 1004, 1053, 1296 and 1618 cm−1 peaks.
Simplistic peaks analysis as mentioned above only used limited SERS spectral information, and there are many other potential diagnostic information included in the SERS spectra. Therefore, PCA and LDA were explored to determine the most diagnostically significant SERS features for leukemia cells classification (i.e. leukemia cells (HL60 + K562) vs. normal cells (BMC)). As defined by the independent sample T-test on the PCs obtained by PCA, three PCs (PC1 (52.876%), PC2 (28.976%) and PC4 (1.650%)), accounting for 83.5% of the variance, were found to be the most diagnostically significant (PC1: p<0.001, PC2: p<0.001 and PC4: p = 0.013<0.05, respectively) for discriminating leukemia cells (HL60 + K562) from normal cells (BMC). Figure 5(A) shows the PC loadings of the three statistically significant PCs (PC1, PC2 and PC4) calculated from PCA. Some PC features roughly correspond to SERS spectra, with peaks and troughs at positions similar to those of the SERS spectra. Figure 5(B) is a 3D scatter plot with PC1, PC2 and PC4 as the three axes. PCA separates the cell types into three clusters corresponding to HL60, K562 and BMC. All the three statistically significant PCs were loaded into LDA algorithm for cell classification. Figure 5(C) shows the posterior probabilities of cell samples belonging to the leukemia cell groups (HL60 + K562) (vs. the normal cell group (BMC)) as calculated by the LDA method. Using a discrimination threshold of 0.5, a diagnostic sensitivity (98.3%) and specificity (98.3%) for differentiating leukemia cells from normal cells were obtained.
Fig. 5.
(A) PC loadings of the three statistically significant PCs (PC1, PC2 and PC4) calculated from PCA. (B) A 3D scatter plot of the PCA result calculated from the SERS data for the leukemia cells groups (HL60 + K562) and the normal cell group (BMC) with PC1, PC2, and PC4 as three axes. (C) Scatter plots of the posterior probability for the leukemia cells and the normal cells categories using the PCA-LDA algorithm.
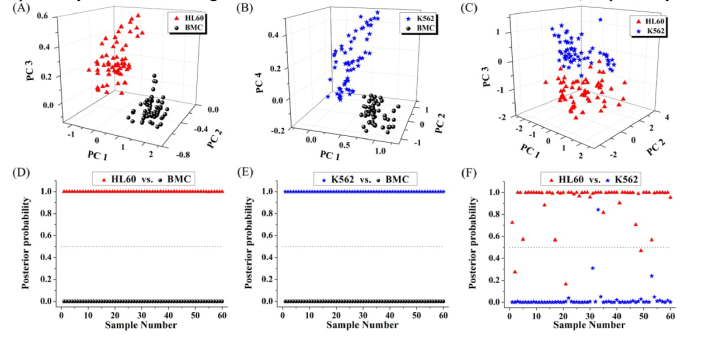
We also performed the PCA-LDA analysis only with spectra of the two cell groups (i.e. HL60 cells vs. BMC, K562 cells vs. BMC, and HL60 cells vs. K562 cells) for cells classification. T-test on the PCs obtained by PCA showed that PC1, PC2 and PC3 were diagnostically significant (p<0.05) for discriminating HL60 cell group from BMC group. Similarly, PC1, PC2 and PC4 were found to be the most diagnostically significant for discriminating K562 cell group from BMC group, and PC1, PC2 and PC3 were found to be the most diagnostically significant for discriminating HL60 cells from K562 cells. And then, we used the three most significant PC scores for each of the three data sets to plot Fig. 6(A), 6(B), and 6(C) for cell diagnostic classification. Besides, LDA was used to generate diagnostic algorithms using the three most significant PCs for each of the three spectral data sets. To prevent over-training, the leave-one-out cross-validation procedure was used. Figure 6(D) shows the posterior probabilities of cell samples belonging to the HL60 cell group (vs. the BMC group) calculated by the LDA method. The diagnostic sensitivity and specificity for discriminating HL60 cells from BMC were 100% and 100%, respectively. Figure 6(E) shows the posterior probabilities of cell samples belonging to the K562 cell group (vs. the BMC group) calculated by the LDA method. The diagnostic sensitivity and specificity for discriminating K562 cells from BMC were 100% and 100%, respectively. Figure 6(F) shows the posterior probabilities of cell samples belonging to two different leukemia cell groups (HL60 cell group vs. K562 cell group) calculated by the LDA method. The diagnostic sensitivity and specificity for discriminating HL60 cells from K562 cells were 95% and 98.3%, respectively.
Fig. 6.
Scatter plots of the corresponding PCs for cells classification: (A) HL60 vs. BMC, (B) K562 vs. BMC, and (C) HL60 vs. K562. Scatter plots of the posterior probabilities according to the HL60 cells, K562 cells and BMC calculated from the data sets using different grouping methods: (D) HL60 vs. BMC, (E) K562 vs. BMC, and (F) HL60 vs. K562.
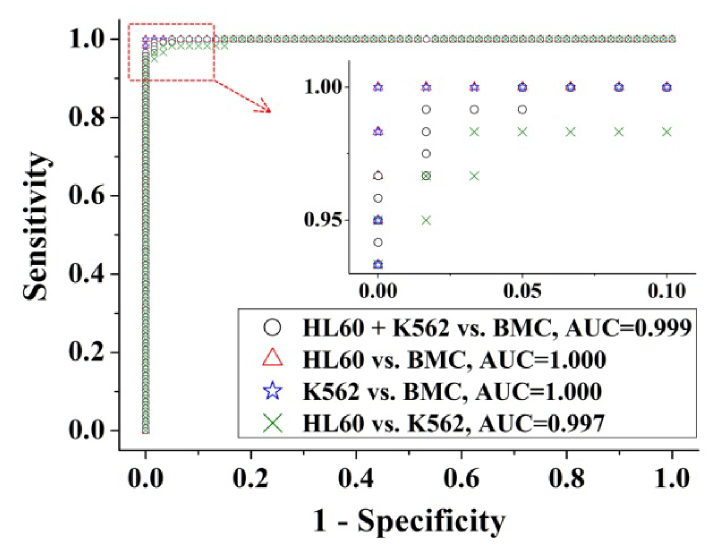
To further evaluate the performance of the PCA-LDA based algorithm for leukemia cell diagnosis, receiver operating characteristic (ROC) curves (as shown in Fig. 7) were generated from the scatter plots in Fig. 5(C), and Fig. 6(D), 6(E) and 6(F) by varying the discrimination threshold. The integration areas under the ROC curve (AUC) were 0.999, 1.000, 1.000 and 0.997 for leukemia cells (HL60 cells + K562 cells) vs. normal cells (BMC), HL60 cells vs. BMC, K562 cells vs. BMC, and HL60 cells vs. K562 cells, respectively.
Fig. 7.
The receiver operating characteristic (ROC) curves of discrimination results for different groupings of cell samples generated from PCA-LDA analysis.
Table 2 summarized the diagnostic results. High diagnostic sensitivities, specificities and accuracies can be achieved for classification of HL60 cell group and BMC group, and for K562 cell group and BMC group. Results indicate that the SERS analysis technique in conjunction with PCA-LDA diagnostic algorithm has great potential for label-free detection and screening of leukemia cells.
Table 2. Classification results of the three cell groups using PCA-LDA method.
| Diagnostic combinations | Predicted results |
||
|---|---|---|---|
| Sensitivity | Specificity | Accuracy | |
| HL60 + K562 vs. BMC | 98.3% (118/120) | 98.3% (59/60) | 98.3% (177/180) |
| HL60 vs. BMC | 100% (60/60) | 100% (60/60) | 100% (120/120) |
| K562 vs. BMC | 100% (60/60) | 100% (60/60) | 100% (120/120) |
| HL60 vs. K562 | 95.0% (57/60) | 98.3% (59/60) | 96.7% (116/120) |
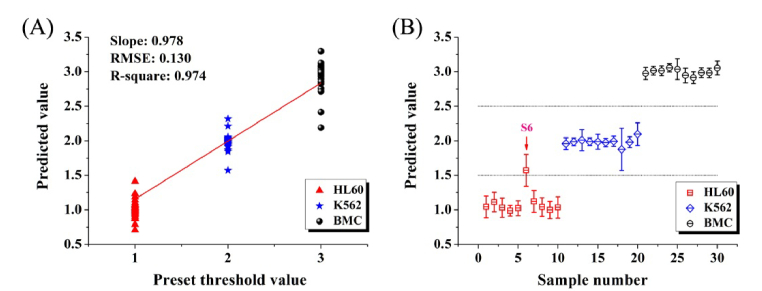
PLS is capable of performing classification analysis and discriminating species in different classes. Figure 8(A) shows the validation result for the calibration set of 150 subjects by leave-one-out cross-validation method. The RMSE value for the model was computed to be 0.130, and the correlation coefficients square between the predicted and the measured value was calculated to be 0.974. The predicted results of testing samples by PLS classification model are shown in Fig. 8(B). For the test set, the predicted value between 0.5 and 1.5 stands for HL60 cells, the value between 1.5 and 2.5 stands for K562 cells, and the value between 2.5 and 3.5 represents BMC respectively. The case that the predicted value is beyond the scope is viewed as a misjudgment. As shown in Fig. 8(B), only one sample was misjudged in 30 testing samples. The red arrow indicates the misjudged sample (sample 6). Ultimately, the diagnostic accuracy of PLS discrimination is 96.7% (29/30).
Fig. 8.
(A) Calibration result of leave-one-out cross-validation for the calibration set (n = 150, including 50 HL60 cells, 50 K562 cells and 50 BMC). The RMSE value is 0.130, and the correlation coefficients square value is 0.974. (B) Prediction results of partial least squares algorithm for the test set (n = 30, including 10 HL60 cells, 10 K562 cells and 10 BMC). The red arrow indicates the misjudged sample (sample 6).
4. Discussion
As indicated in Fig. 2, during the electroporation, when the membrane responded to the electric pulse, induced-pores in the two poles of cell toward to the electrodes were formed and then Ag NPs diffused into the cell in a short time through the pores on the membrane. When the electric pulse was finished, the membrane recovered and the delivered Ag NPs were then trapped inside the cell. The whole procedure is completed in a very short period and makes it very convenient and fast for Ag NPs delivery into living cells to act as the enhancing substrate for SERS detection.
We compared the mean SERS spectra of the normal bone marrow mononuclear cells (BMC) and two kinds of myeloid leukemia cells (HL60 cells and K562 cells). The results of our study demonstrated that there were specific differences in SERS spectra between normal cells and leukemia cells, suggesting a promising potential for SERS in leukemia cell detection and screening. The intensities of SERS peaks at 670, 896, 1004, 1053, 1240, 1296, 1341, 1402 and 1618 cm−1 appear to be unique with a certain degree of similar alterations of SERS signals in HL60 cells and K562 cells as compared to normal cells (BMC). This result indicates that HL60 cells and K562 cells still contain some similar constituents. Meanwhile, as shown in Fig. 4, both HL60 cells and K562 cells show higher intensities at 1053, 1296, 1341, 1402 and 1618 cm−1, while lower intensities at 670, 802, 896, and 1004 cm−1 as compared with BMC. This indicates that there is an increase or decrease in the percentage of a certain type of biomolecule in leukemia cells associated with abnormal metabolism and differentiation. For example, a decrease in SERS signal at 1004 cm−1 was found in leukemia cells as compared to BMC, suggesting a decrease in the percentage of phenylalanine relative to the total SERS-active constituents in cells. This is consistent with R. Vanna’s report on lower Raman signal of phenylalanine in myeloid leukemia cells [4]. In addition, compared with normal cells (BMC), the SERS peaks at 670, 802 and 896 cm−1, related to thymine/guanine, uracil and ribose-phosphate respectively, exhibited lower signal in HL60 cells and K562 cells, suggesting that there was abnormal proliferation of DNA or RNA in leukemia cells. However, the SERS peak intensity at 1618 cm−1 due to the amide I band exhibited higher signal in the leukemia cell groups. The Amide I band is a vibration mostly evoked by C = O stretching of the peptide bond which is present in all proteins. Therefore, this result basically means that there is more protein signal in leukemia cells compared to BMC. Besides, the SERS bands of amide III (1240 and 1296 cm−1) and collagen (1402 cm−1) in HL60 cells and K562 cells also show higher percentage signals than those of BMC, suggesting an increase in relative amounts of amino acids and collagen in leukemia cells.
From the above analysis, we can see that leukemia cells (HL60 cells or K562 cells) have significantly lower nucleic acid concentrations and higher protein concentrations. This result is in agreement with some previous studies on nasopharyngeal cells and human osteosarcoma derived cells [16,29]. However, a study utilizing Raman microspectroscopy observed higher DNA content in myeloid leukemia cells [27]. The apparent discrepancies between their results and those of ours are likely derived from different cell activity before Raman measurements. In their study, Raman spectra were measured from air-dried cells [27]. Conversely, we used a method based on electroporation for fast delivery of Ag NPs into living cells for intracellular SERS detection, and most of the cells were kept alive before SERS measurements. The loss of activity may result in specific biomolecular changes in the cell, such as molecular structure and quantity.
The reasons for having lower nucleic acid concentrations and higher protein concentrations in the HL60 and K562 cells compared with the normal cells remain unknown. It may be related to the fact that the cancer cells require a high level of transcription and an open configuration of the chromatin, while the normal cells show a highly condensed and inactive chromatin [30]. This may lead to a localized decrease in nucleic acid content in cancer cells. Meanwhile, only the biomolecular structures that are in contact or very close to the Ag NPs can provide useful information [13]. Therefore, the SERS technique probes only a confined area within a cell and obtains information about local biochemical composition. The above mentioned reasons may result in the relative concentrations of nucleic acid in leukemia cells to be lower than those in normal cells. In addition, leukemia cells also require a larger number of amino acids, collagen, protein and lipid to maintain the vigorous metabolism and proliferation. This explanation is consistent with the Raman spectroscopy study in neoplastic hematopoietic cells [31].
The multivariate statistical analysis method based on PCA-LDA was used in this study to differentiate the cells in high reliability. The comparison between normal cell group and leukemia cell groups were displayed in Fig. 5(B) and 5(C). Although there are some degree of overlap, we can see that most of the normal cells (BMC) were separated from HL60 cells and K562 cells, indicating that we are able to discriminate leukemia cells from normal cells. Moreover, as shown in Fig. 5(B), the regional distribution of the HL60 cell groups (or the K562 cell groups) is larger than for the normal cell groups (BMC). This is explainable. For normal cells, the proportions of the intracellular components are relatively stable. However, the biochemical constituents in leukemia cells could be quite variable from cell to cell due to the heterogeneity of malignant cell. Therefore the regional distribution of the leukemia cell group on the PCA scatter plot is much wider than for the normal cell group.
The use of the PLS approach would be beneficial for spectroscopic diagnostics since it provides group affinity information [24]. The performance of the final PLS model was evaluated by the RMSE of prediction, and the correlation coefficient (R). We know that a good calibration model is determined by a small RMSE value and a high correlation coefficient (R). Here, the RMSE value of 0.130 and the correlation coefficients square value of 0.974 implied a relatively ideal calibration model.
5. Conclusion
In this exploratory study, Ag NPs were rapidly delivered into living cells by electroporation for SERS applications in leukemia cell detection and screening. There were significant differences in SERS spectra between the myeloid leukemia cells and the normal bone marrow mononuclear cells. Tentative assignments of the SERS bands in the measured spectra showed specific biomolecular differences, including an increase in the relative amounts of proteins and a decrease in the percentage of nucleic acid and phenylalanine in leukemia cells as compared to normal cells. Using SERS spectroscopy combined with PCA-LDA analysis, we were able to differentiate the leukemia cells (HL60 cells plus K562 cells) from the normal cells with high diagnostic sensitivity (98.3%) and specificity (98.3%). Moreover, a diagnostic model developed by PLS successfully predicted the unidentified subjects with a diagnostic accuracy of 96.7%. The results of this study demonstrated that electroporation-based SERS spectroscopy in conjunction with PCA-LDA and PLS diagnostic algorithms has great potential for high-throughput cell screening applications. As a next step, we will collect more cell samples to verify the reliability of this potential cancer cell screening method.
Disclosures
The authors declare that there are no conflicts of interest related to this article.
Funding
National Natural Science Foundation of China (NSFC) (Nos. 61335011, 61405036, and 61575043); Strait United Funding Project (No. U1605253); Major Projects of International Cooperation (No. 61210016); National Key Basic Research Program of China (No. 2015CB352006); Natural Science Foundation of Fujian Province of China (Nos. 2017J01499, 2017J01843, 2017J01844 and 2015J01242); Project of the Educational Office of Fujian Province (No. JA15233); Program for New Century Excellent Talents in University of Education Bureau of Fujian Province of China.
References and links
- 1.Deschler B., Lübbert M., “Acute myeloid leukemia: epidemiology and etiology,” Cancer 107(9), 2099–2107 (2006). 10.1002/cncr.22233 [DOI] [PubMed] [Google Scholar]
- 2.Smith R., Wright K. L., Ashton L., “Raman spectroscopy: an evolving technique for live cell studies,” Analyst (Lond.) 141(12), 3590–3600 (2016). 10.1039/C6AN00152A [DOI] [PubMed] [Google Scholar]
- 3.Kallaway C., Almond L. M., Barr H., Wood J., Hutchings J., Kendall C., Stone N., “Advances in the clinical application of Raman spectroscopy for cancer diagnostics,” Photodiagn. Photodyn. Ther. 10(3), 207–219 (2013). 10.1016/j.pdpdt.2013.01.008 [DOI] [PubMed] [Google Scholar]
- 4.Vanna R., Ronchi P., Lenferink A. T., Tresoldi C., Morasso C., Mehn D., Bedoni M., Picciolini S., Terstappen L. W., Ciceri F., Otto C., Gramatica F., “Label-free imaging and identification of typical cells of acute myeloid leukaemia and myelodysplastic syndrome by Raman microspectroscopy,” Analyst (Lond.) 140(4), 1054–1064 (2015). 10.1039/C4AN02127D [DOI] [PubMed] [Google Scholar]
- 5.Wachsmann-Hogiu S., Weeks T., Huser T., “Chemical analysis in vivo and in vitro by Raman spectroscopy-from single cells to humans,” Curr. Opin. Biotechnol. 20(1), 63–73 (2009). 10.1016/j.copbio.2009.02.006 [DOI] [PMC free article] [PubMed] [Google Scholar]
- 6.Feng S., Wang W., Tai I. T., Chen G., Chen R., Zeng H., “Label-free surface-enhanced Raman spectroscopy for detection of colorectal cancer and precursor lesions using blood plasma,” Biomed. Opt. Express 6(9), 3494–3502 (2015). 10.1364/BOE.6.003494 [DOI] [PMC free article] [PubMed] [Google Scholar]
- 7.Lin D., Huang H., Qiu S., Feng S., Chen G., Chen R., “Diagnostic potential of polarized surface enhanced Raman spectroscopy technology for colorectal cancer detection,” Opt. Express 24(3), 2222–2234 (2016). 10.1364/OE.24.002222 [DOI] [PubMed] [Google Scholar]
- 8.Vo-Dinh T., Wang H. N., Scaffidi J., “Plasmonic nanoprobes for SERS biosensing and bioimaging,” J. Biophotonics 3(1-2), 89–102 (2010). 10.1002/jbio.200910015 [DOI] [PMC free article] [PubMed] [Google Scholar]
- 9.Nima Z. A., Mahmood M., Xu Y., Mustafa T., Watanabe F., Nedosekin D. A., Juratli M. A., Fahmi T., Galanzha E. I., Nolan J. P., Basnakian A. G., Zharov V. P., Biris A. S., “Circulating tumor cell identification by functionalized silver-gold nanorods with multicolor, super-enhanced SERS and photothermal resonances,” Sci. Rep. 4(1), 4752 (2015). 10.1038/srep04752 [DOI] [PMC free article] [PubMed] [Google Scholar]
- 10.Kneipp J., Kneipp H., Wittig B., Kneipp K., “Following the Dynamics of pH in Endosomes of Live Cells with SERS Nanosensors,” J. Phys. Chem. C 114(16), 7421–7426 (2010). 10.1021/jp910034z [DOI] [Google Scholar]
- 11.Kang J. W., So P. T., Dasari R. R., Lim D. K., “High resolution live cell Raman imaging using subcellular organelle-targeting SERS-sensitive gold nanoparticles with highly narrow intra-nanogap,” Nano Lett. 15(3), 1766–1772 (2015). 10.1021/nl504444w [DOI] [PMC free article] [PubMed] [Google Scholar]
- 12.Kneipp K., Haka A. S., Kneipp H., Badizadegan K., Yoshizawa N., Boone C., Shafer-Peltier K. E., Motz J. T., Dasari R. R., Feld M. S., “Surface-Enhanced Raman Spectroscopy in Single Living Cells Using Gold Nanoparticles,” Appl. Spectrosc. 56(2), 150–154 (2002). 10.1366/0003702021954557 [DOI] [Google Scholar]
- 13.Kneipp J., Kneipp H., Wittig B., Kneipp K., “Novel optical nanosensors for probing and imaging live cells,” Nanomedicine (Lond.) 6(2), 214–226 (2010). 10.1016/j.nano.2009.07.009 [DOI] [PubMed] [Google Scholar]
- 14.Giljohann D. A., Seferos D. S., Daniel W. L., Massich M. D., Patel P. C., Mirkin C. A., “Gold Nanoparticles for Biology and Medicine,” Angew. Chem. Int. Ed. Engl. 49(19), 3280–3294 (2010). 10.1002/anie.200904359 [DOI] [PMC free article] [PubMed] [Google Scholar]
- 15.Marisca O. T., Kantner K., Pfeiffer C., Zhang Q., Pelaz B., Leopold N., Parak W. J., Rejman J., “Comparison of the in Vitro Uptake and Toxicity of Collagen- and Synthetic Polymer-Coated Gold Nanoparticles,” Nanomaterials (Basel) 5(3), 1418–1430 (2015). 10.3390/nano5031418 [DOI] [PMC free article] [PubMed] [Google Scholar]
- 16.Feng S., Li Z., Chen G., Lin D., Huang S., Huang Z., Li Y., Lin J., Chen R., Zeng H., “Ultrasound-mediated method for rapid delivery of nano-particles into cells for intracellular surface-enhanced Raman spectroscopy and cancer cell screening,” Nanotechnology 26(6), 065101 (2015). 10.1088/0957-4484/26/6/065101 [DOI] [PubMed] [Google Scholar]
- 17.Yu Y., Wang J., Lin J., Lin D., Chen W., Feng S., Huang Z., Li Y., Huang H., Shi H., Chen R., “An optimized electroporation method for delivering nanoparticles into living cells for surface-enhanced Raman scattering imaging,” Appl. Phys. Lett. 108(15), 153701 (2016). 10.1063/1.4947009 [DOI] [Google Scholar]
- 18.Lin J., Chen R., Feng S., Li Y., Huang Z., Xie S., Yu Y., Cheng M., Zeng H., “Rapid delivery of silver nanoparticles into living cells by electroporation for surface-enhanced Raman spectroscopy,” Biosens. Bioelectron. 25(2), 388–394 (2009). 10.1016/j.bios.2009.07.027 [DOI] [PubMed] [Google Scholar]
- 19.Leopold N., Lendl B., “A New Method for Fast Preparation of Highly Surface-Enhanced Raman Scattering (SERS) Active Silver Colloids at Room Temperature by Reduction of Silver Nitrate with Hydroxylamine Hydrochloride,” J. Phys. Chem. B 107(24), 5723–5727 (2003). 10.1021/jp027460u [DOI] [Google Scholar]
- 20.Seeger F. H., Tonn T., Krzossok N., Zeiher A. M., Dimmeler S., “Cell isolation procedures matter: a comparison of different isolation protocols of bone marrow mononuclear cells used for cell therapy in patients with acute myocardial infarction,” Eur. Heart J. 28(6), 766–772 (2007). 10.1093/eurheartj/ehl509 [DOI] [PubMed] [Google Scholar]
- 21.Zhao J., Lui H., McLean D. I., Zeng H., “Automated Autofluorescence Background Subtraction Algorithm for Biomedical Raman Spectroscopy,” Appl. Spectrosc. 61(11), 1225–1232 (2007). 10.1366/000370207782597003 [DOI] [PubMed] [Google Scholar]
- 22.Feng S., Chen R., Lin J., Pan J., Chen G., Li Y., Cheng M., Huang Z., Chen J., Zeng H., “Nasopharyngeal cancer detection based on blood plasma surface-enhanced Raman spectroscopy and multivariate analysis,” Biosens. Bioelectron. 25(11), 2414–2419 (2010). 10.1016/j.bios.2010.03.033 [DOI] [PubMed] [Google Scholar]
- 23.Lin D., Pan J., Huang H., Chen G., Qiu S., Shi H., Chen W., Yu Y., Feng S., Chen R., “Label-free blood plasma test based on surface-enhanced Raman scattering for tumor stages detection in nasopharyngeal cancer,” Sci. Rep. 4(1), 4751 (2015). 10.1038/srep04751 [DOI] [PMC free article] [PubMed] [Google Scholar]
- 24.Wang J., Lin D., Lin J., Yu Y., Huang Z., Chen Y., Lin J., Feng S., Li B., Liu N., Chen R., “Label-free detection of serum proteins using surface-enhanced Raman spectroscopy for colorectal cancer screening,” J. Biomed. Opt. 19(8), 087003 (2014). 10.1117/1.JBO.19.8.087003 [DOI] [PubMed] [Google Scholar]
- 25.Ghasemi J., Ahmadi S., Torkestani K., “Simultaneous determination of copper, nickel, cobalt and zinc using zincon as a metallochromic indicator with partial least squares,” Anal. Chim. Acta 487(2), 181–188 (2003). 10.1016/S0003-2670(03)00556-7 [DOI] [Google Scholar]
- 26.Mert S., Çulha M., “Surface-enhanced Raman scattering-based detection of cancerous renal cells,” Appl. Spectrosc. 68(6), 617–624 (2014). 10.1366/13-07263 [DOI] [PubMed] [Google Scholar]
- 27.Neugebauer U., Clement J. H., Bocklitz T., Krafft C., Popp J., “Identification and differentiation of single cells from peripheral blood by Raman spectroscopic imaging,” J. Biophotonics 3(8-9), 579–587 (2010). 10.1002/jbio.201000020 [DOI] [PubMed] [Google Scholar]
- 28.Movasaghi Z., Rehman S., Rehman D. I. U., “Raman Spectroscopy of Biological Tissues,” Appl. Spectrosc. Rev. 42(5), 493–541 (2007). 10.1080/05704920701551530 [DOI] [Google Scholar]
- 29.Notingher I., Jell G., Lohbauer U., Salih V., Hench L. L., “In situ non-invasive spectral discrimination between bone cell phenotypes used in tissue engineering,” J. Cell. Biochem. 92(6), 1180–1192 (2004). 10.1002/jcb.20136 [DOI] [PubMed] [Google Scholar]
- 30.Uzunbajakava N., Lenferink A., Kraan Y., Volokhina E., Vrensen G., Greve J., Otto C., “Nonresonant Confocal Raman Imaging of DNA and Protein Distribution in Apoptotic Cells,” Biophys. J. 84(6), 3968–3981 (2003). 10.1016/S0006-3495(03)75124-8 [DOI] [PMC free article] [PubMed] [Google Scholar]
- 31.Chan J. W., Taylor D. S., Zwerdling T., Lane S. M., Ihara K., Huser T., “Micro-Raman Spectroscopy Detects Individual Neoplastic and Normal Hematopoietic Cells,” Biophys. J. 90(2), 648–656 (2006). 10.1529/biophysj.105.066761 [DOI] [PMC free article] [PubMed] [Google Scholar]


