

ABSTRACT
Induced pluripotent stem cells (iPSCs) have fewer and immature mitochondria than somatic cells and mainly rely on glycolysis for energy source. During somatic cell reprogramming, somatic mitochondria and other organelles get remodeled. However, events of organelle remodeling and interaction during somatic cell reprogramming have not been extensively explored. We show that both SKP/SKO (Sox2, Klf4, Pou5f1/Oct4) and SKPM/SKOM (SKP/SKO plus Myc/c-Myc) reprogramming lead to decreased mitochondrial mass but with different kinetics and by divergent pathways. Rapid, MYC/c-MYC-induced cell proliferation may function as the main driver of mitochondrial decrease in SKPM/SKOM reprogramming. In SKP/SKO reprogramming, however, mitochondrial mass initially increases and subsequently decreases via mitophagy. This mitophagy is dependent on the mitochondrial outer membrane receptor BNIP3L/NIX but not on mitochondrial membrane potential (ΔΨm) dissipation, and this SKP/SKO-induced mitophagy functions in an important role during the reprogramming process. Furthermore, endosome-related RAB5 is involved in mitophagosome formation in SKP/SKO reprogramming. These results reveal a novel role of mitophagy in reprogramming that entails the interaction between mitochondria, macroautophagy/autophagy and endosomes.
KEYWORDS: autophagy, BNIP3L, endosome, mitophagy, reprogramming
Introduction
Generation of induced pluripotent stem cells (iPSCs) by ectopic expression of SKP/SKO or SKPM/SKOM has shown great promise in regenerative medicine, aside from considering issues of ethics and tissue rejection.1 Mechanisms of somatic cell reprogramming have been revealed at many phenotypic levels: epigenetic,2 proteomic,3 chromosomal,4 metabolic5-7 and others. Little has been reported on the effects of reprogramming on the organelles. Whether and how organelle remodeling and interorganellar interactions function in reprogramming is largely unknown.
In addition to important roles in energy metabolism, calcium homeostasis, cell signaling, and apoptosis, mitochondria play crucial roles in cell fate determination.8,9 In pluripotent stem cells, mitochondrial content is reduced and the organelles have an immature structure and reduced oxidative phosphorylation, compared with somatic cells.8 Increasing evidence shows that mitochondrial mass decreases significantly and energy metabolism switches from oxidative phosphorylation to glycolysis during the somatic cell reprogramming process,6,10 but the precise molecular mechanism remains unclear.
One possible mechanism for the reduction of mitochondrial mass and metabolism during reprogramming is autophagic elimination of mitochondria, known as mitophagy.11 Autophagy is a process by which cytoplasmic organelles can be catabolized either to remove defective structures or provide macromolecules for energy generation.12 The activation of autophagy has been reported during SKPM/SKOM-induced reprogramming.13-15
To date, several distinct mitophagy receptors have been reported in mammals, and can be divided into 2 groups according to the manner of targeting mitochondria. One group of mitophagy receptors contains a ubiquitin-binding domain which localizes them to PARK2/PARKIN-ubiquitinated mitochondria. This PINK1 (PTEN induced putative kinase 1 (PINK1)-PARK2/PARKIN system targets mitophagy receptors to depolarized mitochondria via ubiquitination of mitochondrial outer membrane (OMM) proteins.16 The other group of OMM-anchored receptors includes BNIP3, its paralog BNIP3L/NIX, FUNDC1 and BCL2L13 (BCL2-like 13 [apoptosis facilitator].17-23 Both BNIP3 and BNIP3L function as mitophagy receptors in skeletal muscle24 and cardiac cells.25 BNIP3-mediated mitophagy participates in mitochondrial homeostasis in liver.26 BNIP3L is essential for mitochondrial clearance during reticulocyte maturation,17-19 and is also involved in mitophagy in an energy-status-dependent manner,27 as well as in reactive oxygen species-mediated autophagy.28 FUNDC1, an integral mitochondrial outer-membrane protein, is a receptor for hypoxia-induced mitophagy in mammalian cells.22 BCL2L13 is another mitophagy receptor in mammalian cells and is an ortholog of yeast Atg32, which is required for mitophagy.23,29 The implication of mitophagy in the somatic cell reprogramming process presents a new direction for mitophagy research.
Here, we show that mitochondrial-mass reduction in SKP/SKO- and SKPM/SKOM-induced reprogramming follows different patterns. In SKPM/SKOM reprogramming, MYC/c-MYC is the main inducer for mitochondrial-mass decrease due to rapid cell division. In SKP/SKO reprogramming, mitochondrial mass actually increases in the initial period but decreases substantially from d 5 to d 7, without rapid cell proliferation. We focused on SKP/SKO reprogramming and found that mitophagy in fact occurs and accounts for the decrease of mitochondrial mass in reprogramming. It functions in a BNIP3L-dependent manner independent of ΔΨm. Furthermore, we found that endosome-related RAB5 is involved in the formation of mitophagosomes in SKP/SKO-induced reprogramming, which may imply an interorganellar interaction between endosome and mitophagosome.
Results
Mitochondrial mass decreases in somatic cell reprogramming
To visualize the change of mitochondrial mass at different days during somatic cell reprogramming, ACTB fusion with GFP (ACTB-GFP) and mitochondrial targeted-DsRed (mtDsRed) were used to mark ACTB and mitochondria, respectively (Fig. 1A). The mtDsRed fluorescent area per cell was quantified to reflect mitochondrial mass, and cells infected with Flag retrovirus were used as control to which mitochondrial area was normalized. Compared to control, mitochondrial area per cell of mouse embryonic fibroblasts (MEFs) undergoing SKP/SKO reprogramming increased until d 5 and then decreased from d 7 to d 11 (Fig. 1B). Conversely, mitochondrial area per cell of MEFs undergoing SKPM/SKOM reprogramming showed a robust decrease at d 3 and maintained a similar level until d 11 (Fig. 1B). MYC/c-MYC has been reported to be the key regulator in cell proliferation.30,31 We then measured mitochondrial area per cell of MEFs with single MYC, which showed a pattern similar to that with SKPM/SKOM (Fig. 1A and C). In addition, MitoTracker Green was used to stain mitochondria in MEFs undergoing reprogramming, and the fluorescence intensity (FI) of cells was measured by flow cytometry to reflect mitochondrial mass per cell. Consistent with the data noted above, mitochondrial mass per cell showed a similar pattern as reflected by mitochondrial area (Fig. 1D and E). To further confirm these observations, we tracked the mitochondrial DNA (mtDNA) copy number during reprogramming and showed that mtDNA copy number changed in a similar pattern as mitochondrial area and mass, confirming removal of mitochondria during the reprogramming process (Fig. S1A).
Figure 1.
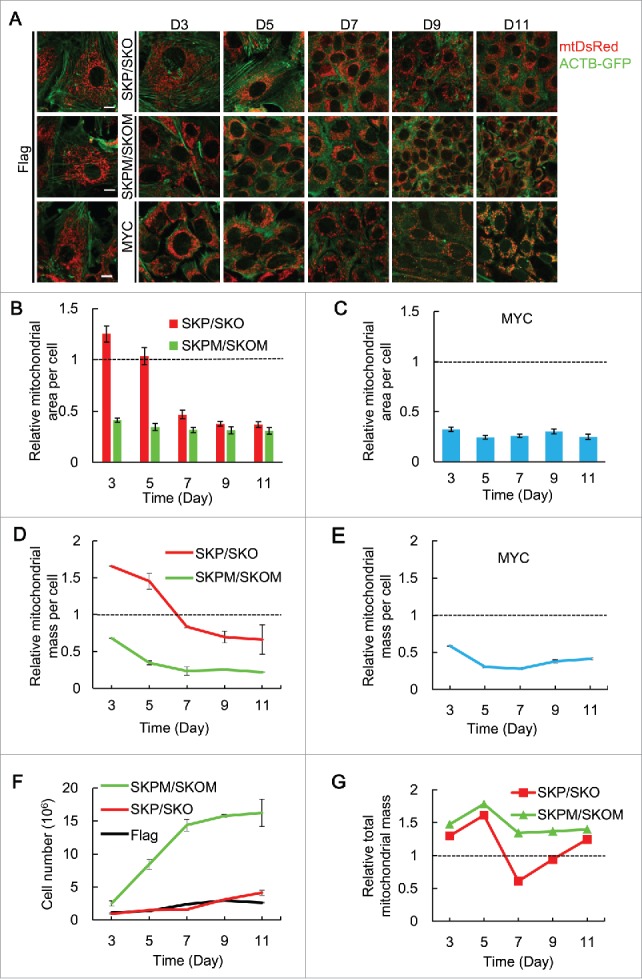
Mitochondrial mass decreases in MEFs undergoing reprogramming with SKP/SKO or SKPM/SKOM. (A) Indicative images for mitochondrial area in MEFs transduced with Flag, SKP/SKO, SKPM/SKOM or MYC for d 3, 5, 7, 9, 11 (for each group of images, mitochondria are shown in red, ACTB in green) Scale bars: 10 µm. (B) Quantification of relative mitochondrial area per cell transduced with SKP/SKO, SKPM/SKOM in (A). Mean average of 200 cells is shown ± 10. Error bars = s.e.m. (C) Quantification of relative mitochondrial area per cell transduced with single MYC in (A). Mean average of 200 cells is shown ± 10. Error bars = s.e.m. (D) Relative mitochondrial mass per cell transduced with SKP/SKO or SKPM/SKOM (n = 3). (E) Relative mitochondrial mass per cell transduced with MYC (n = 3). (F) Proliferation curves for cells transduced with Flag, SKP/SKO and SKPM/SKOM, respectively. (G) Total mitochondrial mass of cells transduced with SKP/SKO or SKPM/SKOM in a dish (calculated by mitochondrial mass/cell [Fig. 1D data] × cell number [Fig. 1F data]).
Concurrent with mitochondrial mass measurements, we quantified cell proliferation of MEFs undergoing reprogramming with SKP/SKO or SKPM/SKOM. As shown in Fig. 1F, MEFs undergoing SKPM/SKOM reprogramming displayed much higher proliferation than either MEFs undergoing SKP/SKO reprogramming or controls. This indicates that Myc strongly promotes cell division resulting in the cell number rapidly increasing, consistent with previous reports.30,31 Then, we asked if we rule out the factor of cell division rate, how the total mitochondrial mass in a dish (mitochondrial mass/cell × cell number) is affected by SKP/SKO or SKPM/SKOM. Figure 1G shows the different effects of SKPM/SKOM and SKP/SKO: compared with the control, total mitochondrial mass was relatively constant from d 3 to d 11 in SKPM/SKOM, whereas SKP/SKO increased total mitochondrial mass until d 5, followed by a sharp decrease from d 5 to d 7, then increased again to d 11. In support of these observations, we detected the expression level of the mitochondrial protein TOMM20 (translocase of outer mitochondrial membrane 20 homolog [yeast]) and found that TOMM20 increased from d 3 to d 5 and was maintained at a relatively constant from d 5 to d 11 in SKPM/SKOM, whereas SKP/SKO increased TOMM20 expression until d 5, followed by a sharp decrease from d 5 to d 7, then increased again to d 11 (Fig. S1B). We also quantified the expression of several mitochondrial biogenesis-related genes and found the expression of these genes was upregulated in both SKP/SKO and SKPM/SKOM reprogramming, excluding the possibility that inhibition of mitochondrial biogenesis is responsible for the decrease of mitochondrial mass (Fig. S2). Western blot analysis of PPARGC1A/PGC1a provided further evidence for this conclusion (Fig. S3). Together, these data indicate that mitochondrial mass during reprogramming shows highly dissimilar patterns in SKP/SKO and SKPM/SKOM reprogramming. In SKPM/SKOM reprogramming, Myc functions as one of the main inducers for the per cell reduction of the mitochondrial content by cell proliferation that is not accompanied by commensurate mitochondrial biogenesis. By contrast, in SKP/SKO reprogramming the data imply an active elimination of mitochondrial mass from d 5 to d 7.
Mitophagy accounts for the elimination of mitochondria in a ΔΨm-independent manner in SKP/SKO reprogramming
As degradation of mitochondria by the autophagy machinery is a fundamental process conserved from yeast to humans,32 we hypothesized that autophagy accounts for the decrease of mitochondrial mass during SKP/SKO reprogramming. MAP1LC3/LC3 (microtubule-associated protein 1 light chain 3) is critical for autophagosome formation and commonly used as a molecular marker. The cytosolic LC3-I form is converted into a phosphatidylethanolamine-conjugated LC3-II form upon autophagic stimuli.33,34 As shown in Fig. 2A, the LC3B-II form (the lower band) is upregulated and peaked around d 7 in SKP/SKO in the absence or presence of bafilomycin A1 (BAF), which is an inhibitor of both lysosome acidification and autophagosome-lysosome fusion.35,36 This indicates that an active autophagic flux is induced in SKP/SKO reprogramming, thus excluding that LC3B-II accumulation is due to blockade of the autophagy pathway.
Figure 2.

Mitophagy occurs in MEFs undergoing reprogramming with SKP/SKO. (A) Protein expression levels of LC3B-I and LC3B-II forms from MEFs for d 3 to d 11 postinfection with SKP/SKO with or without BAF treatment (n = 3). (B) Colocalization between mtDsRed and GFP-LC3B during SKP/SKO reprogramming; scale bar: 10 µm. (C) Number of GFP-LC3B dots overlapping with mtDsRed during SKP/SKO reprogramming. (D) Colocalization of LAMP1-GFP and mtDsRed during SKP/SKO reprogramming; scale bar: 10 µm. (E) Colocalization coefficient of LAMP1-GFP and mtDsRed during SKP/SKO reprogramming at d 5 (Mean value of 20 cells is shown; *** P < 0.001).
To visualize the occurrence of mitophagy during reprogramming, GFP-LC3B and mtDsRed were used to mark autophagosomes and mitochondria, respectively. As shown in Fig. 2B and C, the number of GFP-LC3B dots which colocalize with mtDsRed (mitophagosomes) increased until d 5 and then decreased gradually in SKP/SKO-induced reprogramming. This indicates that mitophagy mainly occurs around d 5 during reprogramming. As autophagosomes deliver their to-be-recycled contents to the lysosome,37 we next visualized the colocalization between lysosomes and mitochondria by coexpression of LAMP1 (lysosomal-associated membrane protein 1) fused to GFP (LAMP1-GFP, a marker of lysosomes) and mtDsRed in MEFs undergoing SKP/SKO reprogramming (Fig. 2D). Compared to cells infected with Flag, the colocalization coefficient of mitochondria and lysosomes was significantly higher in SKP/SKO reprogramming compared with controls, confirming that mitochondria enter the autophagic pathway and are degraded by lysosomes during SKP/SKO reprogramming (Fig. 2E).
To further confirm the occurrence of mitophagy, we used mt-mKeima, which emits different-colored signals at acidic and neutral pH, to reflect mitophagy.38,39 As shown in Fig. 3A, the ratio of 543:458 increased significantly in SKP/SKO reprogramming in contrast to Flag, which implies an active elimination of mitochondria through mitophagy. In addition, BAF was used during SKP/SKO reprogramming. We observed the double-membrane autophagosomes enclosing mitochondria by transmission electron microscopy (TEM) during SKP/SKO-induced reprogramming, especially in the reprogramming cells with BAF treatment (Fig. 3B). Furthermore, we detected the expression level of mitochondrial protein TOMM20 by western blot to reflect mitochondrial mass change in the absence and presence of BAF. As shown in Fig. 3C and Fig. S4, mitochondrial mass reduction was blocked by the treatment with BAF in SKP/SKO reprogramming at day 5. We inhibited the function of ATG12–ATG5, a key complex in autophagosome formation,40 and found the expression level of TOMM20 was restored to some extent by knockdown of Atg5 or Atg12 (Fig. S5). Moreover, the treatment with BAF significantly restored the decrease of mitochondrial mass in reprogramming (Fig. 3D). In addition, BAF was added during SKP/SKO-induced reprogramming from d 5 to d 7 (4 h for each day), and we found that reprogramming efficiency was significantly reduced (Fig. S7) (characterization of iPSCs generated with SKP/SKO is shown in Fig. S6). These data indicate that autophagy accounts for the decrease of mitochondrial mass during SKP/SKO reprogramming. The loss of ΔΨm has been reported as a signal for PINK1-PARK2-mediated mitophagy.16 To test this possibility, tetramethylrhodamine methyl ester (TMRM), an indicator of ΔΨm, was used together with mt-CFP and YFP-LC3B to visualize the relationship between ΔΨm and autophagosome formation. Mitochondria with both high ΔΨm and low ΔΨm colocalized with YFP-LC3B dots, and the percentage of high ΔΨm mitophagosomes was 53.6 ± 5.1% (Fig. 3E and F). Besides, either in the Flag or SKP/SKO treatments, we could not observe YFP-PARK2 dots (Fig. S8), which have been reported to distribute from the cytosol to mitochondria for mitophagy upon mitochondrial-uncoupler treatment.16 These observations suggest that the occurrence of mitophagy in SKP/SKO-induced reprogramming is independent of ΔΨm, i.e. not selective for damaged organelles.
Figure 3.

Mitophagy contributes to the elimination of mitochondria in a ΔΨm-independent manner in SKP/SKO reprogramming. (A) Double dual-excitation ratiometric imaging of mt-mKeima in MEFs transduced with Flag or SKP/SKO; scale bar: 10 µm. (B) Representative TEM image of mitophagy during SKP/SKO reprogramming at d 5; scale bar: 500 nm. The boxed regions are magnified below; scale bar: 500 mm (C) Western blot analysis of TOMM20 from MEFs transduced with Flag or SKP/SKO in the absence and presence of BAF at d 5 (MEFs transduced with Flag or SKP/SKO were treated with BAF or DMSO for 4 h before sampling). (D) Relative mitochondrial mass of MEFs undergoing SKP/SKO reprogramming with or without BAF treatment (** P < 0.01). (E) ΔΨm of mitophagosomes by triple labeling with YFP-LC3B, mt-CFP and TMRM. FI value of TMRM reflects ΔΨm (H: high ΔΨm; L: low ΔΨm); scale bar: 10 µm. (F) The percentage of mitophagosomes with high or low ΔΨm.
BNIP3L is essential for the elimination of mitochondria in SKP/SKO reprogramming
As BNIP3L functions as a mitophagy receptor in multiple conditions,17-19,28 we speculated that BNIP3L might be involved in mitophagy during SKP/SKO reprogramming. We measured the expression of BNIP3L at different time points of reprogramming and found that the BNIP3L expression level peaked around d 5 (Fig. 4A and Fig. S9). Together with the observation that mitophagy peaked around d 5 (Fig. 2C), we hypothesized that BNIP3L correlated the occurrence of mitophagy in SKP/SKO reprogramming. To test this, we applied Bnip3l silencing in SKP/SKO-induced reprogramming (Fig. S10). Bnip3l silencing by shRNA dramatically decreased mitophagosomes in SKP/SKO reprogramming (Fig. 4B and Fig. S11). Meanwhile, the Bnip3l silencing had no effect on autophagy, reflected by the expression level of LC3B (Fig. S12). Furthermore, Bnip3l silencing significantly restored the decrease of mitochondrial mass, indicating that BNIP3L played an important role in mitophagy during SKP/SKO reprogramming (Fig. 4C). Moreover, Bnip3l silencing restored the mitochondrial mass, reflected by TOMM20, to some extent at d 5 (Fig. 4D and Fig. S13). To investigate the involvement of BNIP3L-mediated mitophagy in pluripotency acquirement, we applied Bnip3l silencing in SKP/SKO reprogramming and found that Bnip3l silencing significantly decreased the number of GFP-positive colonies, which is an indicator for establishment of pluripotency (Fig. 4E). This indicates that BNIP3L-dependent mitophagy plays a role in SKP/SKO reprogramming. In addition, dissimilar from SKP/SKO reprogramming, BNIP3L expression was consistently upregulated in SKPM/SKOM reprogramming (Fig. S14A). Meanwhile, Bnip3l silencing plus SKPM/SKOM reprogramming had no effect on reprogramming efficiency (Fig. S14B). Together, these data exclude the possibility that decreased reprogramming efficiency in SKP/SKO plus Bnip3l silencing is related to its deleterious effect on acquisition of pluripotency.
Figure 4.
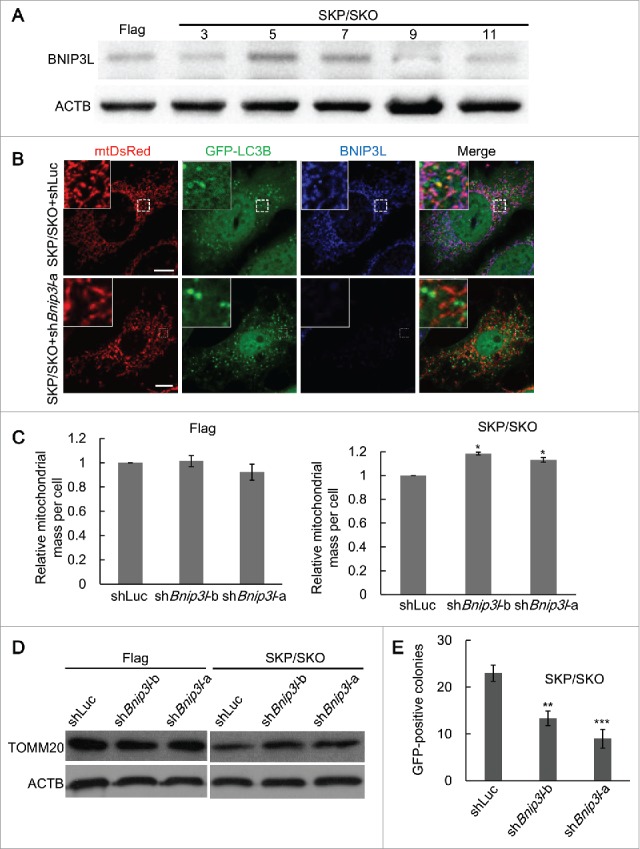
BNIP3L-dependent mitophagy accounts for the decrease of mitochondrial mass during SKP/SKO reprogramming. (A) Protein expression levels of BNIP3L in MEFs transduced with Flag or SKP/SKO (n = 3). (B) Representative images of mitophagosomes in MEFs undergoing SKP/SKO reprogramming with shRNA against Bnip3l or luciferase (Luc) as control at d 5; scale bar: 10 µm. (C) Quantification of relative mitochondrial mass in MEFs transduced with Flag or SKP/SKO plus shBnip3l or shLuc at d 5 (* P < 0.05). (D) Western blot analysis of TOMM20 from MEFs transduced with Flag or SKP/SKO plus shBnip3l or shLuc at d 5 (n = 3). (E) Reprogramming efficiency (represented by GFP-positive colonies) in MEFs transduced with SKP/SKO plus shBnip3l or shLuc (** P < 0.01; *** P < 0.001) (MEFs transduced with SKP/SKO retrovirus can be reprogrammed into iPSCs colonies, and GFP-positive colonies are used to define the fully reprogrammed iPSCs).
RAB5 is involved in the process of mitophagy in SKP/SKO reprogramming
As disparate intracellular sources including the endoplasmic reticulum (ER), Golgi and recycling endosome have been implicated to contribute membrane to autophagosome formation during different conditions,41-44 we then asked how these organelles are related to autophagsome formation during SKP/SKO-induced reprogramming. We used fluorescence-fusion proteins including ER-mCherry and B4GALT-mCherry to label ER and Golgi, while RAB5A-, RAB7- and RAB11A-mCherry were used to mark early endosomes (EE),45 late endosomes (LE),46 and recycling endosomes (RE),47 respectively. These proteins were expressed together with GFP-LC3B in MEFs undergoing SKP/SKO reprogramming. All types of endosomes—EE, LE and RE—but not Golgi or ER, showed substantial colocalization with GFP-LC3B (Fig. 5A and B), and these data imply that different types of endosomes are closely related to autophagosomes in SKP/SKO-induced reprogramming.
Figure 5.

Endosomes are involved in autophagosome formation in SKP/SKO-induced reprogramming. (A) Chimeric markers targeted to different organelles were expressed during SKP/SKO reprogramming at d 5 (top to bottom: early endosomes (EE, RAB5A), late endosomes (LE, RAB7), recycling endosomes (RE, RAB11A), Golgi (B4GALT), and endoplasmic reticulum (ER); scale bar: 10 µm (B) Quantification of GFP-LC3B overlap with different organelle membrane markers. (C) Persistent signal of early endosome membrane on an autophagosome by a photobleaching outside the ROI assay during SKP/SKO reprogramming at d 5. All fluorescence outside the ROI (marked by square) was photobleached. The fluorescence within ROI was monitored after photobleaching. Scale bars: 5 µm, upper panel; 1 µm, lower panel.
To confirm that the involvement of endosomes for autophagosome formation during SKP/SKO reprogramming, we performed the photobleaching outside the region of interest (ROI) assay,48 which has been reported to study membrane transfer and stability. RAB5A-mCherry and GFP-LC3B were coexpressed in cells, and the dot which is mCherry- and GFP-double-positive was selected and defined as the ROI. Then we applied photobleaching outside the ROI to deplete all mCherry signal except that present on selected, isolated autophagic vesicles. After photobleaching, fluorescence of the ROI cannot be compensated by the signal from outside of the ROI. Upon photobleaching, fluorescence in the ROI was monitored, and RAB5A-mCherry showed a persistent signal on these isolated autophagosomes for more than 3 min (Fig. 5C). LE and RE also showed similar results after photobleaching outside the ROI (Fig. S15). The stability of the RAB-mCherry constructs indicates that endosomes are not undergoing autophagy and disappearing, but are involved in regulating the formation of autophagosomes.
To further elucidate the roles of Rab5a, Rab7 and Rab11a in autophagy in SKP/SKO reprogramming, Rab5 silencing by shRNA was applied in this context (Fig. S16A). We found that it had no effect on LC3B dots, while the colocalization of autophagosomes and mitochondria was dramatically decreased in SKP/SKO reprogramming compared with controls, which indicates that the mitophagosome number decreased upon Rab5 silencing (Fig. 6A and B). Furthermore, we applied Rab7 and Rab11 silencing, and both had no effect on mitophagosome formation (Fig. S16B and C and Fig. S17). Overall, these data demonstrate that Rab5 is involved in the formation of mitophagosomes in SKP/SKO reprogramming.
Figure 6.
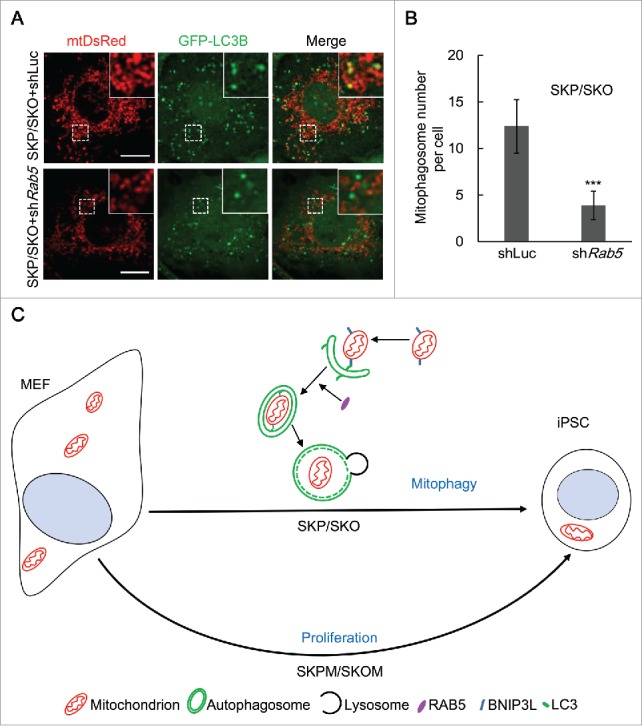
Rab5 is involved in the process of mitophagy in SKP/SKO reprogramming. (A) Representative images of mitophagosomes in MEFs undergoing SKP/SKO reprogramming at d 5 with shRNA against Rab5 or Luc as control; scale bar: 10 µm. (B) Quantification of mitophagosomes in MEFs undergoing reprogramming with SKP/SKO plus shRab5 or shLuc (n = 20; *** P < 0.001). (C) Model of mitophagy in SKP/SKO reprogramming.
Discussion
Here we present a novel function of mitophagy in somatic cell reprogramming that leads to a decrease in mitochondrial mass when reprogramming is mediated by SKP/SKO. Mitophagy plays important roles in physiological and pathological conditions.49 However, in cell fate or cell lineage determination, mitophagy has seldom been explored. In erythroid cell and T cell development, mitophagy plays an essential role.17-19,50 In pluoripotent stem cells including embryonic stem cells and iPSCs, the mitochondrial amount has been reported to be markedly reduced compared with somatic cells.13 Interestingly, we observed an elevated LC3B-II conversion (Fig. 2A) and transient mitophagosome formation at d 5 during SKP/SKO reprogramming (Fig. 2B and C). Only mitochondria, but not ER or Golgi (Fig 5A and B) undergo autophagy. In addition, peroxisomes were not found to undergo autophagy, either (Fig. S18). Indeed, we demonstrated the occurrence of mitophagy by using mt-mKeima (Fig. 3A), to detect the colocalization between mitochondria and lysosomes (Fig. 2D and E) and also by analyzing the effect of shAtg5 and shAtg12 on mitochondrial amount (Fig. S5). Specifically, we determined that mitophagy in SKP/SKO reprogramming was BNIP3L-dependent. BNIP3L showed an expression peak similar to that of mitophagosome occurrence (Fig. 2B and C and Fig. 4A) and was required for mitophagy (Fig. 4C and D and Fig. S13). Thus, we ruled out the possibility that the observed mitophagy is a byproduct of overactivated autophagy, but it is BNIP3L-mediated. Our findings on mitophagy in somatic cell reprogramming shed light on the role of mitochondrial mass regulation during cell fate determination.
Mitochondrial mass decreases in both SKP/SKO- and SKPM/SKOM-induced reprogramming but according to different patterns (Fig. 6C). Myc has been reported to promote rapid cell division,51 while our data (Fig. S2 and S3) and previous reports8,52 show that the expressions of mitochondrial biogenesis genes remained unchanged or increased during SKPM/SKOM reprogramming. Thus, the cell division is much faster than mitochondrial biogenesis, resulting in smaller cells with fewer mitochondria in SKPM/SKOM reprogramming. At present, Myc is considered to be dispensable for somatic cell reprogramming.53,54 In SKP/SKO reprogramming, the cell proliferation rate is not obviously affected, but the reprogrammed iPSCs also have reduced mitochondrial content. This supplies us with an ideal system to test hypotheses of the involvement of mitophagy in cell fate determination. Consistent with the previous reports in SKPM/SKOM reprogramming,13,14 activation of autophagy was also observed in our SKP/SKO reprogramming system, whereby autophagy reached a peak around d 7 and then subsided. Besides, decreased mitochondrial mass and active autophagy was also observed in tail-tip fibroblasts (TTFs) transduced with SKP/SKO (Fig. S19). We have demonstrated the occurrence of mitophagy and its responsibility for mitochondrial clearance in SKP/SKO reprogramming by multiple methods.
The mechanisms of mitophagy described in yeast and mammals seem to be limited to particular physiological conditions.27 Recent studies demonstrate that damaged mitochondria are selectively degraded by mitophagy in a ΔΨm-dependent manner.16,55 BNIP3L or BNIP3 serve as mitophagy receptors in liver, muscle and reticulocyte maturation.17-19,24-26 However, the mitophagy receptors in stem cell fate remain to be investigated. In our study, we exclude this possibility in somatic cell reprogramming because autophagosome formation was observed to be associated with mitochondria with both high and low ΔΨm, and YFP-PARK2 dots were not observed. BNIP3L, an outer mitochondrial membrane LC3 receptor, is essential for targeting mitochondria for autophagic degradation17-19 and our data show that BNIP3L-mediated mitophagy accounts for the decrease of mitochondrial mass in SKP/SKO-induced reprogramming process.
We revealed a paradigm for membrane trafficking between organelles during the process of mitophagosome formation in SKP/SKO-induced reprogramming: Different types of endosomes but not ER or Golgi are involved in the early step of autophagosome formation, and RAB5 is required for the process of generating mitophagosomes. Members of the small GTPase RAB protein family, well-known regulators of membrane trafficking and fusion events, play key roles in the regulation of the autophagic process. RAB5 is a regulator of the early steps of autophagosome formation that recruits the autophagy-specific BECN1-PIK3C3 complex resulting in subsequent PtdIns3P production on the phagophore membrane.56-59 RAB11 is required for providing an RE-derived membrane source for the autophagosome precursors44 and phagophore expansion.60 In particular during PARK2-mediated mitophagy, RAB7 plays a role in autophagosomal membrane formation by regulating phagophore expansion.61 For the first time, we demonstrate the role of RAB family proteins in the mitophagic process, representing a novel interaction among endosomes, autophagy and mitochondria in SKP/SKO-induced reprogramming. Further molecular mechanisms need to be elucidated.
Our parallel finding of mitochondrial clearance in SKP/SKO reprogramming and a recent report on SKPM/SKOM reprogramming are complementary: 62Neither study observed obvious mitochondrial clearance by canonical autophagy in SKPM/SKOM reprogramming. In SKPM/SKOM reprogramming, Ma et al. studied from the angle of the occurrence and role of noncanonical autophagy,62 but the mitochondrial receptor remains unknown. Considering Myc is not required for reprogramming, our work focused on SKP/SKO-induced reprogramming, and studied from the perspective of the role of mitochondria. Interestingly, ATG5-independent autophagy has been reported to mediate mitochondrial clearance in embryonic reticulocytes,63 wherein BNIP3L is well known to be required.17-19 Future studies will be required to identify the relationship between BNIP3L dependency and canonical and noncanonical autophagy in mitophagy in cell fate determination.
Materials and methods
Cell culture, generation of iPSCs and treatments
MEFs were derived from ICR mice and OG2 mice carrying the Pou5f1/Oct4-GFP transgenic allele, and cultured in Dulbecco's modified Eagle's medium (DMEM; Hyclone, SH30022.01) containing 10% fetal bovine serum (FBS; Industria Argentina, NTC-HK008), GlutMAX (Gibco, 35050–061) and NEAA (Gibco, 11140–050). Plat-E cells were cultured in DMEM medium containing 10% FBS for retrovirus packaging. Retrovirus packaging was performed according to standard protocols. These plasmids were transfected into Plat-E cells using polyethyleneimine-mediated transfection (Polysciences, 23966). The viral supernatants were then collected, and filtered 48 h later and we repeated this on the following day. Equal volumes of the supernatants were mixed and supplemented with polybrene (Sigma, H9268). MEFs were infected with retrovirus encoding SKP/SKO or SKPM/SKOM, with day defined as d 0. Medium was changed to iPSCs culture medium 24 h after the second infection. iPSCs culture medium was DMEM containing 15% FBS (Gibco, 10099–141), GlutMAX (Gibco, 35050–061) and NEAA (Gibco, 11140–050), sodium pyruvate (Gibco, 11360–070), mercaptoethanol (Invitrogen, 21985–023), penicillin/streptomycin (Hyclone, SV30010) and Lif (synthesized at GIBH). OG2 MEFs were derived from E13.5 embryos that carry the Rosa26-lacZ allele and a transgenic Pou5f1/Oct4 promoter driving GFP expression and used for reprogramming within 2 passages as described.64 Pluripotency is acquired for transcription factor-induced reprogramming only when the fused GFP appeared. All cells used in the experiments were cultured in water-jacked cell incubator (Thermo Scientific, 3111) containing 5% CO2 at 37°C. BAF (Gene Operation, C2501) was dissolved in DMSO (Sigma, D5879) at a concentration of 1 mM. MEFs undergoing reprogramming were treated with 100 nM BAF (diluted in growth media) or equivalent amounts DMSO for 2 to 4 h before sample. TTFs were cultured and reprogrammed generally as MEFs.
All mouse cell cultures (MEFs and TTFs) and generation of iPSCs were approved by the Ethics Committee of Guangzhou Institutes of Biomedicine and Health (Guangzhou, China).
Blastocyst injection
For generation of chimaeras, iPSCs were injected into ICR blastocysts using a Piezo Micromanipulator (PMM-MB-A, Japan). Injected blastocysts were transplanted into pseudopregnant ICR females. Germline transmission of resulted chimeric mice was determined by breeding F2 mouse with ICR mouse. iPSC colonies (GFP-positive colonies) were picked up and characterized as described.65
Plasmids
pMXs based vectors encoding mouse POU5F1/OCT4, SOX2, KLF4 and MYC was a gift from Shinya Yamanaka (Addgene, 13366;13367;13370;13375). The ER localization sequence (Calreticulin signal sequence at N-terminal and KDEL at C-terminal), Golgi marker protein B4GALT, lysosome marker protein LAMP1, and endosome marker proteins RAB5A, RAB7 and RAB11A, with mCherry fusions were cloned into pMXs-Flag plasmids. The insert mtDsRed was cut out from the original construct pDsRed2-Mito purchased from Clontech (Takara, 632421) and was cloned into a pMXs vector. ACTB-GFP was generated by fusion of human ACTB to GFP and was cloned into a pMXs vector. mCherry-Peroxisomes-2 was a gift from Michael Davidson (Addgene, 54520). mt-mKeima was cloned into a pMXs vector and pCHAC-mt-mKeima was a gift from Richard Youle (Addgene plasmid, 72342). shRNA for targeted genes was constructed into the pSUPER vector(oligoengine, VEC-PRT-0002). Target sequences for a variety of genes are shown in Table S1. Cells infected with pSUPER were selected with puromycin (Genomeditech, GM-040401–2; 2 µg/mL for 48 h) before sampling.
Quantification of mitochondrial mass, mitochondrial area and mtDNA copy number
Cells were washed with phosphate-buffered saline (PBS; Gibco, C14190500BT) twice and stained with 20 nM MitoTracker Green (Life Technology, M7514) for 30 min and subsequently washed once with PBS. Cells were detached with 500 µL 0.25% trypsin (Gibco, 25200–056) and diluted with 500 µL PBS. MitoTracker Green FI of cells was measured by flow cytometry (BD Biosciences), and FI value per cell was calculated to reflect mitochondrial mass per cell. First, MEFs were infected with retrovirus expressing ACTB-GFP and mtDsRed and split into appropriate confluence (15,000 for a 24-well plate). Flag, SKP/SKO, SKPM/SKOM or MYC were introduced into cells through a retrovirus. Then cells were fixed with 4% paraformaldehyde (Genesion, wj0012) and stained with DAPI(Sigma Aldrich, D9542). Images were acquired with a Zeiss 710 NLO laser-scanning confocal microscope system (Germany) and quantification of mitochondrial area was analyzed through ZEN 2010 software. For mtDNA copy number determination, total DNA was extracted by a TIANamp Genomic DNA Kit (Tiangen, DP304–03). The mtDNA copy number was detected by quantitative PCR (q-PCR) as described previously.66
Western blotting
Cells were lysed in radioimmunoprecipitation (Beyotime, P0013B) buffer, together with cocktail (Roche, 04693116001) and phenylmethanesulfonyl fluoride (Beyotime, ST506). Relative ratio of respective density of each proteins band was quantified using Image J software. The detailed information of primary antibodies used in this study is shown in Table 1. The secondary antibodies were goat anti-rabbit (Kangchen, KC-RB-035) and goat anti-mouse (Kangchen, KC-MM-035) with HRP. We used ECL (Merck Millipore, WBKLS0500) to detect the target proteins.
Table 1.
Primary antibodies used in this study.
| Antigen |
Host |
Company |
Catalog number |
Dilution |
| ACTB | Mouse | Sigma-Aldrich | A2228 | 1:5000 (WB) |
| ATG5 | Rabbit | Abcam | ab108327 | 1:1000 (WB) |
| ATG12 | Rabbit | Cell Signaling Technology | 4180 | 1:500 (WB) |
| BNIP3L | Rabbit | Cell Signaling Technology | 12396 | 1:1000 (WB); 1:200 (IF) |
| LC3B | Rabbit | Cell Signaling Technology | 2775 | 1:1000 (WB) |
| TOMM20 | Rabbit | Abcam | ab78547 | 1:1000 (WB) |
| TOMM20 | Mouse | Abcam | ab56783 | 1:500 (WB) |
| PPARGC1A/PGC1-α | Rabbit | Abcam | ab191838 | 1:1000 (WB) |
TEM
For electron microscopy, cells were washed with PBS twice and then fixed with 2.5% glutaraldehyde (G5882, Sigma Aldrich) at 4°C for more than 4 h and then washed 3 times with 2.5% glutaraldehyde in 0.1M phosphate buffer (pH 7.4). For detecting mitophagy, BAF and DMSO was added 4 h before fixation, respectively. The ultrastructure of mitochondria and autophagosomes was visualized by TEM (FEI Tecnai G2 Spirit, USA).
Reverse transcription-PCR (RT-PCR) and q-PCR
Cells were washed with PBS twice and were then lysed with Trizol reagent (Molecular Research Center, TR118). Total RNA was extracted following the manufacturer's protocol. The cDNA synthesis was performed with RT-PCR Kit (Takara, 639522). q-PCR was performed using a real time PCR-SYBR Green kit (Takara, RR430S) and reactions were performed in CFX Connect (Bio-Rad, USA), and mouse Actb was used as a control.
Fluorescence microscopy
MEFs were infected with virus expressing GFP-LC3B and different organelle-localized fluorescent proteins and split into appropriate confluence (15,000 per 24-well plate and 70,000 for 35-mm dish, respectively). Flag or SKP/SKO were introduced into cells through a retrovirus. Then, cells were fixed with 4% paraformaldehyde (Genesion, wj0012) and stained with DAPI. Images or movies were acquired with a Zeiss 710 NLO laser-scanning confocal microscope system. For TMRM (Invitrogen, T668) staining, cells were washed twice and treated with 25 nM TMRM for 30 min, and then with 5 nM TMRM for imaging. For photobleaching outside the ROI, we used the 405-nm and 488-nm laser to deplete all signal except that present on selected autophagic vesicles. For mt-mKeima, double dual-excitation (458/543) ratiometric imaging of mt-mKeima was used to monitor mitophagy as described previously.38 YFP-PARK2, was used together with mt-TFP and TMRM staining to monitor mitophagy as described previously.16
Statistical analyses
The significance of statistical differences observed for all experiments was evaluated using the Student t test as indicated in the legends of relevant figures.
Supplementary Material
Abbreviations
- BAF
bafilomycin A1
- BNIP3L
BCL2/adenovirus E1B interacting protein 3-like
- d
day
- DMEM
Dulbecco's modified Eagle's medium
- EE
early endosome
- ER
endoplasmic reticulum
- FI
fluorescence intensity
- iPSCs
induced pluripotent stem cells
- LAMP1
lysosomal-associated membrane protein 1
- LE
late endosome
- MAP1LC3/LC3
microtubule-associated protein 1 light chain 3
- MEFs
mouse embryonic fibroblasts
- mtDNA
mitochondrial DNA
- mtDsRed
mitochondrial targeted-DsRed
- OMM
mitochondrial outer membrane
- PBS
phosphate-buffered saline
- PINK1
PTEN induced putative kinase 1
- q-PCR
quantitative PCR
- RE
recycling endosome
- ROI
region of interest
- SKP/SKO, Sox2, Klf4
Pou5f1/Oct4
- SKPM/SKOM, Sox2, Klf4
Pou5f1/Oct4 and Myc/c-Myc
- TEM
transmission electron microscopy
- TMRM
tetramethylrhodamine methyl ester
- TOMM20
translocase of outer mitochondrial membrane 20 homolog (yeast)
- TTFs
tail tip fibroblasts
- ΔΨm
mitochondrial membrane potential
Disclosure of potential conflicts of interest
No potential conflicts of interest were disclosed.
Acknowledgments
We thank all the members in Prof. Xingguo Liu's lab.
Funding
This work was financially supported by The National Key Research and Development Program of China under Grant 2017YFA0102900, 2013CB967403, 2017YFC1001602, 2017YFA0106300, 2016YFA0100300; the National Natural Science Foundation projects of China under Grant U1601227, 31622037, 31631163001, 81570520, 31601176, 31601088; the Key Research Program of Frontier Sciences, CAS under Grant QYZDB-SSW-SMC001; Guangzhou Health Care and Cooperative Innovation Major Project under Grant 201704020218, 201604020009; Guangdong Province Science and Technology Program under Grant 2015TX01R047, 2014TQ01R559, 2015A020212031, 2017A020215056; the PhD Start-up Fund of Natural Science Foundation of Guangdong Province under Grant 2014A030310071; Guangzhou Science and Technology Program under Grant 201707020043, 201707010178; Yangtse River Scholar Bonus Schemes to X. L.; CAS Youth Innovation Promotion Association to K. C.
References
- [1].Takahashi K, Yamanaka S. Induction of pluripotent stem cells from mouse embryonic and adult fibroblast cultures by defined factors. Cell 2006; 126:663-76; PMID:16904174; https://doi.org/ 10.1016/j.cell.2006.07.024 [DOI] [PubMed] [Google Scholar]
- [2].Liang G, Zhang Y. Embryonic stem cell and induced pluripotent stem cell: an epigenetic perspective. Cell Res 2013; 23:49-69; PMID:23247625; https://doi.org/ 10.1038/cr.2012.175 [DOI] [PMC free article] [PubMed] [Google Scholar]
- [3].Faradonbeh MZ, Gharechahi J, Mollamohammadi S, Pakzad M, Taei A, Rassouli H, Baharvand H, Salekdeh GH. An orthogonal comparison of the proteome of human embryonic stem cells with that of human induced pluripotent stem cells of different genetic background. Mol Biosyst 2012; 8:1833-40; PMID:22543856; https://doi.org/ 10.1039/c2mb25018g [DOI] [PubMed] [Google Scholar]
- [4].Apostolou E, Hochedlinger K. Chromatin dynamics during cellular reprogramming. Nature 2013; 502:462-71; PMID:24153299; https://doi.org/ 10.1038/nature12749 [DOI] [PMC free article] [PubMed] [Google Scholar]
- [5].Han C, Gu H, Wang J, Lu W, Mei Y, Wu M. Regulation of L-threonine dehydrogenase in somatic cell reprogramming. Stem Cells 2013; 31:953-65; PMID:23355387; https://doi.org/ 10.1002/stem.1335 [DOI] [PubMed] [Google Scholar]
- [6].Folmes CD, Nelson TJ, Martinez-Fernandez A, Arrell DK, Lindor JZ, Dzeja PP, Ikeda Y, Perez-Terzic C, Terzic A. Somatic oxidative bioenergetics transitions into pluripotency-dependent glycolysis to facilitate nuclear reprogramming. Cell Metab 2011; 14:264-71; PMID:21803296; https://doi.org/ 10.1016/j.cmet.2011.06.011 [DOI] [PMC free article] [PubMed] [Google Scholar]
- [7].Panopoulos AD, Yanes O, Ruiz S, Kida YS, Diep D, Tautenhahn R, Herrerias A, Batchelder EM, Plongthongkum N, Lutz M, et al.. The metabolome of induced pluripotent stem cells reveals metabolic changes occurring in somatic cell reprogramming. Cell Res 2012; 22:168-77; PMID:22064701; https://doi.org/ 10.1038/cr.2011.177 [DOI] [PMC free article] [PubMed] [Google Scholar]
- [8].Prigione A, Fauler B, Lurz R, Lehrach H, Adjaye J. The senescence-related mitochondrial/oxidative stress pathway is repressed in human induced pluripotent stem cells. Stem Cells 2010; 28:721-33; PMID:20201066; https://doi.org/ 10.1002/stem.404 [DOI] [PubMed] [Google Scholar]
- [9].Zhou W, Choi M, Margineantu D, Margaretha L, Hesson J, Cavanaugh C, Blau CA, Horwitz MS, Hockenbery D, Ware C, et al.. HIF1alpha induced switch from bivalent to exclusively glycolytic metabolism during ESC-to-EpiSC/hESC transition. EMBO J 2012; 31:2103-16; PMID:22446391; https://doi.org/ 10.1038/emboj.2012.71 [DOI] [PMC free article] [PubMed] [Google Scholar]
- [10].Liu W, Long Q, Chen K, Li S, Xiang G, Chen S, Liu X, Li Y, Yang L, Dong D, et al.. Mitochondrial metabolism transition cooperates with nuclear reprogramming during induced pluripotent stem cell generation. Biochem Biophys Res Commun 2013; 431:767-71; PMID:23333381; https://doi.org/ 10.1016/j.bbrc.2012.12.148 [DOI] [PubMed] [Google Scholar]
- [11].Lemasters JJ. Selective mitochondrial autophagy, or mitophagy, as a targeted defense against oxidative stress, mitochondrial dysfunction, and aging. Rejuvenation Res 2005; 8:3-5; PMID:15798367; https://doi.org/ 10.1089/rej.2005.8.3 [DOI] [PubMed] [Google Scholar]
- [12].Mizushima N, Komatsu M. Autophagy: renovation of cells and tissues. Cell 2011; 147:728-41; PMID:22078875; https://doi.org/ 10.1016/j.cell.2011.10.026 [DOI] [PubMed] [Google Scholar]
- [13].Wang S, Xia P, Ye B, Huang G, Liu J, Fan Z. Transient activation of autophagy via Sox2-mediated suppression of mTOR is an important early step in reprogramming to pluripotency. Cell Stem Cell 2013; 13:617-25; PMID:24209762; https://doi.org/ 10.1016/j.stem.2013.10.005 [DOI] [PubMed] [Google Scholar]
- [14].Wu Y, Li Y, Zhang H, Huang Y, Zhao P, Tang Y, Qiu X, Ying Y, Li W, Ni S, et al.. Autophagy and mTORC1 regulate the stochastic phase of somatic cell reprogramming. Nat Cell Biol 2015; 17:715-25; PMID:25985393; https://doi.org/ 10.1038/ncb3172 [DOI] [PubMed] [Google Scholar]
- [15].Liu K, Zhao Q, Liu P, Cao J, Gong J, Wang C, Wang W, Li X, Sun H, Zhang C, et al.. ATG3-dependent autophagy mediates mitochondrial homeostasis in pluripotency acquirement and maintenance. Autophagy 2016; 12:2000-8; PMID:27575019; https://doi.org/ 10.1080/15548627.2016.1212786 [DOI] [PMC free article] [PubMed] [Google Scholar]
- [16].Narendra D, Tanaka A, Suen DF, Youle RJ. Parkin is recruited selectively to impaired mitochondria and promotes their autophagy. J Cell Biol 2008; 183:795-803; PMID:19029340; https://doi.org/ 10.1083/jcb.200809125 [DOI] [PMC free article] [PubMed] [Google Scholar]
- [17].Schweers RL, Zhang J, Randall MS, Loyd MR, Li W, Dorsey FC, Kundu M, Opferman JT, Cleveland JL, Miller JL, et al.. NIX is required for programmed mitochondrial clearance during reticulocyte maturation. Proc Natl Acad Sci U S A 2007; 104:19500-5; PMID:18048346; https://doi.org/ 10.1073/pnas.0708818104 [DOI] [PMC free article] [PubMed] [Google Scholar]
- [18].Sandoval H, Thiagarajan P, Dasgupta SK, Schumacher A, Prchal JT, Chen M, Wang J. Essential role for Nix in autophagic maturation of erythroid cells. Nature 2008; 454:232-5; PMID:18454133; https://doi.org/ 10.1038/nature07006 [DOI] [PMC free article] [PubMed] [Google Scholar]
- [19].Novak I, Kirkin V, McEwan DG, Zhang J, Wild P, Rozenknop A, Rogov V, Lohr F, Popovic D, Occhipinti A, et al.. Nix is a selective autophagy receptor for mitochondrial clearance. EMBO Rep 2010; 11:45-51; PMID:20010802; https://doi.org/ 10.1038/embor.2009.256 [DOI] [PMC free article] [PubMed] [Google Scholar]
- [20].Zhu Y, Massen S, Terenzio M, Lang V, Chen-Lindner S, Eils R, Novak I, Dikic I, Hamacher-Brady A, Brady NR. Modulation of serines 17 and 24 in the LC3-interacting region of Bnip3 determines pro-survival mitophagy versus apoptosis. J Biol Chem 2013; 288:1099-113; PMID:23209295; https://doi.org/ 10.1074/jbc.M112.399345 [DOI] [PMC free article] [PubMed] [Google Scholar]
- [21].Hanna RA, Quinsay MN, Orogo AM, Giang K, Rikka S, Gustafsson AB. Microtubule-associated protein 1 light chain 3 (LC3) interacts with Bnip3 protein to selectively remove endoplasmic reticulum and mitochondria via autophagy. J Biol Chem 2012; 287:19094-104; PMID:22505714; https://doi.org/ 10.1074/jbc.M111.322933 [DOI] [PMC free article] [PubMed] [Google Scholar]
- [22].Liu L, Feng D, Chen G, Chen M, Zheng Q, Song P, Ma Q, Zhu C, Wang R, Qi W, et al.. Mitochondrial outer-membrane protein FUNDC1 mediates hypoxia-induced mitophagy in mammalian cells. Nat Cell Biol 2012; 14:177-85; PMID:22267086; https://doi.org/ 10.1038/ncb2422 [DOI] [PubMed] [Google Scholar]
- [23].Murakawa T, Yamaguchi O, Hashimoto A, Hikoso S, Takeda T, Oka T, Yasui H, Ueda H, Akazawa Y, Nakayama H, et al.. Bcl-2-like protein 13 is a mammalian Atg32 homologue that mediates mitophagy and mitochondrial fragmentation. Nat Commun 2015; 6:7527; PMID:26146385; https://doi.org/ 10.1038/ncomms8527 [DOI] [PMC free article] [PubMed] [Google Scholar]
- [24].Mammucari C, Milan G, Romanello V, Masiero E, Rudolf R, Del Piccolo P, Burden SJ, Di Lisi R, Sandri C, Zhao J, et al.. FoxO3 controls autophagy in skeletal muscle in vivo. Cell Metab 2007; 6:458-71; PMID:18054315; https://doi.org/ 10.1016/j.cmet.2007.11.001 [DOI] [PubMed] [Google Scholar]
- [25].Galvez AS, Brunskill EW, Marreez Y, Benner BJ, Regula KM, Kirschenbaum LA, Dorn GW 2nd. Distinct pathways regulate proapoptotic Nix and BNip3 in cardiac stress. J Biol Chem 2006; 281:1442-8; PMID:16291751; https://doi.org/ 10.1074/jbc.M509056200 [DOI] [PubMed] [Google Scholar]
- [26].Glick D, Zhang W, Beaton M, Marsboom G, Gruber M, Simon MC, Hart J, Dorn GW 2nd, Brady MJ, Macleod KF. BNip3 regulates mitochondrial function and lipid metabolism in the liver. Mol Cell Biol 2012; 32:2570-84; PMID:22547685; https://doi.org/ 10.1128/MCB.00167-12 [DOI] [PMC free article] [PubMed] [Google Scholar]
- [27].Melser S, Chatelain EH, Lavie J, Mahfouf W, Jose C, Obre E, Goorden S, Priault M, Elgersma Y, Rezvani HR, et al.. Rheb regulates mitophagy induced by mitochondrial energetic status. Cell Metab 2013; 17:719-30; PMID:23602449; https://doi.org/ 10.1016/j.cmet.2013.03.014 [DOI] [PubMed] [Google Scholar]
- [28].Ding WX, Ni HM, Li M, Liao Y, Chen X, Stolz DB, Dorn GW 2nd, Yin XM. Nix is critical to two distinct phases of mitophagy, reactive oxygen species-mediated autophagy induction and Parkin-ubiquitin-p62-mediated mitochondrial priming. J Biol Chem 2010; 285:27879-90; PMID:20573959; https://doi.org/ 10.1074/jbc.M110.119537 [DOI] [PMC free article] [PubMed] [Google Scholar]
- [29].Okamoto K, Kondo-Okamoto N, Ohsumi Y. A landmark protein essential for mitophagy: Atg32 recruits the autophagic machinery to mitochondria. Autophagy 2009; 5:1203-5; PMID:19770589; https://doi.org/ 10.4161/auto.5.8.9830 [DOI] [PubMed] [Google Scholar]
- [30].Adhikary S, Eilers M. Transcriptional regulation and transformation by Myc proteins. Nat Rev Mol Cell Biol 2005; 6:635-45; PMID:16064138; https://doi.org/ 10.1038/nrm1703 [DOI] [PubMed] [Google Scholar]
- [31].Seoane J, Le HV, Massague J. Myc suppression of the p21(Cip1) Cdk inhibitor influences the outcome of the p53 response to DNA damage. Nature 2002; 419:729-34; PMID:12384701; https://doi.org/ 10.1038/nature01119 [DOI] [PubMed] [Google Scholar]
- [32].Liu L, Sakakibara K, Chen Q, Okamoto K. Receptor-mediated mitophagy in yeast and mammalian systems. Cell Res 2014; 24:787-95; PMID:24903109; https://doi.org/ 10.1038/cr.2014.75 [DOI] [PMC free article] [PubMed] [Google Scholar]
- [33].Kabeya Y, Mizushima N, Ueno T, Yamamoto A, Kirisako T, Noda T, Kominami E, Ohsumi Y, Yoshimori T. LC3, a mammalian homologue of yeast Apg8p, is localized in autophagosome membranes after processing. EMBO J 2000; 19:5720-8; PMID:11060023; https://doi.org/ 10.1093/emboj/19.21.5720 [DOI] [PMC free article] [PubMed] [Google Scholar]
- [34].Klionsky DJ, Cuervo AM, Seglen PO. Methods for monitoring autophagy from yeast to human. Autophagy 2007; 3:181-206; PMID:17224625; https://doi.org/ 10.4161/auto.3678 [DOI] [PubMed] [Google Scholar]
- [35].Klionsky DJ, Abdelmohsen K, Abe A, Abedin MJ, Abeliovich H, Acevedo Arozena A, Adachi H, Adams CM, Adams PD, Adeli K, et al.. Guidelines for the use and interpretation of assays for monitoring autophagy (3rd edition). Autophagy 2016; 12:1-222; PMID:26799652; https://doi.org/ 10.1080/15548627.2015.1100356 [DOI] [PMC free article] [PubMed] [Google Scholar]
- [36].Klionsky DJ, Abdalla FC, Abeliovich H, Abraham RT, Acevedo-Arozena A, Adeli K, Agholme L, Agnello M, Agostinis P, Aguirre-Ghiso JA, et al.. Guidelines for the use and interpretation of assays for monitoring autophagy. Autophagy 2012; 8:445-544; PMID:22966490; https://doi.org/ 10.4161/auto.19496 [DOI] [PMC free article] [PubMed] [Google Scholar]
- [37].Deter RL, Baudhuin P, De Duve C. Participation of lysosomes in cellular autophagy induced in rat liver by glucagon. J Cell Biol 1967; 35:C11-6; PMID:6055998; https://doi.org/ 10.1083/jcb.35.2.C11 [DOI] [PMC free article] [PubMed] [Google Scholar]
- [38].Katayama H, Kogure T, Mizushima N, Yoshimori T, Miyawaki A. A sensitive and quantitative technique for detecting autophagic events based on lysosomal delivery. Chem Biol 2011; 18:1042-52; PMID:21867919; https://doi.org/ 10.1016/j.chembiol.2011.05.013 [DOI] [PubMed] [Google Scholar]
- [39].Lazarou M, Sliter DA, Kane LA, Sarraf SA, Wang C, Burman JL, Sideris DP, Fogel AI, Youle RJ. The ubiquitin kinase PINK1 recruits autophagy receptors to induce mitophagy. Nature 2015; 524:309-14; PMID:26266977; https://doi.org/ 10.1038/nature14893 [DOI] [PMC free article] [PubMed] [Google Scholar]
- [40].Mizushima N, Noda T, Yoshimori T, Tanaka Y, Ishii T, George MD, Klionsky DJ, Ohsumi M, Ohsumi Y. A protein conjugation system essential for autophagy. Nature 1998; 395:395-8; PMID:9759731; https://doi.org/ 10.1038/26506 [DOI] [PubMed] [Google Scholar]
- [41].Axe EL, Walker SA, Manifava M, Chandra P, Roderick HL, Habermann A, Griffiths G, Ktistakis NT. Autophagosome formation from membrane compartments enriched in phosphatidylinositol 3-phosphate and dynamically connected to the endoplasmic reticulum. J Cell Biol 2008; 182:685-701; PMID:18725538; https://doi.org/ 10.1083/jcb.200803137 [DOI] [PMC free article] [PubMed] [Google Scholar]
- [42].van der Vaart A, Reggiori F. The Golgi complex as a source for yeast autophagosomal membranes. Autophagy 2010; 6:800-1; PMID:20714226; https://doi.org/ 10.4161/auto.6.6.12575 [DOI] [PubMed] [Google Scholar]
- [43].Puri C, Renna M, Bento CF, Moreau K, Rubinsztein DC. Diverse autophagosome membrane sources coalesce in recycling endosomes. Cell 2013; 154:1285-99; PMID:24034251; https://doi.org/ 10.1016/j.cell.2013.08.044 [DOI] [PMC free article] [PubMed] [Google Scholar]
- [44].Longatti A, Tooze SA. Recycling endosomes contribute to autophagosome formation. Autophagy 2012; 8:1682-3; PMID:22874560; https://doi.org/ 10.4161/auto.21486 [DOI] [PMC free article] [PubMed] [Google Scholar]
- [45].Bucci C, Parton RG, Mather IH, Stunnenberg H, Simons K, Hoflack B, Zerial M. The small GTPase rab5 functions as a regulatory factor in the early endocytic pathway. Cell 1992; 70:715-28; PMID:1516130; https://doi.org/ 10.1016/0092-8674(92)90306-W [DOI] [PubMed] [Google Scholar]
- [46].Russell MR, Nickerson DP, Odorizzi G. Molecular mechanisms of late endosome morphology, identity and sorting. Curr Opin Cell Biol 2006; 18:422-8; PMID:16781134; https://doi.org/ 10.1016/j.ceb.2006.06.002 [DOI] [PubMed] [Google Scholar]
- [47].Ullrich O, Reinsch S, Urbe S, Zerial M, Parton RG. Rab11 regulates recycling through the pericentriolar recycling endosome. J Cell Biol 1996; 135:913-24; PMID:8922376; https://doi.org/ 10.1083/jcb.135.4.913 [DOI] [PMC free article] [PubMed] [Google Scholar]
- [48].Hailey DW, Rambold AS, Satpute-Krishnan P, Mitra K, Sougrat R, Kim PK, Lippincott-Schwartz J. Mitochondria supply membranes for autophagosome biogenesis during starvation. Cell 2010; 141:656-67; PMID:20478256; https://doi.org/ 10.1016/j.cell.2010.04.009 [DOI] [PMC free article] [PubMed] [Google Scholar]
- [49].Shimizu S, Honda S, Arakawa S, Yamaguchi H. Alternative macroautophagy and mitophagy. Int J Biochem Cell Biol 2014; 50:64-6; PMID:24569119; https://doi.org/ 10.1016/j.biocel.2014.02.016 [DOI] [PubMed] [Google Scholar]
- [50].Pua HH, Guo J, Komatsu M, He YW. Autophagy is essential for mitochondrial clearance in mature T lymphocytes. J Immunol 2009; 182:4046-55; PMID:19299702; https://doi.org/ 10.4049/jimmunol.0801143 [DOI] [PubMed] [Google Scholar]
- [51].Armelin HA, Armelin MC, Kelly K, Stewart T, Leder P, Cochran BH, Stiles CD. Functional role for c-myc in mitogenic response to platelet-derived growth factor. Nature 1984; 310:655-60; PMID:6088986; https://doi.org/ 10.1038/310655a0 [DOI] [PubMed] [Google Scholar]
- [52].Armstrong L, Tilgner K, Saretzki G, Atkinson SP, Stojkovic M, Moreno R, Przyborski S, Lako M. Human induced pluripotent stem cell lines show stress defense mechanisms and mitochondrial regulation similar to those of human embryonic stem cells. Stem Cells 2010; 28:661-73; PMID:20073085; https://doi.org/ 10.1002/stem.307 [DOI] [PubMed] [Google Scholar]
- [53].Nakagawa M, Koyanagi M, Tanabe K, Takahashi K, Ichisaka T, Aoi T, Okita K, Mochiduki Y, Takizawa N, Yamanaka S. Generation of induced pluripotent stem cells without Myc from mouse and human fibroblasts. Nat Biotechnol 2008; 26:101-6; PMID:18059259; https://doi.org/ 10.1038/nbt1374 [DOI] [PubMed] [Google Scholar]
- [54].Wernig M, Meissner A, Cassady JP, Jaenisch R. c-Myc is dispensable for direct reprogramming of mouse fibroblasts. Cell Stem Cell 2008; 2:10-2; PMID:18371415; https://doi.org/ 10.1016/j.stem.2007.12.001 [DOI] [PubMed] [Google Scholar]
- [55].Twig G, Elorza A, Molina AJ, Mohamed H, Wikstrom JD, Walzer G, Stiles L, Haigh SE, Katz S, Las G, et al.. Fission and selective fusion govern mitochondrial segregation and elimination by autophagy. EMBO J 2008; 27:433-46; PMID:18200046; https://doi.org/ 10.1038/sj.emboj.7601963 [DOI] [PMC free article] [PubMed] [Google Scholar]
- [56].Ravikumar B, Imarisio S, Sarkar S, O'Kane CJ, Rubinsztein DC. Rab5 modulates aggregation and toxicity of mutant huntingtin through macroautophagy in cell and fly models of Huntington disease. J Cell Sci 2008; 121:1649-60; PMID:18430781; https://doi.org/ 10.1242/jcs.025726 [DOI] [PMC free article] [PubMed] [Google Scholar]
- [57].Su WC, Chao TC, Huang YL, Weng SC, Jeng KS, Lai MM. Rab5 and class III phosphoinositide 3-kinase Vps34 are involved in hepatitis C virus NS4B-induced autophagy. J Virol 2011; 85:10561-71; PMID:21835792; https://doi.org/ 10.1128/JVI.00173-11 [DOI] [PMC free article] [PubMed] [Google Scholar]
- [58].Dou Z, Chattopadhyay M, Pan JA, Guerriero JL, Jiang YP, Ballou LM, Yue Z, Lin RZ, Zong WX. The class IA phosphatidylinositol 3-kinase p110-beta subunit is a positive regulator of autophagy. J Cell Biol 2010; 191:827-43; PMID:21059846; https://doi.org/ 10.1083/jcb.201006056 [DOI] [PMC free article] [PubMed] [Google Scholar]
- [59].Dou Z, Pan JA, Dbouk HA, Ballou LM, DeLeon JL, Fan Y, Chen JS, Liang Z, Li G, Backer JM, et al.. Class IA PI3K p110beta subunit promotes autophagy through Rab5 small GTPase in response to growth factor limitation. Mol Cell 2013; 50:29-42; PMID:23434372; https://doi.org/ 10.1016/j.molcel.2013.01.022 [DOI] [PMC free article] [PubMed] [Google Scholar]
- [60].Knaevelsrud H, Soreng K, Raiborg C, Haberg K, Rasmuson F, Brech A, Liestol K, Rusten TE, Stenmark H, Neufeld TP, et al.. Membrane remodeling by the PX-BAR protein SNX18 promotes autophagosome formation. J Cell Biol 2013; 202:331-49; PMID:23878278; https://doi.org/ 10.1083/jcb.201205129 [DOI] [PMC free article] [PubMed] [Google Scholar]
- [61].Yamano K, Fogel AI, Wang C, van der Bliek AM, Youle RJ. Mitochondrial Rab GAPs govern autophagosome biogenesis during mitophagy. Elife 2014; 3:e01612; PMID:24569479; https://doi.org/ 10.7554/eLife.01612 [DOI] [PMC free article] [PubMed] [Google Scholar]
- [62].Ma T, Li J, Xu Y, Yu C, Xu T, Wang H, Liu K, Cao N, Nie BM, Zhu SY, et al.. Atg5-independent autophagy regulates mitochondrial clearance and is essential for iPSC reprogramming. Nat Cell Biol 2015; 17:1379-87; PMID:26502054; https://doi.org/ 10.1038/ncb3256 [DOI] [PubMed] [Google Scholar]
- [63].Honda S, Arakawa S, Nishida Y, Yamaguchi H, Ishii E, Shimizu S. Ulk1-mediated Atg5-independent macroautophagy mediates elimination of mitochondria from embryonic reticulocytes. Nat Commun 2014; 5:4004; PMID:24895007; https://doi.org/ 10.1038/ncomms5004 [DOI] [PubMed] [Google Scholar]
- [64].Esteban MA, Wang T, Qin B, Yang J, Qin D, Cai J, Li W, Weng Z, Chen J, Ni S, et al.. Vitamin C enhances the generation of mouse and human induced pluripotent stem cells. Cell Stem Cell 2010; 6:71-9; PMID:20036631; https://doi.org/ 10.1016/j.stem.2009.12.001 [DOI] [PubMed] [Google Scholar]
- [65].Chen J, Liu J, Chen Y, Yang J, Chen J, Liu H, Zhao X, Mo K, Song H, Guo L, et al.. Rational optimization of reprogramming culture conditions for the generation of induced pluripotent stem cells with ultra-high efficiency and fast kinetics. Cell Res 2011; 21:884-94; PMID:21445094; https://doi.org/ 10.1038/cr.2011.51 [DOI] [PMC free article] [PubMed] [Google Scholar]
- [66].Yang L, Long Q, Liu J, Tang H, Li Y, Bao F, Qin D, Pei D, Liu X. Mitochondrial fusion provides an ‘initial metabolic complementation’ controlled by mtDNA. Cell Mol Life Sci 2015; 72:2585-98; PMID:25708700; https://doi.org/ 10.1007/s00018-015-1863-9 [DOI] [PMC free article] [PubMed] [Google Scholar]
Associated Data
This section collects any data citations, data availability statements, or supplementary materials included in this article.