

Abstract
To identify common alleles associated with different histotypes of epithelial ovarian cancer (EOC), we pooled data from multiple genome-wide genotyping projects totaling 25,509 EOC cases and 40,941 controls. We identified nine new susceptibility loci for different EOC histotypes: six for serous EOC histotypes (3q28, 4q32.3, 8q21.11, 10q24.33, 18q11.2 and 22q12.1), two for mucinous EOC (3q22.3, 9q31.1) and one for endometrioid EOC (5q12.3). We then meta-analysed the results for high-grade serous ovarian cancer with the results from analysis of 31,448 BRCA1 and BRCA2 mutation carriers, including 3,887 mutation carriers with EOC. This identified an additional three loci at 2q13, 8q24.1 and 12q24.31. Integrated analyses of genes and regulatory biofeatures at each locus predicted candidate susceptibility genes, including OBFC1, a novel susceptibility gene for low grade/borderline serous EOC.
Epithelial ovarian cancer (EOC) is a heterogeneous disease commonly classified into five major histotypes of invasive disease 1- (high grade serous (HGSOC), low grade serous (LGSOC), mucinous (MOC), endometrioid (ENOC) and clear cell carcinoma (CCOC)) - and two histotypes of borderline disease – serous and mucinous. The histotypes have differences in lifestyle and genetic risk factors, precursor lesions, patterns of spread, molecular events during oncogenesis, response to chemotherapy, and prognosis. HGSOC are thought to be derived from fallopian tube secretory epithelial cells through foci of endosalpingiosis existing as inclusion cysts lined with tubal epithelium at the ovarian and peritoneal surface2. In contrast, CCOC, ENOC, and sero-endometrioid carcinomas appear to develop from endometriosis 3,4. MOC resembles adenocarcinoma of the gastric pylorus, intestine, or endocervix and the majority of these tumors show gastrointestinal differentiation 5.
Approximately 20% of the familial component of EOC risk is attributable to high-to-intermediate risk genes 6. An unknown fraction is due to more common, lower risk genetic variation 7. In European populations, genome-wide association studies (GWAS) have identified 23 EOC susceptibility alleles including 18 common variants associated with all histologies and/or serous EOC 8-15, one with borderline serous tumors 13, three with MOC 16 and one with CCOC 12. The majority of these loci also showed associations (p<0.05) with EOC risk for BRCA1 or BRCA2 mutation carriers 15. Five additional loci associated with EOC and breast and/or prostate cancer have been identified17; three of these were associated with susceptibility to EOC, breast and prostate cancers, and two were associated only with breast and EOC risk. However, the common genetic variants explain only 3.9% of the inherited component of EOC risk 15 and additional susceptibility loci are likely to exist, particularly for the less common, non-serous histotypes.
We designed a custom Illumina array named the ‘OncoArray’, in order to identify new cancer susceptibility loci18. The OncoArray includes ~533,000 variants (of which 260,660 formed a GWAS backbone) and has been used to genotype over 500,000 samples, including EOC case-control studies of the Ovarian Cancer Association Consortium (OCAC) and BRCA1 and BRCA2 mutation carriers of the Consortium of Investigators of Modifiers of BRCA1/2 (CIMBA). These data were combined with genotype data from the Collaborative Oncological Gene-environment Study (COGS) project 14,19 and three EOC GWAS 8,9. We present the results of these association analyses together with functional annotation of the new genome-wide significant EOC susceptibility loci.
Results
Association analyses
Genetic association analyses were performed using genotype data from 25,509 population-based EOC cases and 40,941 controls from OCAC and meta-analysis of these data with 19,036 BRCA1 and 12,412 BRCA2 mutation carriers from CIMBA, of whom 2,933 and 954, respectively, were affected with EOC. The numbers of participants by study for OCAC and CIMBA are shown in Supplementary table 1 and Supplementary table 2, respectively.
We used data from the 1000 Genomes Project 20 reference panel to impute genotypes for 11,403,952 common variants (MAF>1%) and evaluated the associations of these SNPs with EOC risk. In OCAC alone, nine histotypes were investigated (all invasive, serous invasive, HGSOC, LGSOC, serous borderline, LGSOC and serous borderline combined, ENOC, CCOC and MOC). Association analyses revealed six novel loci associated with serous EOC histotypes at genome-wide significance (p<5×10⁻⁸): rs9870207 at 3q28, rs13113999 at 4q32.3, rs150293538 at 8q21.11, rs7902587 at 10q24.33, rs8098244 at 18q11.2 and rs6005807 at 22q12.1. Five of these loci were associated with borderline serous EOC (3q28, 4q32.3, 8q21.11, 10q24.33 and 18q11.2) and four with LGSOC tumors (3q28, 8q21.11, 10q24.33 and 18q11.2) (Table 1). We also identified two loci associated with MOC (rs112071820 at 3q22.3 and rs320203 at 9q31.1) and one locus associated with ENOC (rs555025179 at 5q12.3). The meta-analysis of OCAC and CIMBA revealed three additional serous EOC loci (rs2165109 at 2q13; rs9886651 at 8q24.21; rs7953249 at 12q24.31). The 8q24.21 SNP rs9886651 is close to two SNPs previously associated with serous EOC 9 (and Gjyshi A, Mendoza-Fandino G, Tyrer J, Woods NT, Lawrenson K et al., personal communication). Multi-variable analysis of OCAC data showed that this is a third independent-associated variant in this region (unadjusted OR = 1.07, OR adjusted for rs1400482 and rs13255292 =1.07). Variant rs6005807 at 22q12.1 was previously reported to be associated with serous EOC at sub-genome-wide significance 21.
Table 1.
New genome-wide significant epithelial ovarian cancer susceptibility loci
| SNP | Histotype | Chr | Position | Risk Allele | RAF | r2a | OR | LCL | UCL | P-valueb | P-hetc | BFRP |
|---|---|---|---|---|---|---|---|---|---|---|---|---|
| OCAC analyses | ||||||||||||
| rs112071820 | Mucinous: invasive + borderline | 3q22.3 | 138,849,110 | G:GCCAG | 0.33 | 0.86 | 1.29 | 1.20 | 1.37 | 1.5 × 10⁻¹³ | 0.88 | <1% |
| rs9870207 | Serous: LG + borderline | 3q28 | 190,525,516 | G:A | 0.73 | 0.97 | 1.19 | 1.12 | 1.27 | 4.5 × 10⁻⁸ | 0.61 | 6% |
| rs13113999 | Serous: borderline | 4q32.3 | 167,187,046 | G:T | 0.56 | 0.86 | 1.23 | 1.14 | 1.32 | 4.7 × 10⁻⁸ | 0.52 | 7% |
| rs555025179 | Endometrioid | 5q12.3 | 66,121,089 | GTGACAC | 0.56 | 0.86 | 1.18 | 1.11 | 1.26 | 4.5 × 10⁻⁸ | 0.79 | 5% |
| rs150293538 | Serous: LG + borderline | 8q21.11 | 77,320,354 | C:T | 0.99 | 0.77 | 2.19 | 1.65 | 2.90 | 2.0 × 10⁻⁹ | 0.38 | 3% |
| rs320203 | Mucinous: invasive + borderline | 9q31.1 | 104,943,226 | C:A | 0.88 | 0.98 | 1.29 | 1.18 | 1.41 | 1.7 × 10⁻⁸ | 0.56 | 11% |
| rs7902587 | Serous: LG + borderline | 10q24.33 | 105,694,301 | C:T | 0.12 | 0.94 | 1.29 | 1.18 | 1.41 | 4.0 × 10⁻⁸ | 0.99 | 7% |
| rs8098244 | Serous: LG + borderline | 18q11.2 | 21,405,553 | G:A | 0.31 | 0.98 | 1.19 | 1.12 | 1.27 | 3.9 × 10⁻⁸ | 0.087 | 3% |
| rs6005807 | Serous: invasive | 22q12.1 | 28,934,313 | T:C | 0.91 | 0.99 | 1.17 | 1.11 | 1.23 | 4.5 × 10⁻⁹ | 0.15 | <1% |
| OCAC and CIMBA meta-analysis | ||||||||||||
| rs2165109 | Serous HG + BRCA1/2 | 2q13 | 111,818,658 | A:C | 0.25 | 1.00 | 1.09 | 1.05 | 1.12 | 4.2 × 10⁻⁸ | 0.66 | 2% |
| rs9886651 | Serous HG + BRCA1/2 | 8q24.21 | 128,817,883 | A:G | 0.46 | 0.99 | 1.08 | 1.05 | 1.11 | 3.5 × 10⁻⁹ | 0.26 | <1% |
| rs7953249 | Serous HG + BRCA1/2 | 12q24.31 | 121,403,724 | A:G | 0.42 | 1.00 | 1.08 | 1.06 | 1.06 | 1.1 × 10⁻⁹ | 0.67 | <1% |
average imputation r2 across the six data sets;
From analysis of imputed genotyped derived from one-step imputation (see methods);
test for heterogeneity of effect between study strata in OCAC; RAF, risk allele frequency; LCL, lower 95% confidence limit; UCL, upper 95% confidence limit; LG, low grade; HG, high grade; position is genome build 37; BFRP Bayes false positive reporting probability assuming prior of 1:10,000
The association of the top SNP in each region with the nine EOC histotypes studied with EOC risk in BRCA1 and BRCA2 carriers is shown in Figure 1. Four SNPs, rs8098244 (18q11.2), rs2165109 (2q13), rs9886651 (8q24.21), rs7953249 (12q24.31) showed associations with EOC risk for BRCA1 mutation carriers and one SNP, rs9886651 (8q24.21) showed an association with risk for BRCA2 carriers (P<0.05)
Figure 1. Histotype specific associations (odds ratios) of top SNP in 12 novel EOC susceptibility regions.
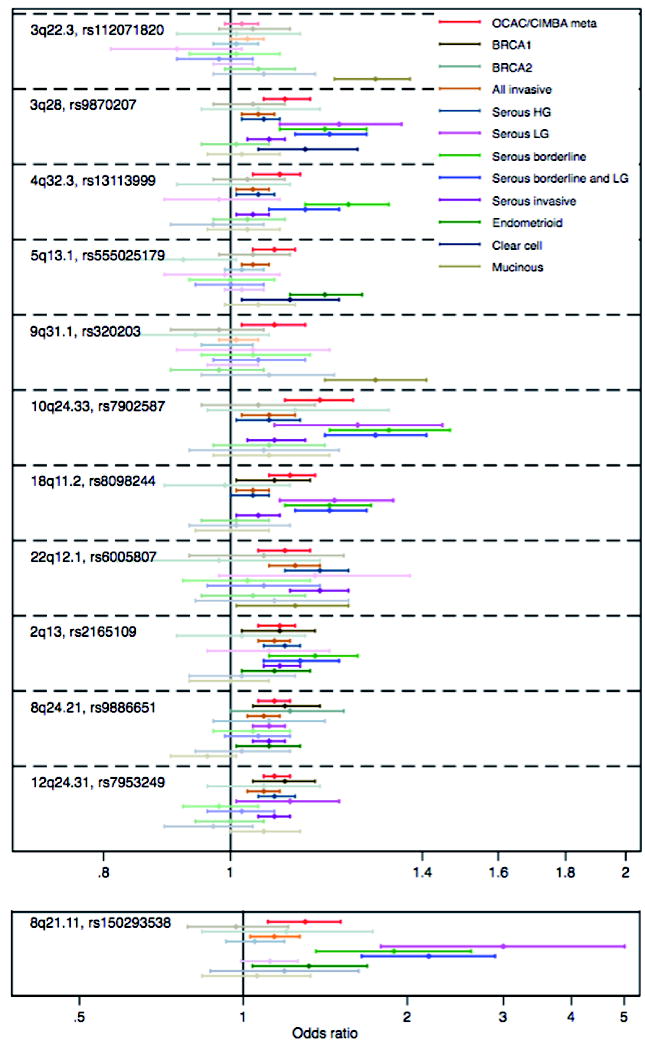
The forest plot shows the point estimates of odds ratios with 95% confidence intervals around each estimate. Odds ratios and confidence intervals in bold are histotypes significant at nominal P<0.05.
Eighteen of the 23 previously published loci were associated with the same histotype at genome-wide significance (excluding the 5 pleitropic loci published by Kar et al, Supplementary table 3). Of these, 11 showed an association with EOC risk for BRCA1 mutation carriers and eight showed an association with risk for BRCA2 carriers (P<0.05). There was significant heterogeneity of risk between the five main, non-overlapping histotypes (high grade serous, low grade/borderline serous, endometrioid, clear cell and invasive/borderline mucinous) for 28 of the 40 new and previously published loci (Supplementary table 3).
We carried out a competing-risks association analysis in BRCA1 and BRCA2 mutation carriers in order to investigate whether the observed associations with ovarian cancer in mutation carriers are influenced by associations with breast cancer risk. For this we used the most significantly associated genotyped SNPs for this 22. The EOC HR estimates were consistent with the estimates from the main analysis for all SNPs (results not shown). Some evidence suggested that rs7953249 at 12q24.31 was associated with reduced breast cancer risk in BRCA1 mutation carriers (HR=0.95, 95%CI 0.91-0.99, p=0.034) and that SNP rs2165109 at 2q13 was associated with increased breast cancer risk in BRCA2 mutation carriers (HR=1.08, 95%CI 1.01-1.14, p=0.02). When these associations were analyzed by tumor estrogen-receptor status, the associations for the two SNPs were restricted to ER-negative breast for BRCA1 (p=0.026 for rs7953249) and BRCA2 (p=0.02 for rs2165109) mutation carriers.
Association analyses adjusted for the most significant SNP in each region (including 3 independent SNPs at 8q24.21) did not reveal any additional independent association signals in these regions. At the 12 new EOC risk regions, 571 SNPs were deemed potentially causal (Supplementary table 4) and carried forward for functional annotation, eQTL and mQTL analyses.
Functional and molecular analyses
Of the 571 candidate causal variants in the 12 novel loci, 562 variants are located in non-coding DNA sequences and may influence the expression of nearby target genes 23. We used a variety of in silico approaches to identify putative, tissue-specific, regulatory biofeatures and candidate susceptibility genes associated with risk SNPs at each locus. For the few risk-associated, non-synonymous variants in protein coding genes, we also evaluated predicted effects on protein function.
Functional annotation of candidate causal alleles
We mapped the set of 562 non-protein coding candidate causal SNPs at the 12 susceptibility loci to regulatory biofeatures, using a variety of epigenomic marks profiled in normal and cancer tissues relevant to the cellular origins of different ovarian cancer histotypes (Supplementary table 5). The cell types interrogated included: (1) fallopian tube (FT33; FT246) and ovarian surface epithelial cell lines (IOSE4; IOSE11) for serous precursor tissues; (2) serous-related cancer cell lines including HGSOC cell lines (UWB1.289; CaOV3) and a LGSOC cell line (OAW42); (3) endometriosis epithelial cells (EEC16), as a likely precursor of ENOC; (4) cell types relevant to MOC, including MOC cell lines (GTFR230; MCAS) and both colonic normal (colon crypt) and cancer tissues (HCT116; HeLa-S3). The epigenomic marks annotated were open chromatin, identified using formaldehyde assisted isolation of regulatory element sequencing (FAIRE-seq) and DNase I hypersensitivity sequencing (DNase-seq) and chromatin immunoprecipitation sequencing (ChIP-seq) of histone modifications, specifically histone H3 lysine 27 acetylation (H3K27ac, which denotes active chromatin) and histone H3 lysine 4 monomethylation (H3K4me1, which marks active and poised enhancers). SNPs were also intersected with ENCODE transcription factor ChIPseq data. All tissue types were evaluated for all risk loci. The SNP-biofeature intersections by tissue type are illustrated in Figure 2 and Supplementary table 6.
Figure 2. Number of overlaps between causal SNPs and H3K27ac in relevant tissues and cell lines.
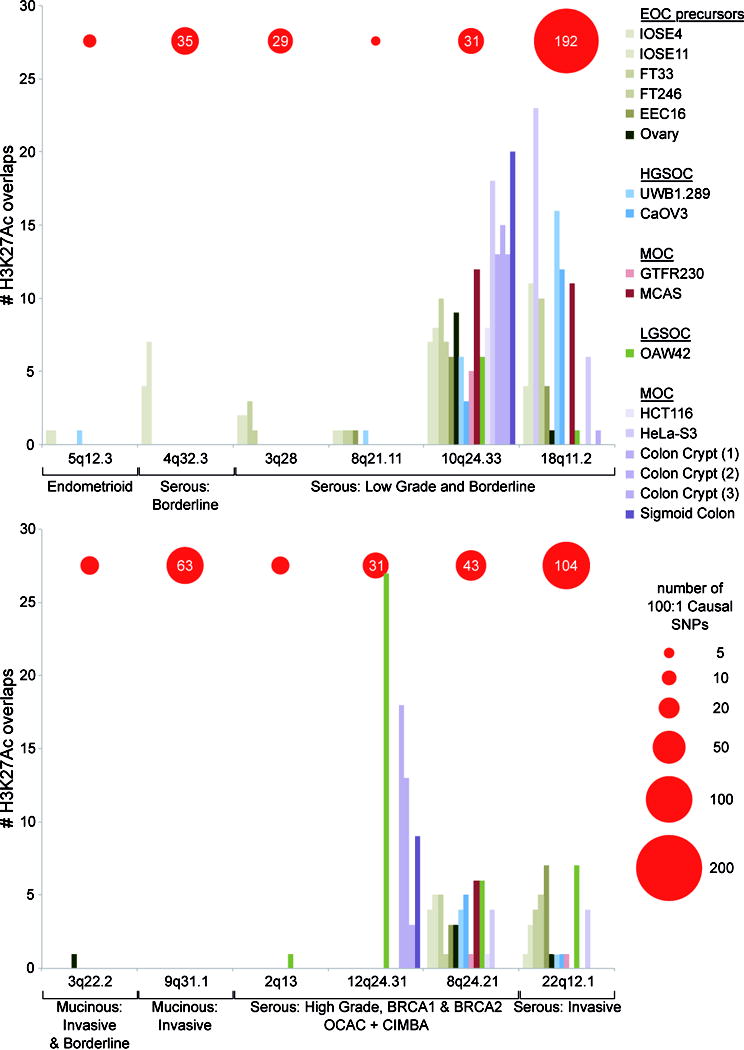
Height of each bar in the histogram represents the number of candidate causal SNPs at each locus overlapping H3K27ac marks in a particular cell line. Loci are grouped according to their association with different histotypes of ovarian cancer. The number of causal SNPs at 100:1 odds relative to the top regional SNP is indicated by the red circles (scale below, right). In the key cell lines are grouped according to their likely relevance to the different histotypes. Abbreviations: mucinous ovarian cancer (MOC), low grade serous ovarian cancer (LGSOC), high grade serous ovarian cancer (HGSOC), and epithelial ovarian cancer (EOC) precursors.
Nine (1.6%) of the 571 candidate causal SNPs lie in protein coding sequences. Five of these are synonymous and four are non-synonymous but predicted to be benign by Polyphen-2 (Supplementary table 6). Four SNPs lie within untranslated regions of protein-coding genes and so could affect mRNA stability: rs1051149 and rs1051150 in the 3’ UTR of LAMA3 and rs12327412 in the 5’ UTR of TTC39C, all at the 18q11.2 locus; and rs1018128 in the 3’ UTR of GMNC at 3q28. The majority of biofeature-SNP intersections (n=166, 29% of all candidate causal SNPs and 97% of candidate causal SNPs overlapping a biofeature) were for SNPs lying within active chromatin, and/or open chromatin. Eleven SNPs lie in the promoters of four genes (PVT1, HNF1A, TTC39C and TTC28) (Supplementary Table 6).
At six serous risk loci (4q32.3; 3q28; 8q21; 18q11; 8q24; 22q12) we observed extensive SNP-biofeature overlaps, particularly in serous-related tissue types. In contrast, the two MOC susceptibility loci (3q22.3, 9q31.1) were biofeature-poor regions and showed little or no SNP-biofeature intersections in any of the tissue types under investigation, including MOC and ENCODE cell lines. At the endometrioid EOC risk locus (5q12.3) we observed enhancers in endometriosis, ovarian, fallopian and EOC cell types flanking the small number risk associated SNPs (n=8), none of which coincided with regulatory elements.
Several studies have shown that common variant susceptibility alleles are significantly enriched for regulatory elements detected in disease-relevant tissue types. Therefore we tested for enrichment of SNP-H3K27ac intersections at each locus because H3K27ac was the most comprehensively profiled regulatory feature across different tissue types (Supplementary table 7). At the 12q24.31 locus a large region of active chromatin spanning the HNF1A promoter drove a strong enrichment for risk SNP-H3K27ac intersects in the OAW42 LGSOC cell line (P=4.45×10⁻²²). At 10q24.33 (which is associated with LGSOC and borderline SOC) we identified a significant enrichment of acetylated H3K27 in normal fallopian cells (FT33 P=1.09×10⁻⁴, FT246 P=4.29×10⁻³), HGSOC ovarian cancer cells (UWB1.289 P=6.23×10⁻³), MOC cells (GTFR230 P=5.16×10⁻³) as well as, somewhat surprisingly, colorectal cancer cells (HCT116 P=2.64×10⁻⁴) and cervical cancer cells (HeLa-S3 P=9.60×10⁻¹²). This locus contains several clusters of H3K27ac activity and TF binding in ovarian and ENCODE datasets, and these highly active regions showed extensive overlap with candidate causal alleles (Figure 3).
Figure 3. Functional analysis of the chr10q24.33 locus.
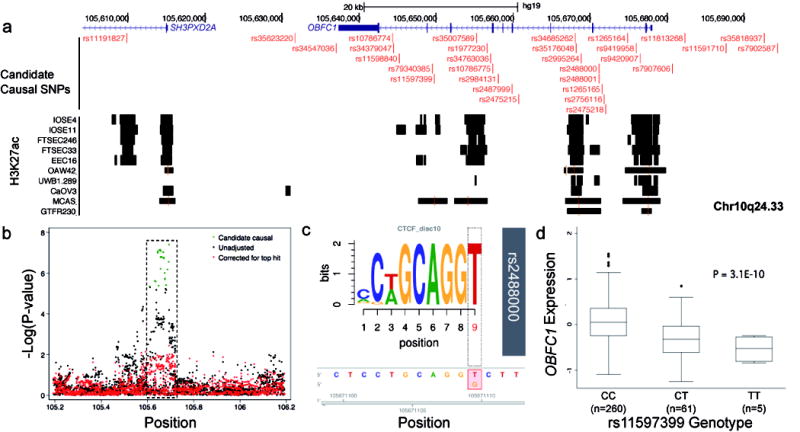
(a) Active chromatin, denoted by H3K27ac signaling, in EOC-relevant cell types. (b) Regional association plot for genotyped and imputed SNPs. The dashed box highlights the region shown in panel (a) (c) MotifbreakR analysis, a non-canonical CTCF motif is significantly altered by SNP rs2488000. (d) EQTL analysis, OBFC1 expression is associated with rs11597399 genotype in HGSOCs from TCGA. Box and whisker plot showing median (horizontal line within box), interquartile range (IQR; length of box) and 1.5 times the IQR (whiskers) of OBFC1 expression for each genotype.
Identifying candidate susceptibility gene targets at risk loci
We used several approaches to identify candidate target genes at the 12 risk loci. First, we hypothesized that target genes underlying disease susceptibility are more likely to display prevalent copy number alterations in ovarian tumor tissues. Amplifications were the most frequent alteration at 6 of the 12 susceptibility loci (Supplementary figure 1). Contiguous genes were commonly amplified in the same sample indicating segmental amplifications (data not shown). HNF1A, ORAI1, CHEK2, XPB1, BUB1, and FOXL2 are found inside the same topologically associating domain (TAD) as candidate causal SNPs and have been previously implicated in ovarian cancer development (Supplementary figure 2). Notably, HNF1A, ORAI1, and FOXL2 are amplified in >5% of EOC samples. No TAD was identified for 8q24.21; but MYC and PVT1 appear to be the targets for multiple enhancer elements containing independent EOC risk associations for HGSOC at this locus (Gjyshi et al., personal communication).
We also performed expression and methylation quantitative trait locus (eQTL and mQTL) analyses in several data sets comprising methylation/expression profiling and germline genotyping in relevant tumor tissues (see Methods). For eQTL analyses, we evaluated associations between the candidate causal SNPs and all genes profiled within 1 Mb of the index risk SNP at each locus, since this window will contain most cis-eQTL associations 23. Results of the eQTL analyses in each data set were adjusted for tumor copy number and methylation status 24 and a meta-analysis of the two HGSOC data sets from TCGA and the Mayo Clinic are shown in Supplementary table 8-11. The most significant eQTL associations in both HGSOC data sets were identified between the candidate causal risk SNPs at the 10q24.33 risk locus and OBFC1 expression (TCGA-rs11597399 - P = 3.1 × 10⁻¹⁰; Mayo-rs7902587- P = 4.0 × 10⁻⁴; meta-analysis-rs34379047- P = 2.1 × 10⁻¹¹). The risk (T) allele was associated with reduced OBFC1 expression in both data sets (Figure 3d). We then evaluated all SNPs at this locus (not just the candidate causal SNPs) for eQTL associations; the SNPs with the most significant eQTL associations for OBFC1 were also candidate causal SNPs for the risk association, reinforcing OBFC1 as the target gene. No expression associations were identified at P < 10-4 for the candidate causal risk SNPs at any other locus in the eQTL meta-analysis. Thirty-two ENOC samples were used to conduct an eQTL analysis focused on the 5q13.1 ENOC risk locus but this did not reveal any associations at P < 0.05 (Supplementary table 10).
Methylation QTL analyses were restricted to the set of 67 CpGs with the most significant association with decreased expression of the 74 genes of interest (within a 1Mb region of the index SNP) in the 12 regions. Results are presented for the most significant mQTL associations for each SNP based on the reduced set of CpGs (Supplementary table 12). We identified two regions with mQTL associations at P<0.005. At 2q13, the risk allele [G] of rs56226558 was associated with reduced methylation of the CpG cg21469370 (p=1.4 × 10⁻³), with methylation being associated with reduced expression of BCL211 (p=1.1×10⁻⁶) even though cg21469370 lies in the gene body of ACOXL. At 3q22.3, the risk allele [C] of rs68088905 was associated with reduced methylation of the CpG cg06726820 in the promoter of RBP1 (mQTL p = 4.9 × 10⁻³). Methylation was strongly associated with reduced RBP1 expression (p=1.7×10-36). We found no highly significant mQTL associations for genes at any other locus, and the eQTL SNP at 10q24.33 was not association with DNA methylation.
SNPs in the 10q24.33 locus revealed the most significant eQTL with expression of the OBFC1 gene. The most significant eQTL SNPs also showed the most epigenetic marks, including rs35007589 (eQTL p-value 2.3×10⁻¹¹), rs35176048 (eQTL p-value 2.6 ×10⁻¹¹) and rs34685262 (eQTL p-value 3.8 ×10⁻¹¹). These SNPs intersect regions of open chromatin, H3K27ac and H3K4me1 signal in normal ovarian and fallopian tube epithelial cells and, for rs35176048 and rs34685262, in HGSOC cell lines. These enhancers are not specific to ovarian cell types. At this locus, 11 candidate causal SNPs are predicted by motifbreakR 25 to alter transcription factor binding sites, of which 8 are predicted to have a strong effect on TF binding (Supplementary table 13). Of particular interest, rs2488000 (eQTL p-value = 1.4 × 10⁻¹⁰) is predicted in silico to strongly impact the binding of CTCF, a ubiquitously expressed transcriptional regulator that plays a key role in insulator function and chromatin structure (Figure 3c). Furthermore in ENCODE there is evidence from ChIPseq experiments that CTCF does bind at this location in monocytes. Other SNPs predicted to have a strong effect on the binding of other cancer-relevant TFs are rs11813268 (ETS1), rs7907606 (FOXP1) and rs2995264 (IRF8) (Supplementary table 13).
At 8q24.21, the candidate causal variants span a region of ~20kb that includes the promoter and first exon of PVT1, an oncogenic long non-coding RNA (lncRNA) with known roles in breast and ovarian cancer 26. The 8q24 region is also a hotspot for association with other cancers 27 with PVT1, CMYC and novel lncRNAs identified as candidate target genes. Five SNPs (rs10956390, rs10098831, rs6470578, rs6990534 and rs4410871) coincide with 11 or more biofeatures in normal ovarian and fallopian epithelial cells, and ovarian cancer cells.
Discussion
We have identified 12 novel loci associated with different histotypes of EOC at genome-wide significance. Despite the use of a stringent significance threshold it is possible that some of these represent false positive associations. Wakefield has suggested the use of an approximate Bayes factor to calculate the Bayes false discovery probability (BFDP) 28. We have estimated the BFDP based on a plausible odds ratio of 1.2 and a prior probability of association of 0.0001. The BFDP was less than 10% for 11 of the 12 associations. We also calculated the BFDP for the 22 previously reported loci, of which 17 were <1%, 1 was >1% but less than 10% and 4 were greater than 10%. We did not calculate the BFDP for the 5 pleiotropic loci reported by Kar et al, 2016 17. These five loci together with the 29 loci with BFDP<10% bring the total number of susceptibility loci for different histotypes of EOC to 34 for women of European ancestry, of which 27 are associated with risk of invasive EOC at P<0.01. Assuming a polygenic variance of 1.45 29 the 27 loci account for approximately 6.4% of the polygenic risk in the population. Incorporating common EOC susceptibility variants into risk assessment tools will improve risk prediction and may be particularly useful for refining risk estimates in BRCA1 and BRCA2 mutation carriers.
Some strata in the OCAC analyses pooled data from several studies from the same country. This might increase the potential for bias because of population stratification, but we expect any inflation due to population stratification to be effectively removed by adjusting for the principal components. In order to evaluate the possible magnitude of such a bias we compared the inflation of the median test statistic for the analysis of the OncoArray data stratified by study with an analysis in which all the cases and controls were combined into a single stratum. There was little difference (λ=1.054 v λ=1.078). As these inflation factors are not adjusted for sample size, some of the difference is due to the increase in effective sample size of the non-stratified analysis, suggesting that any bias do to pooling data from multiple studies will be minimal.
Consistent with previous studies in EOC and other cancer types, the vast majority of the risk-associated variants were located in non-protein coding regions of the genome 30 suggesting these variants impact target gene expression by altering the activity of functional element(s) that regulate the expression of one or more susceptibility genes. Since non-coding biofeatures, such as enhancers, show a high degree of tissue specificity, we intersected EOC risk SNPs with regions of active chromatin catalogued in cell lines representing the different EOC histotypes (HGSOC, ENOC, LGSOC and MOC) and in EOC precursor cells (OSEC/FTSEC for LGSOC/HGSOC, EEC for ENOC and colonic crypt for MOC). Enrichment analyses test for over-representation of cell-type specific biofeatures intersecting risk variants at confirmed risk loci, compared to a lack of enrichment in non-disease associated tissues. A major strength of our approach was the ability to interrogate histotype-specific epigenomic profiles and so in addition to identifying the putative functional targets of risk SNPs, these analyses can also indicate whether some cell types are more likely to be relevant to disease pathogenesis compared to other cell types. For example we detected a significant enrichment of active chromatin marks coinciding with SNPs in fallopian tube epithelial cells at the 10q24.33 LGSOC/borderline serous locus, which could reflect recent pathological evidence that some of these tumors arise in the distal fallopian tube 31, as well as HGSOC 2. At the same locus, we also identified an enrichment for biofeatures in a primary MOC cell line, a cancer histotype that is often associated with deregulation of the MAPK pathway; which is also perturbed in LGSOC 32. Given the growing evidence that regulatory mechanisms are highly tissue specific, it is perhaps to be expected that we find such enrichments in cell types associated with EOC development. However, the lack of enrichment at MOC and ENOC risk loci may indicate that alternative precursor cell types give rise to these histotypes rather than the cell types evaluated in the current study.
Expression QTL analysis identified associations between the most statistically significant risk-associated SNPs at 10q24.33 and OBFC1, many of which also coincide with epigenetic biofeatures. OBFC1 is a subunit of an alpha accessory factor that stimulates the activity of DNA polymerase-alpha-primase, the enzyme that initiates DNA replication. OBFC1 also appears to function in a telomere-associated complex that binds telomeric single-stranded DNA in vitro and localizes at telomeres in vivo 33. Four SNPs in this region (rs2487999, rs4387287, rs9420907 and rs9419958) have previously been reported to be associated with telomere length (NHGRI-EBI GWAS catalog 27, Supplementary table 14). The r2 between these and rs7902587 are between 0.52 and 0.93 (1000 Genomes European populations). However, the associations of all four with LGSOC and borderline serous EOC are attenuated when adjusted for rs7902587 suggesting a single association peak. The alleles associated with a decrease in leukocyte telomere length being associated with an increased risk of LGSOC and borderline serous EOC. These findings are consistent with the association between borderline EOC and rs7705526 at 5p15 (adjacent to the telomerase reverse transcriptase gene)13. Furthermore, the histotype specificity is consistent with the suggestion that telomere length differs between the different histotypes of EOC 34.
Candidate causal variants at three of the 12 novel loci are associated with multiple traits in the NHGRI-EBI GWAS catalog (P<5×10⁻⁸). These traits converge on pathways involved in inflammation and immunity, including monocyte count, C-reactive protein (CRP) levels, gamma-glutamyl transpeptidase levels, N-glycan levels, allergen sensitization, and multiple sclerosis (Supplementary table 14). For example, at the 12q24.31 HGSOC risk locus, the risk allele of four candidate causal SNPs (rs7979473, rs1183910, rs2393791, rs7310409) have previously been associated with raised CRP levels in blood plasma, a marker of inflammation. This is consistent with the established link between chronic inflammation and increased cancer risk. In addition SNPs within 500kb of the top SNP at 2q13, 8q24.21, 10q24.33 and22q12.1 are associated with several different cancers although only one of these is a candidate causal EOC variant (rs2995264 at 10q24.33 associated with cutaneous malignant melanoma).
This study demonstrates the strength of large-scale collaborations in identifying common variant risk associations for complex traits such as EOC which is rare, has a high mortality rate, and exhibits heterogeneity by histotype. As the largest study to date with over 90,000 EOC cases and controls including an additional ~25,000 previously unstudied participants, we identify several novel risk loci specific to the rarer EOC histotypes: ENOC, MOC, LGSOC and borderline EOC. The histotype-specific nature of these associations adds to the somatic, epidemiological and clinical data indicating that EOC histotypes can be thought of as distinct diseases. The lack of heterogeneity between studies of varying designs, carried out in different populations, and the high levels of statistical significance, with confirmation of known EOC susceptibility loci, provide evidence that these are robust associations. Molecular analyses of genes and the tissue specific regulatory architecture at these loci, which combined publicly available datasets with systematic, large-scale genome wide profiling experiments, point to a small number of non-coding biofeatures and target genes that may play a histotype-specific role in EOC initiation and development. Detailed functional studies will be required to define the underlying biology of SNP-regulatory interactions to identify the causal SNP(s) at each locus, and to confirm which candidate susceptibility genes represent the targets of these risk SNPs. Evolving technologies, in particular CRISPR-Cas9 genome editing, now enable precision modification of risk SNPs to create isogenic models of different alleles 35, enabling the effects of each allele on disease pathogenesis to be studied, for example at 19p13 36, 8q24 14, 17q12 12 and 5p15 13. Finally, given that several previously identified EOC susceptibility alleles are associated with risk of other cancers 17, and that there are similarities in molecular phenotype and/or shared tissue of origin between endometrial cancer, endometriosis and ENOC and CCOC 37 as well as basal-like breast cancer 38, we anticipate that the loci reported here may be also associated with risk of other cancer-related traits.
METHODS
Study samples
Genotype data from six OCAC and two CIMBA genotyping projects were used for these analyses (Supplementary table 1). All participating studies were approved by the relevant research ethics committee and all participants provided written, informed consent.
OCAC
The OCAC OncoArray data comprised 63 genotyping project/case-controls sets (Supplementary table 1). Some studies (e.g. SEARCH) contributed samples to more than one genotyping project and some case-control sets are a combination of multiple individual studies. The following numbers are for the subjects of European ancestry that passed QC. The analyses included 66,450 samples from seven genotyping projects: 40,941 controls, 22,406 invasive cases and 3,103 borderline cases. The number of cases by histotype were serous borderline (1,954), mucinous borderline (1,149), LGSOC (1,012), HGSOC (13,037), ENOC (2,810), CCOC (1,366) and other EOC (2,764).
CIMBA
Eligibility in CIMBA is restricted to females aged 18 years or older with pathogenic variants in BRCA1 or BRCA2. The majority of the participants were sampled through cancer genetics clinics, including some related participants. Sixty-three studies contributed OncoArray and iCOGS genotype data on 31,448 mutation carriers. For the samples genotyped on OncoArray, after quality control (see below), data were available on 15,694 BRCA1 mutation-carriers and 10,988 BRCA2 mutation carriers, of whom 2,372 and 849, respectively, were affected with EOC (Supplementary table 2). We also obtained genotype data on 3,342 (561 affected) BRCA1 and 1,424 (105 affected) BRCA2 non-overlapping samples genotyped using the iCOGS array 1,2.
Genotype data and Quality Control (QC)
Data from all the genotyping projects apart from the OCAC and CIMBA OncoArray projects have been published previously 1,3-6. Genotypes for OCAC samples were preferentially selected from the different projects in the following order: OncoArray, Mayo GWAS, COGS, and other GWAS.
Genotyping was performed at five centers: University of Cambridge, Center for Inherited Disease Research (CIDR), National Cancer Institute (NCI), Genome Quebec and Mayo Clinic. OncoArray sample QC was similar to that carried out for the other projects (as described 5). We excluded samples if they had a genotyping call rate < 95%, excessively low or high heterozygosity, if they were not female, or were duplicates (cryptic or intended). Duplicates and close relatives were identified using in-house software that calculates a concordance matrix for all individuals. Samples with concordance>0.86 were flagged as duplicates and samples with concordance between 0.74 and 0.86 were flagged as relatives. The comparison was performed among all the OncoArray samples, and all the previously genotyped samples. The concordance statistics were used to identify cryptic duplicates and expected duplicates whose genotypes did not match. We attempted to resolve these with the study investigators. If the discrepancy could not be resolved both samples were excluded. In OCAC, for confirmed cryptic duplicates and relatives, we retained one sample in the analysis. For case-control pairs we excluded the control, while for case-case and control-control pairs we excluded the sample with the lower call rate. In CIMBA, relatives were included in the analysis and the association tests were adjusted accordingly. For confirmed duplicates, the sample with the higher call rate was retained.
SNP QC was carried out according to the OncoArray QC Guidelines. 7 Only those SNPs that passed QC for all consortia were used for imputation. We excluded SNPs with a call rate <95%, SNPs deviating from Hardy-Weinberg equilibrium (P<10-7 in controls or unrelated samples in CIMBA and P <10-12 in cases) and SNPs with concordance<98% among 5,280 duplicate pairs. For the imputation, we additionally excluded SNPs with a MAF<1% and a call rate <98% and SNPs that could not be linked to the 1000 genomes reference or differed significantly in frequency from the 1000 genomes (European frequency) and a further 1,128 SNPs where the cluster plot was judged to be inadequate. Of the 533,631 SNPs which were manufactured on the array, 494,813 SNPs passed the initial QC and 470,825 SNPs were used for imputation. Samples with overall heterozygosity <5% or > 40% were excluded.
Ancestry analysis
Intercontinental ancestry was calculated for the OCAC samples using the software package FastPop (http://sourceforge.net/projects/fastpop/) 8 developed specifically for the OncoArray. Only the samples with >80% European ancestry were used for these analyses. For the CIMBA samples 33,661 weakly correlated autosomal SNPs (pair-wise r2 less than 0.1) were used to compute the genomic kinship between all pairs of individuals, along with 267 HapMap samples (CHB, JPT, YRI and CEU). These were converted to distances and subjected to multidimensional scaling. Using the first two components, we calculated the proportion of European ancestry for each individual and excluded samples with >27% non-European ancestry to ensure that samples of Ashkenazi Jewish ancestry were included in the final sample. Analysis using FastPop provided virtually identical results.
Principal components analysis
Principal component analysis for the OncoArray data was carried out using data from 33,661 uncorrelated SNPs (pair-wise r2 less than 0.1) with minor allele frequency greater than 0.05 using an in house program (available at http://ccge.medschl.cam.ac.uk/software/pccalc/). Principal components analysis for the other genotype data sets was carried out as previously described. 1,5
Imputation
We performed imputation separately for each genotyping project data set. We imputed genotypes into the reference panel from the 1000 Genomes Project (v3 October 2014). 9 We initially used an effcient two-step procedure, which involved pre-phasing using SHAPEIT 10 followed by imputation of the phased data using IMPUTE2 11. We then performed more accurate imputation for any region with a SNP with P<10 6 in the OCAC analyses or the OCAC/CIMBA meta-analysis. The boundaries were set +/−500kb from the most significant SNP in each region. The single-step imputation used IMPUTE2 without pre-phasing with some of the default parameters modified. These included an increase of the MCMC iterations to 90 (out of which the first 15 were used as burn-in), an increase of the buffer region to 500kb and increasing to 100 the number of haplotypes used as templates when phasing observed genotypes.
After imputation, 85 per cent of common variants including both single nucleotide variants and small indels (MAF>0.05) have an imputation r2 imputation accuracy > 0.9 with 97 percent having imputation r2 > 0.7. Of the rare variants (0.001 < MAF < 0.05), 28 per cent have an imputation r2> 0.9 and 58 per cent have an imputation r2> 0.7.
Association analyses in the unselected ovarian cancer cases and controls from OCAC and CIMBA
We excluded SNPs from the association analysis if their imputation accuracy was r2<0.3 or their minor allele frequency (MAF) was <0.01. In total, genotypes for 11,595,112 million variants were available for analysis.
Association analyses OCAC
We evaluated the association between genotype and disease using the imputed genotype dosage in a logistic regression model. We carried out initial, genome-wide analyses separately for OncoArray, COGS and the five GWAS datasets and pooled the results using a fixed effects meta-analysis. The analyses were adjusted for study and for population substructure by including the eigenvectors of project-specific principal components as covariates in the model (nine for OncoArray, five for COGS, two for UK GWAS, and two for the US, BWH and POL GWAS, and a single PC for the MAY GWAS). The number of eigenvectors chosen was based on the inflection point of a scree plot. After one-step imputation of the genotypes in the regions of interest we used genotype dosages in a single logistic regression model with adjustment for each genotyping project/study combination and nineteen principal components. Principal components were set to zero for samples not included in a given project. We used custom written software for the analysis.
EOC is a heterogeneous phenotype with five major histotypes for invasive disease – HGSOC, LGSOC, MOC, ENOC and CCOC – and two histotypes of borderline disease – serous and mucinous. The pattern of association across the different histotypes varies for the known EOC risk loci. We therefore carried out the association analysis on the following nine histotypes: all invasive disease; HGSOC; LGSOC; all invasive serous; serous borderline; LGSOC and borderline serous combined; ENOC; CCOC; and mucinous invasive/mucinous borderline combined.
Association analyses CIMBA
We carried out the ovarian cancer association analyses separately for BRCA1 and BRCA2 carriers and for OncoArray and COGS samples. The results were pooled using fixed effects meta-analysis. The primary analysis was carried out within a survival analysis framework with time to ovarian cancer diagnosis as the endpoint. Mutation carriers were followed until the age of ovarian cancer diagnosis, or risk-reducing salpingo-oophorectomy (RRSO) or age at study recruitment.
Breast cancer diagnosis was not considered as a censoring event. In order to account for the non-random sampling of BRCA1 and BRCA2 carriers with respect to disease status we conducted the analyses by modelling the retrospective likelihood of the observed genotypes conditional on the disease phenotype. We assessed the associations between genotype and risk of ovarian cancer using a score test statistic based on the retrospective likelihood. 12 To account for the non-independence among related individuals in the sample, we used an adjusted version of the score test statistic, which uses a kinship-adjusted variance of the score. 13 We evaluated associations between imputed genotypes and ovarian cancer risk using a version of the score test as described above but with the posterior genotype probabilities replacing the genotypes. All analyses were stratified by the country of origin of the samples and for Ashkenazi Jewish origin.
We carried out the analyses using custom written functions in Fortran and Python. The score test statistic was implemented in R version 3.0.1.
OCAC/CIMBA meta-analysis
We conducted a meta-analysis of the EOC associations in BRCA1, BRCA2 carriers and OCAC samples using an inverse variance approach assuming fixed effects. We combined the logarithm of the per-allele hazard ratio estimate for the association with EOC risk in BRCA1 and BRCA2 mutation carriers and the logarithm of the per-allele odds ratio estimate for the association with EOC (any-subtype) and serous EOC in OCAC. The number of BRCA1 and BRCA2 samples with tumor histology information was too small to allow for subgroup analyses. However, previous studies have demonstrated that the vast majority of EOCs in BRCA1 and BRCA2 mutation carriers are HGSOC. Meta-analyses were carried out using the software “metal”, 2011-03-25 release 14.
We evaluated whether there is evidence for multiple independent association signals in the region around each newly identified locus by evaluating the associations of genetic variants in the region while adjusting for the SNP with the smallest meta-analysis p-value in the respective region. This was done separately for BRCA1 carriers, BRCA2 carriers and OCAC.
Candidate causal SNPs in each susceptibility region
In order to identify a set of variants most likely to mediate the observed association – the credible causal variants - we excluded SNPs with causality odds of less than 1:100 by comparing the likelihood of each SNP from the association analysis with the likelihood of the most strongly associated SNP.
Functional annotation of risk associated variants
Expression and methylation quantitative trait loci analyses
A TCGA data set15 was available for 326 HGSOC tumors in women of European ancestry. Ancestry was estimated using the Local Ancestry in adMixed Populations (LAMP, 16) software package and individuals with > 95% European descent were retained for further analyses. Matched gene expression (measured on the Agilent 1M microarray), CpG methylation (measured on the Illumina Infinium HumanMethylation27 BeadChip), copy number alteration (called using the Affymetrix SNP 6.0), and germline genotype (called using the Affymetrix SNP 6.0) were also available. A Mayo Clinic data set was available for 209 serous EOC tumors and 32 ENOC tumors in women of European ancestry. Matched gene expression (measured on the Agilent whole human genome 4x44K expression microarray), CpG methylation (measured on the Illumina Infinium HumanMethylation450), copy number alteration (called using the OncoArray), and germline genotype (called using the OncoArray) were available for all of these samples. Genotypes were imputed into the 1000 Genomes October 2014 (Phase 3, version 5) 9 European reference panel for both data sets. Expression QTL analyses were performed using linear regression as implemented in the R package Matrix eQTL 17. Only variants with imputation accuracy R2 > 0.3 were analyzed. Prior to eQTL analyses the effects of tumor copy number and methylation on gene expression were regressed out as previously described18. For the Mayo data set, we performed separate analyses on the HGSOC and ENOC samples. Results for the two HGSOC data sets were combined in a random effects meta-analysis. We focused on local or cis-acting eQTLs between SNPs in the 1:100 list of potentially causal variants and all genes up to 1 Mb on either side of these SNPs.
mQTL analyses for the 1:100 potentially causal SNPs in regions of interest (1 MB on either side of the index SNP) were conducted using the Mayo dataset only, because methylation was assayed with the much denser 450K array and the Mayo sample included histologies other than HGSOC. Within each region, CpG probes were filtered based on their association with gene expression. For each expression probe within the region, a linear model was fit by CpG probe adjusted for age and CNV overlapping the expression probes. The CpG with the strongest negative test statistic for each gene (across multiple expression probes per gene) was retained for mQTL analysis in order to reduce the total number of tests. We performed VanderWaerden rank transformations of the beta values to account for skewed distributions in the beta-values, and conducted linear regression of the SNP genotypes on the transformed beta values, adjusted for age and CNV overlapping the CpG probe; missing CNV values were imputed using the median for the non-missing samples within each region. As a sensitivity analysis, we also performed analyses adjusted only for age. Analyses were conducted for all histologies, as well as for the serous, HGSOC, and ENOC subsets. Raw. Loci were eliminated from analyses where there were either no Agilent probes for the region on the array (9q31.1) or there were no negatively associated CpGs on the 450k array (8q21.11).
For eQTL and mQTL analyses two-sided p-values are reported.
Mapping risk SNPs to biofeatures
Cell culture
Cell lines were cultured in their respective media as follows: GTFR230, NOSE-CM (1:1 Medium 199: MCDB105 (both Sigma Aldrich), 15% fetal bovine serum (FBS, Hyclone), 500 ng/ml hydrocortisone, 5 μg/ml insulin (both Sigma Aldrich) 10 ng/ml epidermal growth factor and 34 μg protein/ml bovine pituitary extract (both Life Technologies); MCAS, EMEM supplemented with 15% FBS (Seradigm); RMG-II and JHOC5, RPMI plus 10% FBS and OAW42, DMEM containing 10% FBS, 20 μg/ml insulin and sodium pyruvate (Lonza). Cell lines were authenticated by profiling short tandem repeats using the Promega Powerplex 16HS Assay (performed at the University of Arizona Genetics Core facility) and all cultures tested negative for contaminating Mycoplasma infections using a Mycoplasma specific PCR.
Chromatin immunoprecipitation (ChIP)
Our ChIP protocol was based on the methods of Schmidt et al. 19 Four 15cm dishes of cells were fixed in formaldehyde for 10 minutes, before quenching the fixation with glycine. Cells were harvested, lysed in a sarkosyl-containing lysis buffer, and sonicated using the Covaris E220 evolution Focused-Ultrasonicator to yield 100-300bp genomic DNA fragments. 5 μg of an antibody raised against H3K27ac (Diagenode) was incubated with blocked magnetic Dynabeads (Life Technologies) at 4°C for 4 hours. Antibody-bead conjugates were incubated with 100 μg chromatin at 4°C overnight, with constant agitation. Beads were washed extensively with RIPA buffer and then RNase and proteinase K (both Qiagen) treated. DNA was then eluted from the beads in TE buffer and cleaned up using the QIAquick PCR Purification kit (Qiagen). Two independent immunoprecipitations and one input sample were sequenced for each cell line and each sample was quality checked by site-specific qPCR prior to next generation sequencing (NGS).
Next generation sequencing
ChIP libraries were constructed using the Kapa Hyper Library Preparation kit, according to manufacturer’s instructions. Approximately 2/3 of the immunoprecipitated (IP) material was used as the starting amount. For undiluted input samples, 100-300 ng of starting material was used. Construction was carried out according to manufacturer’s instructions using Bio NextFLex adapters diluted 1:50. Final PCR on a portion of the adapter ligation was performed for 12 cycles. Products were evaluated by the Agilent Bioanalyzer, using high sensitivity DNA chips. ChIP libraries were quantified using Kapa Biosystems Illumina library quantification kit, then 12 pooled for sequencing, which was carried out using single end reads with 75 cycles on a NextSeq 500 (with version 2 chemistry).
Analysis of ChIP-seq data
ChIP-seq data were processed using MACS2 with p value cutoff of 0.001. The smaller of input or signal was linearly scaled to the same depth as the larger dataset. In order to control the irreproducible discovery rate in ChIPseq analysis, we used IDR version 2.0 pipeline. 20 A standard IDR threshold p< 0.05 was applied.
Functional annotation of variants
We used shell scripts with bedtools (http://bedtools.readthedocs.org/en/latest/) to generate overlap data between all variants in each associated region including likely causal SNPs and bed file versions of all the data represented in Figure 2 and Supplementary Table 6. In addition we included 3’UTRs, 5’UTRs, miRcode high confidence conserved microRNA target sites, high confidence microRNA target sites from microRNA.org, and all coding exons. The overlap data thus obtained were converted to matrix form by means of python scripts. MicroRNA target sites were only considered that overlapped untranslated (UTR) gene regions. Exonic variants were further assessed for missense or nonsense mutations by Mutect software 21. The NHGRI-EBI GWAS catalog was used to identify SNPs among the potentially causal set with other genome-wide signification associations (Supplementary table 14).
Locus-specific tissue enrichment of variants
H3K27 acetylation peaks were collated from public sources (for HeLa-S3, HCT116, UCSD Ovary, UCSD Sigmoid Colon, Colon Crypt) or from in-house data (IOSE4, IOSE11, FT33, FT246, EEC16, CaOV3, UWB1.289, OAW42, GFTR230, MCAS) (Supplementary table 5 and Supplementary table 16). Overlaps were counted for the all SNPs against which genotypes were imputed in 1000 genomes for each H3K27Ac dataset. The fraction of causal SNPs with overlaps was then tested for significance against this background for each cell type in the H3K27ac datasets using the hypergeometric distribution. Finally, p values were adjusted for multiple comparisons using Bonferroni’s method.
Data availability
OncoArray germline genotype data for OCAC studies will be available through dbGap (www.ncbi.nlm.nih.gov/gap). Summary results are available from the Ovarian Cancer Association Consortium (http://ocac.ccge.medschl.cam.ac.uk/). A subset of the OncoArray germline genotype data for the CIMBA studies will be made publically available through dbGAP. The complete dataset will not be made publically available due to restraints imposed by the ethics committees of individual studies; requests for further data can be made to the Data Access Coordination Committee (http://cimba.ccge.medschl.cam.ac.uk/).
ChipSeq data are available from the Gene Expression Omnibus (www.ncbi.nlm.nih.gov/geo), GEO accession number GSE68104.
Supplementary Material
Acknowledgments
The OCAC Oncoarray genotyping project was funded through grants from the U.S. National Institutes of Health (CA1X01HG007491-01 (C.I.A.), U19-CA148112 (T.A.S.), R01-CA149429 (C.M.P.) and R01-CA058598 (M.T.G.); Canadian Institutes of Health Research (MOP-86727 (L.E.K.) and the Ovarian Cancer Research Fund (A.B.). Funding for the CIMBA Oncoarray genotyping was provided by the Government of Canada through Genome Canada and the Canadian Institutes of Health Research, the Ministere de l’Economie, de la Science et de l’Innovation du Quebec through Genome Québec, the Quebec Breast Cancer Foundation for the PERSPECTIVE project, the US National Institutes of Health (CA1X01HG007491-01 (C.I.A.)), Odense University Hospital Research Foundation (M.T.), the National R&D Program for Cancer Control, Ministry of Health & Welfare, Republic of Korea (#1420190 (S.K.P.), the Italian Association for Cancer Research (IG16933 (L.O.)) and German Cancer Aid (#110837 (R.K.S.). Funding sources for the contributing studies is provided in the Supplementary Notes.
We pay special tribute to the contribution of Professor Brian Henderson to the GAME-ON consortium and to Olga M. Sinilnikova for her contribution to CIMBA and for her part in the initiation and coordination of GEMO until she sadly passed away on the 30th June 2014. We thank the study participants, doctors, nurses, clinical and scientific collaborators, health care providers and health information sources who have contributed to the many studies contributing to this manuscript. A full list is provided in the Supplementary Notes.
Footnotes
Author Contributions
Writing group: C.M.P., K.B.K., J.P.T, S.P.K., K.L., S.W., D.H., M.A.E., A.N.M., G.C.-T., E.L.G., S.J.R., T.A.S., S.A.G., A.C.A. and P.D.P.P. Co-ordinated OCAC OncoArray genotyping: C.M.P., M.J. R., G.C. Coordinated CIMBA OncoArray genotyping: G.C.-T., L.McG, J.S., P.S. OncoArray genotyping: CIDR (M.A., T.S., K.F.D., J.Romm, E.P.), Mayo (J.M.C.), UCam (C.Luccarini). Oncoarray genotype calling and quality control: K.B.K, D.F.E., J.D., D.B., E.D., A.Pirie, A.Lee, J.L., G.L. Performed statistical analyses for OCAC: J.P.T., P.D.P.P. Performed statistical analyses for CIMBA: K.B.K., A.L., A.C.A. Performed the meta-analyses: K.B.K., A.C.A. OCAC database management: M.J.R., A.Berchuck. CIMBA database management and BRCA1/2 variant nomenclature and classification: L.McG., G.L, A.B.S.. Supervised OCAC statistical analyses: P.D.P.P. Supervised CIMBA statistical analyses: A.C.A. Conceived and coordinated the synthesis of the Oncoarray: P.D.P.P., D.F.E., C.A., S.Chanock, S.G., B.H., D.J.H., A.C.A., J.S.. Functional analyses: P.C.L Jr., S.Coetzee, M.A.E., S.A.G., E.L.G., D.H., S.P.K., K.L., J.M.L, G.M.-F., A.N.M., S.J.W, G.C-T., J. Beesley.
Provided DNA samples and/or phenotypic data: C.M.A., K.K.H.A., J.Adlard, I.L.A., H.A-C., N.Antonenkova, G.A., N.Arnold, B.K.A., B.A., J.Azzollini, J.Balmaña, S.N.B., L.Barjhoux, R.B.B., Y.B., M.W.B., A.B.-F., J.Benitez, A.Berchuck, M.Bermisheva, M.Bernardini, M.J.Birrer, M.Bisogna, L.Bjorge, A.Black, K.Blankstein, M.J.Blok, C.Bodelon, N.B., A.Bojesen, B.Bonanni, A.Borg, A.R.B., J.D.B, C.Brewer, L.Brinton, P.B., A.B.-W., F.B., J.Brunet, B.Buecher, R.B., S.S.B., J.Y.B., T.Caldes, M.A.C., I.C., R.C., M.E.C., T.Cescon, S.B.C., J.C.-C., X.Q. C., G.C-T., Y.-E.C., J.Chiquette, W.K.C., K.B.M.C., T.Conner, J.Cook, L.S.C., F.J.C., D.W.C., A.A.D., M.B.D., F.Damiola, S.D.D., A.D.-M., F.Dao, R.D., A.dF., C.D., O.D., Y.C.D., J.A.D., S.M.D., C.M.D., T.D., L.D., M.Duran, M.Dürst, B.D., D.E., T.E., R.E., U.E., B.E., A.B.E., S.E., M.E., K.H.E., C.E., D.G.E., P.A.F., S.F., S.F.F., J.M.F., T.M.F., Z.C.F., R.T.F., F.F., W.D.F., G.F., B.L.F., E.F., D.F., P.A.G., J.Garber, M.J.G., V.G.-B., S.A.G., A.G., A.G.-M., A.M.-G., G.Giles, R.G., G.Glendon, A.K.G., D.E.G., E.L.G., M.T.G., T.G., M.G., M.H.G., J.Gronwald, E.Hahnen, C.A.H., N.H., U.H., T.V.O.H., P.A.H., H.R.H., J.Hauke, A.Hein, A.Henderson, M.A.T.H., P.H., S.H., C.K.H., E.Høgdall, F.B.L.H., H.H., M.J.H., K.H., R-Y.H., P.J.H., J.Hung, D.G.H., T.H., E.N.I., C.I., E.S.I., L.I., A.I., A.Jakubowska, P.J., R.J., A.Jensen, M.J., U.B.J., E.M.J., S.J., M.E.J., P.K., B.Y.K., A.Karzenis, K.K., L.E.K., C.J.K., E.K., L.A.K., J.I.K., S.-W.K., S.K.K., M.K., R.K.K., T.A.K., J.K., A.Kwong, Y.L., D.Lambrechts, N.L., M.C.L., C.Lazaro, N.D.L., L.LeM., J.W.L., S.B.L., A.Leminen, D.Leroux, J.Lester, F.L., D.A.L., D.Liang, C.Liebrich, J.Lilyquist, L.Lipworth, J.Lissowska, K.H.L., J.Lubi ski, L.Lundvall, P.L.M., S. Manoukian, L.F.A.G.M., T.M., S.Mazoyer, J.McA., V.McG., J.R.McL., I.McN., H.E.J.M.-H., A.M., U.M., A.R.M., M.Merritt, R.L.M., G.M., F.M., J.M.-S., M.Moffitt, M.Montagna, K.B.M., A.M.M., J.M., S.A.N., K.L.N., L. N., R.B.N., S.L.N., H.N., D.N., R.L.N., K.Odunsi, K.Offit, E.O., O.I.O., H.O., C.O., D.M.O’M., K-R.O., N.C.O.-M., N.O., S.O., A.O., L.O., D.P., L.Papi, S.K.P., T-W.P.-S., J.P., C.L.P., I.S.P., P.H.M.P., B.Peissel, A.Peixoto, T.Pejovic, L.M.P., J.B.P., P.Peterlongo, L.P., G.P., P.D.P.P., C.M.P., K.-A.P., M.P., M.C.P., A.M.P., S.R.P., T.Pocza, E.M.P., B.Poppe, M.E.P., F.P., D.P., M.A.P., P.Pujol, P.Radice, S.J.R., J.Rantala, C.R.-F., G.R., K.R., P.Rice, A.Richardson, H.A.R., M.R., G.C.R., C.R-A., M.A.Rookus, M.A.Rossing, J.H.R., A.Rudolph, I.B.R., H.B.S., D.P.S., J.M.S., R.K.S., M.J.S., T.A.S., L.Senter, V.W.S., G.Severi, P.Sharma, N.S., L.E.Side, W.S., J.S., C.F.S., H.Sobol, H.Song, P.Soucy, M.S., A.B.S., Z.S., D.S., D.S.-L., L.E.S.-C., G. Sukiennicki, R.S., C.S., A.J.S., C.I.S., L.Szafron, Y.Y.T., J.A.T., M.-K.T., M.R.T., S.-H.T., K.L.T., M.Thomassen, P.J.T., L.C.V.T., D.L.T., L.T., A.V.T., M.Tischkowitz, S.T., A.E.T., A.Tone, B.T., R.T., A. Trichopoulou, N.T., S.S.T., A.M.V.A., D.V.D.B., A.H.V.D.H., R.B.V.D.L., M.V.H., E.V.N., E.J.V.R., A.Vanderstichele, R.V.-M., A.Vega, D.V.E., I.V., J.V., R.A.V., A.Vratimos, L.W., C.W., D.W., S.W.-G., B.W., P.M.W., C.R.W., J.N.W., N.W., A.S.W., J.T.W., L.R.W., A.W., M.W., A.H.W., X.W., H.Y., D.Y., A.Z., K.K.Z.
All authors read and approved the final manuscript.
Competing interests
The authors declare no competing financial interests related to this manuscript.
Websites
Nature Publishing Group. Nature Genetics - iCOGS, http://www.nature.com/icogs/
The Cancer Genome Atlas Project - http://cancergenome.nih.gov/
The cBio Cancer Genomics Portal - http://www.cbioportal.org/
Pupasuite 3.1 -http://pupasuite.bioinfo.cipf.es
OCAC - http://apps.ccge.medschl.cam.ac.uk/consortia/ocac/
CIMBA QC guidelines-http://ccge.medschl.cam.ac.uk/consortia/cimba/members/data%20management/CIMBA%20and%20BCAC%20Quality%20Control%20November%202008%20v2.doc
References
- 1.Prat J. Ovarian carcinomas: five distinct diseases with different origins, genetic alterations, and clinicopathological features. Virchows Arch. 2012;460:237–49. doi: 10.1007/s00428-012-1203-5. [DOI] [PubMed] [Google Scholar]
- 2.Vang R, Shih Ie M, Kurman RJ. Fallopian tube precursors of ovarian low- and high-grade serous neoplasms. Histopathology. 2013;62:44–58. doi: 10.1111/his.12046. [DOI] [PubMed] [Google Scholar]
- 3.Wang Y, et al. Tubal origin of ovarian endometriosis and clear cell and endometrioid carcinoma. Am J Cancer Res. 2015;5:869–79. [PMC free article] [PubMed] [Google Scholar]
- 4.Gounaris I, Brenton JD. Molecular pathogenesis of ovarian clear cell carcinoma. Future Oncol. 2015;11:1389–405. doi: 10.2217/fon.15.45. [DOI] [PubMed] [Google Scholar]
- 5.Brown J, Frumovitz M. Mucinous tumors of the ovary: current thoughts on diagnosis and management. Curr Oncol Rep. 2014;16:389. doi: 10.1007/s11912-014-0389-x. [DOI] [PMC free article] [PubMed] [Google Scholar]
- 6.Jervis S, et al. Ovarian cancer familial relative risks by tumour subtypes and by known ovarian cancer genetic susceptibility variants. J Med Genet. 2014;51:108–13. doi: 10.1136/jmedgenet-2013-102015. [DOI] [PubMed] [Google Scholar]
- 7.Lu Y, et al. Most common ’sporadic’ cancers have a significant germline genetic component. Hum Mol Genet. 2014;23:6112–8. doi: 10.1093/hmg/ddu312. [DOI] [PMC free article] [PubMed] [Google Scholar]
- 8.Song H, et al. A genome-wide association study identifies a new ovarian cancer susceptibility locus on 9p22.2. Nat Genet. 2009;41:996–1000. doi: 10.1038/ng.424. [DOI] [PMC free article] [PubMed] [Google Scholar]
- 9.Goode EL, et al. A genome-wide association study identifies susceptibility loci for ovarian cancer at 2q31 and 8q24. Nat Genet. 2010;42:874–9. doi: 10.1038/ng.668. [DOI] [PMC free article] [PubMed] [Google Scholar]
- 10.Bolton KL, et al. Common variants at 19p13 are associated with susceptibility to ovarian cancer. Nat Genet. 2010;42:880–4. doi: 10.1038/ng.666. [DOI] [PMC free article] [PubMed] [Google Scholar]
- 11.Permuth-Wey J, et al. Identification and molecular characterization of a new ovarian cancer susceptibility locus at 17q21.31. Nat Commun. 2013;4:1627. doi: 10.1038/ncomms2613. [DOI] [PMC free article] [PubMed] [Google Scholar]
- 12.Shen H, et al. Epigenetic analysis leads to identification of HNF1B as a subtype-specific susceptibility gene for ovarian cancer. Nat Commun. 2013;4:1628. doi: 10.1038/ncomms2629. [DOI] [PMC free article] [PubMed] [Google Scholar]
- 13.Bojesen SE, et al. Multiple independent variants at the TERT locus are associated with telomere length and risks of breast and ovarian cancer. Nat Genet. 2013;45:371–84. 384e1–2. doi: 10.1038/ng.2566. [DOI] [PMC free article] [PubMed] [Google Scholar]
- 14.Pharoah PD, et al. GWAS meta-analysis and replication identifies three new susceptibility loci for ovarian cancer. Nat Genet. 2013;45:362–70. 370e1–2. doi: 10.1038/ng.2564. [DOI] [PMC free article] [PubMed] [Google Scholar]
- 15.Kuchenbaecker KB, et al. Identification of six new susceptibility loci for invasive epithelial ovarian cancer. Nat Genet. 2015;47:164–71. doi: 10.1038/ng.3185. [DOI] [PMC free article] [PubMed] [Google Scholar]
- 16.Kelemen LE, et al. Genome-wide significant risk associations for mucinous ovarian carcinoma. Nat Genet. 2015;47:888–97. doi: 10.1038/ng.3336. [DOI] [PMC free article] [PubMed] [Google Scholar]
- 17.Kar SP, et al. Genome-Wide Meta-Analyses of Breast, Ovarian, and Prostate Cancer Association Studies Identify Multiple New Susceptibility Loci Shared by at Least Two Cancer Types. Cancer Discov. 2016;6:1052–67. doi: 10.1158/2159-8290.CD-15-1227. [DOI] [PMC free article] [PubMed] [Google Scholar]
- 18.Amos CI, et al. The OncoArray Consortium: a Network for Understanding the Genetic Architecture of Common Cancers. Cancer Epidemiol Biomarkers Prev (2016) 2016 Oct 3; doi: 10.1158/1055-9965.EPI-16-0106. [DOI] [PMC free article] [PubMed] [Google Scholar]
- 19.Couch FJ, et al. Genome-wide association study in BRCA1 mutation carriers identifies novel loci associated with breast and ovarian cancer risk. PLoS Genet. 2013;9:e1003212. doi: 10.1371/journal.pgen.1003212. [DOI] [PMC free article] [PubMed] [Google Scholar]
- 20.Abecasis GR, et al. The 1000 Genomes Project. An integrated map of genetic variation from 1,092 human genomes. Nature. 2012;491:56–65. doi: 10.1038/nature11632. [DOI] [PMC free article] [PubMed] [Google Scholar]
- 21.Lawrenson K, et al. Common variants at the CHEK2 gene locus and risk of epithelial ovarian cancer. Carcinogenesis. 2015;36:1341–53. doi: 10.1093/carcin/bgv138. [DOI] [PMC free article] [PubMed] [Google Scholar]
- 22.Barnes DR, Lee A, Easton DF, Antoniou AC. Evaluation of association methods for analysing modifiers of disease risk in carriers of high-risk mutations. Genet Epidemiol. 2012;36:274–91. doi: 10.1002/gepi.21620. [DOI] [PubMed] [Google Scholar]
- 23.Stranger BE, et al. Patterns of cis regulatory variation in diverse human populations. PLoS Genet. 2012;8:e1002639. doi: 10.1371/journal.pgen.1002639. [DOI] [PMC free article] [PubMed] [Google Scholar]
- 24.Li Q, et al. Integrative eQTL-based analyses reveal the biology of breast cancer risk loci. Cell. 2013;152:633–41. doi: 10.1016/j.cell.2012.12.034. [DOI] [PMC free article] [PubMed] [Google Scholar]
- 25.Coetzee SG, Coetzee GA, Hazelett DJ. motifbreakR: an R/Bioconductor package for predicting variant effects at transcription factor binding sites. Bioinformatics. 2015;31:3847–9. doi: 10.1093/bioinformatics/btv470. [DOI] [PMC free article] [PubMed] [Google Scholar]
- 26.Guan Y, et al. Amplification of PVT1 contributes to the pathophysiology of ovarian and breast cancer. Clin Cancer Res. 2007;13:5745–55. doi: 10.1158/1078-0432.CCR-06-2882. [DOI] [PubMed] [Google Scholar]
- 27.Welter D, et al. The NHGRI GWAS Catalog, a curated resource of SNP-trait associations. Nucleic Acids Res. 2014;42:D1001–6. doi: 10.1093/nar/gkt1229. [DOI] [PMC free article] [PubMed] [Google Scholar]
- 28.Wakefield J. A Bayesian measure of the probability of false discovery in genetic epidemiology studies. Am J Hum Genet. 2007;81:208–27. doi: 10.1086/519024. [DOI] [PMC free article] [PubMed] [Google Scholar]
- 29.Jervis S, et al. A risk prediction algorithm for ovarian cancer incorporating BRCA1, BRCA2, common alleles and other familial effects. J Med Genet. 2015;52:465–75. doi: 10.1136/jmedgenet-2015-103077. [DOI] [PMC free article] [PubMed] [Google Scholar]
- 30.Coetzee SG, et al. Cell-type-specific enrichment of risk-associated regulatory elements at ovarian cancer susceptibility loci. Hum Mol Genet. 2015;24:3595–607. doi: 10.1093/hmg/ddv101. [DOI] [PMC free article] [PubMed] [Google Scholar]
- 31.Kurman RJ, et al. Papillary tubal hyperplasia: the putative precursor of ovarian atypical proliferative (borderline) serous tumors, noninvasive implants, and endosalpingiosis. Am J Surg Pathol. 2011;35:1605–14. doi: 10.1097/PAS.0b013e318229449f. [DOI] [PMC free article] [PubMed] [Google Scholar]
- 32.Diaz-Padilla I, et al. Ovarian low-grade serous carcinoma: a comprehensive update. Gynecol Oncol. 2012;126:279–85. doi: 10.1016/j.ygyno.2012.04.029. [DOI] [PubMed] [Google Scholar]
- 33.Wan M, Qin J, Songyang Z, Liu D. OB fold-containing protein 1 (OBFC1), a human homolog of yeast Stn1, associates with TPP1 and is implicated in telomere length regulation. J Biol Chem. 2009;284:26725–31. doi: 10.1074/jbc.M109.021105. [DOI] [PMC free article] [PubMed] [Google Scholar]
- 34.Kuhn E, et al. Telomere length in different histologic types of ovarian carcinoma with emphasis on clear cell carcinoma. Mod Pathol. 2011;24:1139–45. doi: 10.1038/modpathol.2011.67. [DOI] [PMC free article] [PubMed] [Google Scholar]
- 35.Spisak S, et al. CAUSEL: an epigenome- and genome-editing pipeline for establishing function of noncoding GWAS variants. Nat Med. 2015;21:1357–63. doi: 10.1038/nm.3975. [DOI] [PMC free article] [PubMed] [Google Scholar]
- 36.Lawrenson K, et al. Functional mechanisms underlying pleiotropic risk alleles at the 19p13.1 breast-ovarian cancer susceptibility locus. Nat Commun. 2016;7:12675. doi: 10.1038/ncomms12675. [DOI] [PMC free article] [PubMed] [Google Scholar]
- 37.Lu Y, et al. Shared genetics underlying epidemiological association between endometriosis and ovarian cancer. Hum Mol Genet. 2015;24:5955–64. doi: 10.1093/hmg/ddv306. [DOI] [PMC free article] [PubMed] [Google Scholar]
- 38.Jonsson JM, et al. Molecular subtyping of serous ovarian tumors reveals multiple connections to intrinsic breast cancer subtypes. PLoS One. 2014;9:e107643. doi: 10.1371/journal.pone.0107643. [DOI] [PMC free article] [PubMed] [Google Scholar]
- 2.Gaudet MM, et al. Identification of a BRCA2-specific modifier locus at 6p24 related to breast cancer risk. PLoS Genet. 2013;9:e1003173. doi: 10.1371/journal.pgen.1003173. [DOI] [PMC free article] [PubMed] [Google Scholar]
- 7.Amos C DJ, Wang Z, Byun J, Schumacher F, et al. The OncoArray Consortium: a Network for Understanding the Genetic Architecture of Common Cancers. Cancer Epidemiol Biomarkers Prev. 2016 doi: 10.1158/1055-9965.EPI-16-0106. [DOI] [PMC free article] [PubMed] [Google Scholar]
- 8.Li Y, et al. FastPop: a rapid principal component derived method to infer intercontinental ancestry using genetic data. BMC Bioinformatics. 2016;17:122. doi: 10.1186/s12859-016-0965-1. [DOI] [PMC free article] [PubMed] [Google Scholar]
- 10.Delaneau O, Coulonges C, Zagury JF. Shape-IT: new rapid and accurate algorithm for haplotype inference. BMC Bioinformatics. 2008;9:540. doi: 10.1186/1471-2105-9-540. [DOI] [PMC free article] [PubMed] [Google Scholar]
- 11.van Leeuwen EM, et al. Population-specific genotype imputations using minimac or IMPUTE2. Nat Protoc. 2015;10:1285–96. doi: 10.1038/nprot.2015.077. [DOI] [PubMed] [Google Scholar]
- 13.Antoniou AC, et al. A locus on 19p13 modifies risk of breast cancer in BRCA1 mutation carriers and is associated with hormone receptor-negative breast cancer in the general population. Nat Genet. 2010;42:885–92. doi: 10.1038/ng.669. [DOI] [PMC free article] [PubMed] [Google Scholar]
- 14.Willer CJ, Li Y, Abecasis GR. METAL: fast and efficient meta-analysis of genomewide association scans. Bioinformatics. 2010;26:2190–1. doi: 10.1093/bioinformatics/btq340. [DOI] [PMC free article] [PubMed] [Google Scholar]
- 15.The Cancer Genome Atlas: Integrated genomic analyses of ovarian carcinoma. Nature. 2011;474:609–15. doi: 10.1038/nature10166. [DOI] [PMC free article] [PubMed] [Google Scholar]
- 16.Sankararaman S, Sridhar S, Kimmel G, Halperin E. Estimating local ancestry in admixed populations. Am J Hum Genet. 2008;82:290–303. doi: 10.1016/j.ajhg.2007.09.022. [DOI] [PMC free article] [PubMed] [Google Scholar]
- 17.Shabalin AA. Matrix eQTL: ultra fast eQTL analysis via large matrix operations. Bioinformatics. 2012;28:1353–8. doi: 10.1093/bioinformatics/bts163. [DOI] [PMC free article] [PubMed] [Google Scholar]
- 19.Schmidt D, et al. ChIP-seq: using high-throughput sequencing to discover protein-DNA interactions. Methods. 2009;48:240–8. doi: 10.1016/j.ymeth.2009.03.001. [DOI] [PMC free article] [PubMed] [Google Scholar]
- 20.Bickel PJ, Brown JB, Huang H, Li Q. An overview of recent developments in genomics and associated statistical methods. Philos Trans A Math Phys Eng Sci. 2009;367:4313–37. doi: 10.1098/rsta.2009.0164. [DOI] [PubMed] [Google Scholar]
- 21.Cibulskis K, et al. Sensitive detection of somatic point mutations in impure and heterogeneous cancer samples. Nat Biotechnol. 2013;31:213–9. doi: 10.1038/nbt.2514. [DOI] [PMC free article] [PubMed] [Google Scholar]
Associated Data
This section collects any data citations, data availability statements, or supplementary materials included in this article.
Supplementary Materials
Data Availability Statement
OncoArray germline genotype data for OCAC studies will be available through dbGap (www.ncbi.nlm.nih.gov/gap). Summary results are available from the Ovarian Cancer Association Consortium (http://ocac.ccge.medschl.cam.ac.uk/). A subset of the OncoArray germline genotype data for the CIMBA studies will be made publically available through dbGAP. The complete dataset will not be made publically available due to restraints imposed by the ethics committees of individual studies; requests for further data can be made to the Data Access Coordination Committee (http://cimba.ccge.medschl.cam.ac.uk/).
ChipSeq data are available from the Gene Expression Omnibus (www.ncbi.nlm.nih.gov/geo), GEO accession number GSE68104.