

ABSTRACT
Antiangiogenesis with bevacizumab, an antibody against vascular endothelial growth factor (VEGF), has been used for devascularization to limit the growth of malignant glioma. However, the benefits are transient due to elusive mechanisms underlying resistance to the antiangiogenic therapy. Glioma stem cells (GSCs) are capable of forming vasculogenic mimicry (VM), an alternative microvascular circulation independent of VEGF-driven angiogenesis. Herein, we report that the formation of VM was promoted by bevacizumab-induced macroautophagy/autophagy in GSCs, which was associated with tumor resistance to antiangiogenic therapy. We established a 3-dimensional collagen scaffold to examine the formation of VM and autophagy by GSCs, and found that rapamycin increased the number of VM and enhanced KDR/VEGFR-2 phosphorylation. Treatment with chloroquine, or knockdown of the autophagy gene ATG5, inhibited the formation of VM and KDR phosphorylation in GSCs. Notably, neutralization of GSCs-produced VEGF with bevacizumab failed to recapitulate the effect of chloroquine treatment and ATG5 knockdown, suggesting that autophagy-promoted formation of VM was independent of tumor cell-derived VEGF. ROS was elevated when autophagy was induced in GSCs and activated KDR phosphorylation through the phosphoinositide 3-kinase (PI3K)-AKT pathway. A ROS inhibitor, N-acetylcysteine, abolished KDR phosphorylation and the formation of VM by GSCs. By examination of the specimens from 95 patients with glioblastoma, we found that ATG5 and p-KDR expression was strongly associated with the density of VM in tumors and poor clinical outcome. Our results thus demonstrate a crucial role of autophagy in the formation of VM by GSCs, which may serve as a therapeutic target in drug-resistant glioma.
KEYWORDS: ATG5, autophagy, glioma stem cells, vasculogenic mimicry, VEGFR-2
Introduction
Stroma in glioblastoma (GBM) is characterized by active vascularization that is highly correlated with the degree of malignancy.1 Therefore, several current therapies against GBM aim at proliferation of vascular endothelial cells (ECs), an important component of blood vessels within tumors.2 However, an antiangiogenic monotherapy with bevacizumab (BEV), also named Avastin, failed to improve the overall survival of patients, as drug resistance or angiogenic rebound rapidly occurred once the treatment was terminated.3-6 Consistent with clinical evidence, studies of antiangiogenic therapy in animal models have yielded unexpected development of malignant tumors,7,8 implying an escape mechanism that tumor vasculogenic processes bypass the vascular EC-mediated angiogenesis. Recent researches demonstrated that vasculogenic mimicry (VM), an alternative vasculature formed by tumor cells, plays a critical role in the progression of GBM and that targeting ECs in tumors may not be sufficient to disrupt tumor blood supply, hence the inhibition of tumor progression.9-13
VM has been implicated in neovascularization in tumors. The walls of VM in GBM are composed of tumor cells expressing GFAP, CDH5/cadherin 5, LAMB2/laminin B2 and KDR/VEGFR-2 (kinase domain insert receptor), suggesting their origin of glioma stem cells (GSCs).14-16 KDR is a single helix transmembrane receptor tyrosine kinase existing as a homodimer and consisting of an intracellular domain and an extracellular domain. The ligand VEGF activates KDR by binding to the extracellular domain.17 GSC-derived tumor cells form VM that involves KDR phosphorylation and activation.18 However, BEV fails to reduce KDR-dependent formation of VM by GSCs in vitro, indicating that KDR-mediated formation of VM does not require the KDR ligand VEGF.19 Therefore, KDR expressed by GSCs that form VM may be activated by factors other than VEGF.
Autophagy as a lysosome-mediated process plays a complex role in tumor progression.20 When deprived of oxygen, nutrients and growth factors, tumor cells maintain their survival through autophagic degradation of misfolded proteins and damaged organelles.21 Autophagy occurs under conditions that may also induce the formation of VM in tumors. For instance, VM appears more frequently in poorly vascularized areas in tumors, where tumor cells form autophagosomes to maintain survival.10,13,18,20,21 Also, both autophagy and VM genetically regulated cellular processes that not only reshape but also adapt to changes in the tumor microenvironment.20,22 Notably, VM-forming malignant melanoma cells express high levels of MAP1LC3/LC3 (microtubule associated protein 1 light chain 3),23 suggesting a link to the formation of VM.
To study the mechanistic basis for the formation of VM in GBM and its potential in antiangiogenic therapy, we established a 3-dimensional (3D) collagen scaffold culture model to examine the role of autophagy in the regulation of the formation of VM by GSCs. We found that autophagy promoted the formation of VM by GSCs via ROS-mediated activation of KDR in tumor cells independent of tumor cell-derived VEGF.
Results
Inhibition of autophagy and angiogenesis reduces the growth of GSC-formed tumors and VM in vivo
We have previously demonstrated the important role of VEGF in KDR-mediated the formation of VM by GSCs.18 In this study, after addition of BEV on GSCs in the endothelial cell basal medium (EBM), we detected autophagosomes in the VM-forming cells (Fig. S1A and B). To analyze the effect of BEV and autophagy on the formation of VM, we implanted GSCs isolated from the GBM cell line U87 and human specimens intracranially into NOD-SCID mice, with or without intraperitoneal administration of BEV, or an autophagy inhibitor chloroquine (CQ), or CQ plus BEV (Fig. 1 and Fig. S2). Bioluminescence imaging showed that BEV administration resulted in the shrinkage of orthotopically growing tumors with significantly decreased vessel density (Fig. 1A to F). In contrast, the number of VM channels increased in tumors of mice treated with BEV (Fig. 1D and F). Conversely, CQ reduced tumor growth along with simultaneous reduction of VM channels, but little difference in vessel density as compared with tumors grown in mice without any treatment (Fig. 1A to F). In mice receiving both BEV and CQ, there was a marked decrease in tumor growth in association with reduction in both vessel density and VM (Fig. 1A to F). Kaplan-Meier plots showed that combined administration of BEV plus CQ significantly prolonged the survival of tumor-bearing mice (Fig. 1C). These results suggest that although BEV reduced VEGF-mediated angiogenesis in orthotopic GBM, it increased the formation of VM in tumors. The autophagy inhibitor CQ not only inhibited spontaneously the formation of VM in tumors, but also significantly reduced VM induced by BEV treatment (Fig. 1D to F). Immunohistochemical staining revealed that ATG5 (autophagy-related 5) was barely detectable in xenograft tumors without BEV treatment, but was potently upregulated by BEV (Fig. 1G). Thus, in a microenvironment with poor blood supply, autophagy in GSCs may promote the formation of VM to provide nutrients required for tumor growth.
Figure 1.
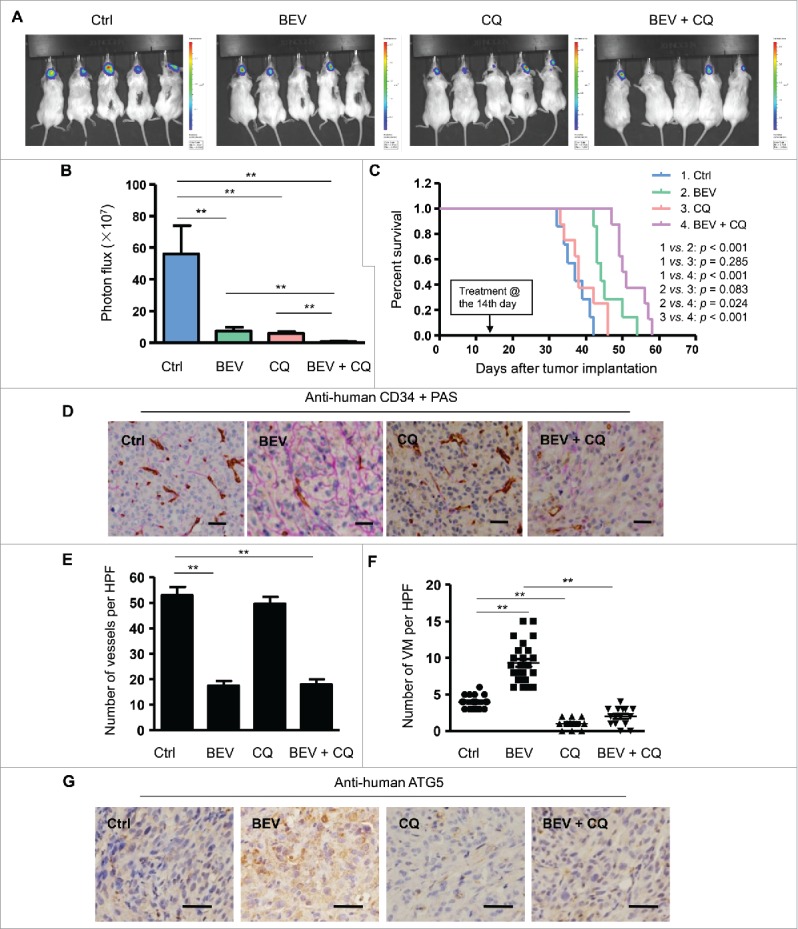
The autophagy inhibitor chloroquine (CQ) attenuates the formation of VM in intracranially xenografted GBM during bevacizumab (BEV) treatment. (A) and (B) Bioluminescent images (A) and quantification of tumors in mice (B) implanted with GSCs from primary human GBM with treatment of saline (control, Ctrl), BEV, CQ and BEV plus CQ obtained on d 20 post-treatment. (C) The survival curves of tumor-bearing NOD-SCID mice implanted with GSCs with different treatments. (D) Representative immunohistochemistry staining for CD34 (brown) and PAS (purple) in brain tissue sections from xenograft tumors. Scale bar: 50 μm. (E) Microvessel density in Ctrl, BEV, CQ and BEV plus CQ treated mouse groups. (F) The number of VM channels in Ctrl, BEV, CQ and BEV plus CQ treated mouse groups. (G) Xenograft tumor sections were immunologically stained for ATG5. ATG5 located in the cytoplasm is shown in brown-yellow color. Scale bar: 10 μm. HPF, high-power field. The results are expressed as the mean ± SEM from 3 experiments.
GSCs forming vascular tubules in 3D scaffold exhibit high levels of autophagy
To study the role of autophagy in the formation of VM by GSCs, we used a 3D collagen scaffold (3D scaffold) (Fig. S3A and B) where GSCs derived from either U87 MG cell line or primary GBM grew rapidly (Fig. S3C to G). GSCs implanted in the scaffold were cultured in DMEM, stem cell culture medium (STM), or EBM respectively. GSCs formed vascular tubule-like structures when cultured in EBM (Fig. S4). H&E staining showed that fusiform cells formed vascular tubule-like structures along the scaffold (Fig. S4). Scanning electron microscopy (SEM) showed that the tubular structure was not formed by tumor cells wrapping the scaffold, but by differentiated cells derived from GSCs interconnected in EBM (Fig. S4). Confocal microscopy revealed that vascular tubule-like structures expressed high levels of VM-related proteins such as CDH5 and LAMB2 (Fig. S4).
To investigate the role of autophagy in the formation of VM, we generated GSCs containing a EGFP-LC3 reporter, since cytosolic LC3-I is lipidated into LC3-II and recruited into phagophores, the precursors to autophagosomes. GSCs containing EGFP-LC3 cultured in EBM showed intense green fluorescent spots, suggesting an increase in autophagosomes (Fig. 2A). Confocal microscopy showed that EGFP-transfected GSCs cultured with EBM formed vascular tube in 3D scaffold. The number of tubular structures formed in EBM significantly increased (Fig. 2B). Increased levels of autophagy-related proteins ATG7 and ATG5 and an elevated LC3-I to LC3-II conversion in EBM were also detected in these cells. In contrast, SQSTM1/p62, another autophagy-related protein, was degraded, evidence for increased autophagy in GSCs cultured in EBM (Fig. 2C). The expression of KDR, which plays a key role in the formation of VM by GSCs,18 was increased in GSCs cultured in EBM in the scaffold (Fig. 2D). The tyrosine residue Y1175, which is necessary for activation of downstream signaling molecules of KDR, was phosphorylated in VM-forming cells derived from GSCs (Fig. 2D). These cells retained the expression of a glial cell marker, GFAP, indicating the glial lineage of GSCs in the scaffold (Fig. 2D). Immunofluorescent analysis of frozen sections of GSCs cultured in the scaffold with EBM revealed CDH5, LAMB2 and LC3 in the VM-forming cells (Fig. 2E). Thus, autophagy is associated with the formation of VM by GSCs differentiating in EBM.
Figure 2.
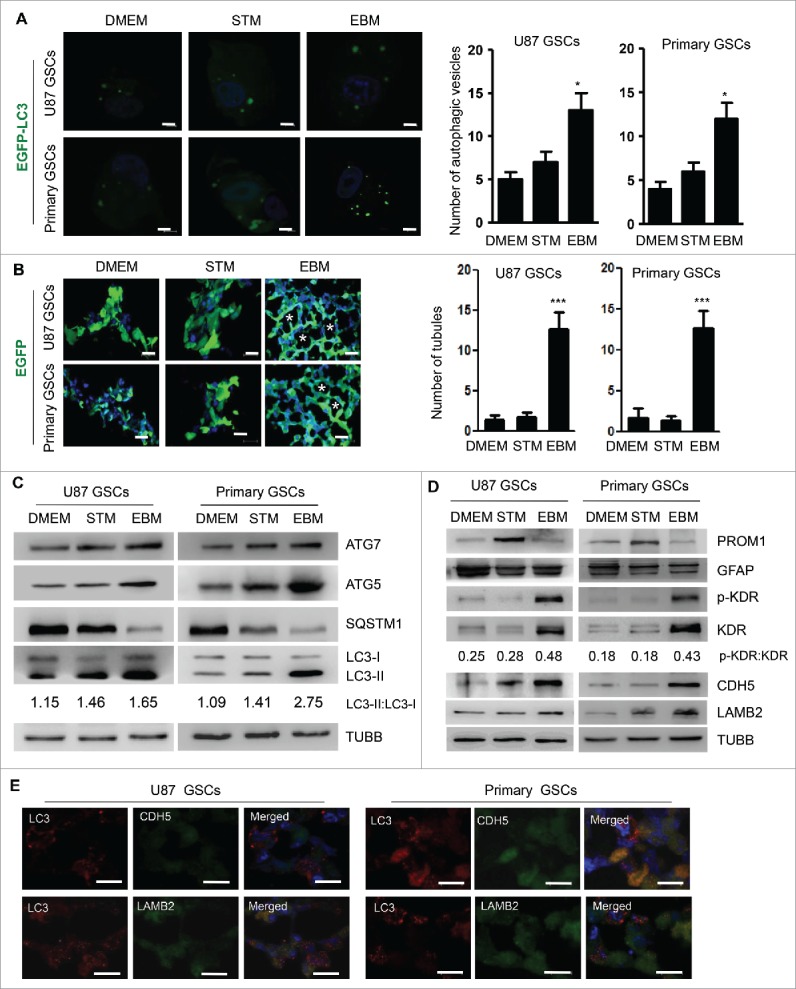
Autophagy promotes tubule-like structure formation by GSCs in 3D scaffold. (A) GSCs transfected with EGFP-LC3 were cultured in DMEM, STM or EBM for 72 h. Confocal microscopy was used to assess autophagy shown as green spots (left panel). Two hundred cells were randomly chosen to count the number of EGFP-LC3 fluorescent spots (right panel). Scale bar: 10 μm. (B) Confocal microscopy showing EGFP-transfected GSCs to form tubule-like structure in 3D scaffold (left panel). The number of tubular structures formed by GSCs in 3D scaffold was analyzed (right pannel). Scale bar: 20 μm. Asterisks (*) indicate VM channel formed by tumor cells. (C) Expression of autophagy proteins, ATG5, ATG7, LC3-I to LC3-II conversion and SQSTM1. TUBB/β-Tubulin served as a control. (D) The expressions of PROM1, GFAP, KDR proteins and the phosphorylation of Y1175 in the C-terminal region of KDR (p-KDR) as well as CDH5 and LAMB2. (E) Double staining of LC3 and CDH5 as well as LC3 and LAMB2 in GSCs cultured with EBM on the scaffold. LC3 is marked as red spots in the cytoplasm; CDH5 and LAMB2 are in green color in the cytoplasm. Scale bar: 20 μm. Nuclei were stained by Hoechst 33324 in blue. The results are expressed as the mean ± SEM from 3 experiments.
Autophagy inducer rapamycin (RAPA) promotes the formation of VM by GSCs through activation of KDR
RAPA promotes autophagy by inhibiting MTOR in cells.24 Addition of 10 nM RAPA in EBM cultured GSCs significantly increased green fluorescent spots in the cytoplasm (Fig. 3A). Western blot detected an increase of LC3-I to LC3-II conversion and degradation of SQSTM1 in GSCs (Fig. 3C), confirming the capacity of RAPA to induce autophagy in GSCs cultured in EBM. After culture of GSCs in the scaffold with EBM for 3 d, confocal microscopy showed EGFP-transfected GSCs treated with RAPA to form more numerous tubular structures in 3D scaffold as compared with cells cultured in control medium (Fig. 3B). Scanning electron microscopy (SEM) showed that tubular structures were formed by differentiated cells (Fig. S5). In addition, RAPA treatment increased the phosphorylation of KDR at Y1175 in GSCs in association with increased levels of VM-related proteins CDH5 and LAMB2 (Fig. 3C).
Figure 3.
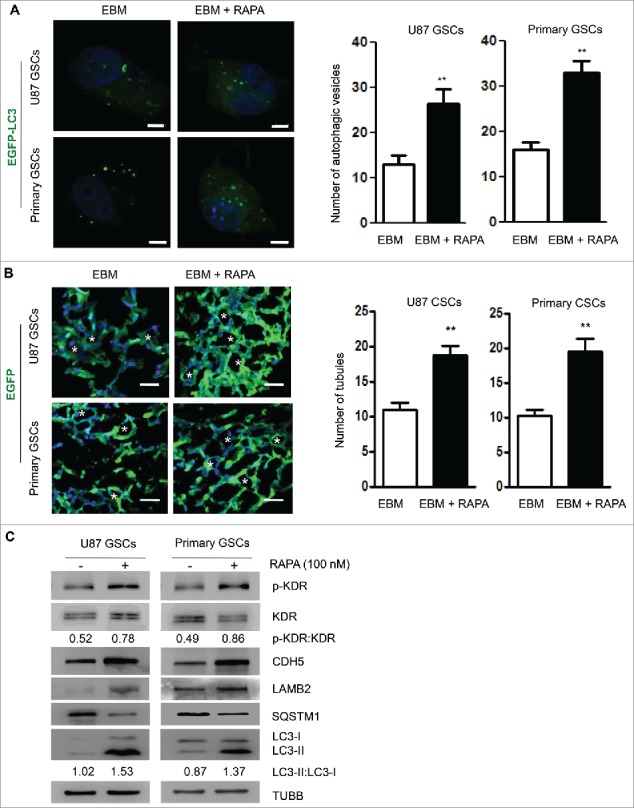
Tubular structure formation by GSCs is promoted by rapamycin (RAPA). (A) RAPA (100 nM) was added to EBM and confocal microscopy was used to detect autophagic vesicles in GSCs forming tubular structure (left panel). Two hundred cells were randomly chosen to count green fluorescent spots within the cells (right panel). Scale bar: 10 μm. (B) Confocal microscopy showing EGFP-transfected GSCs to form tubule-like structure in 3D scaffold (left panel). The number of tubular structures was counted in the scaffold cultured with or without RAPA (right panel). Scale bar: 20 μm. Asterisks (*) indicate VM channel formed by tumor cells. (C) The expression of LC3-I to LC3-II conversion, SQSTM1 and VM-related proteins (KDR, p-KDR, CDH5 and LAMB2) in GSCs treated by RAPA. The results are expressed as the mean ± SEM from 3 experiments.
Autophagy-associated KDR phosphorylation is VEGF-independent
We then used the autophagy inhibitor CQ or knocked-down ATG5 to reduce autophagy in GSCs. Addition of 5 μM CQ resulted in significant increases in green fluorescent spots in the cytoplasm of GSCs (Fig. 4A), suggesting that degradation of autophagic cargo was inhibited with increased LC3-I to LC3-II conversion and SQSTM1 accumulation (Fig. 4C). Increased SQSTM1 accumulation prompted CQ-mediated inhibition of autophagy in GSCs cultured in EBM. Confocal microscopy confirmed significant reduction of tubular structures formed by GSCs in the scaffold (Fig. 4B). Thus, inhibition of autophagy reduced the formation of VM by GSCs. Furthermore, CQ decreased the phosphorylation level of KDR at Y1175 in GSCs and downregulated the expressions of KDR, CDH5 and LAMB2 (Fig. 4C). We observed that p-KDR was not only clearly decreased, but the abundance of KDR was also reduced. Nevertheless, based on the ratio of p-KDR with KDR, the change of p-KDR is more prominent than that of KDR. These results suggest the participation of autophagy in the formation of VM by GSCs through phosphorylation of KDR. We also tested the effect of BEV on KDR phosphorylation in GSCs. Surprisingly, after addition of BEV, the phosphorylation of KDR at Y1175 in GSCs was significantly enhanced and the effect was reversed by CQ (Fig. 4D). Therefore, KDR (Y1175) was phosphorylated in GSCs by increased autophagy that promoted GSCs to form VM.
Figure 4.
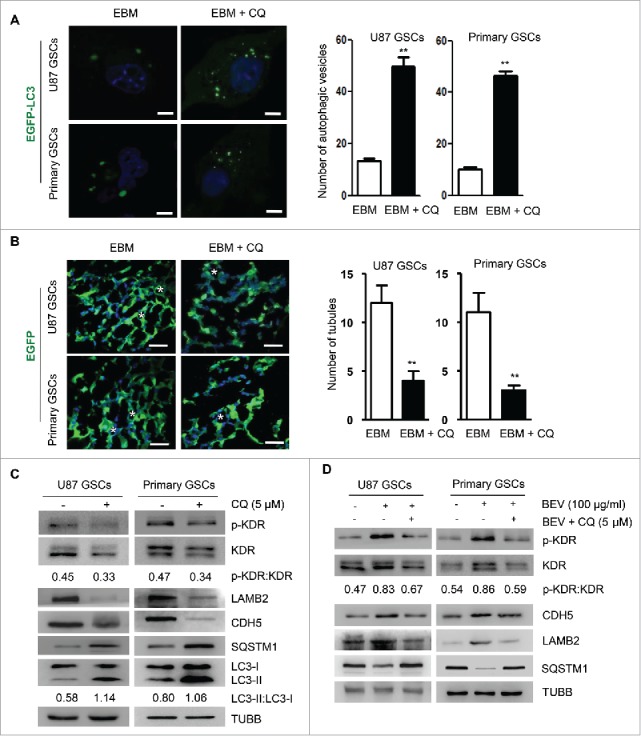
Autophagy mediates the formation of VM through KDR phosphorylation. (A) Confocal microscopy detection of autophagic vesicles formed by GSCs transfected with EGFP-LC3 and treated with 5 μM chloroquine (CQ) (left panel). Two hundred cells were randomly chosen to count green fluorescent spots within the cells (right panel). Scale bar: 10 μm. (B) Confocal microscopy showing EGFP-transfected GSCs to form vascular tubules in 3D scaffold (left panel). The number of tubular structures was counted in the scaffold with or without CQ (right panel). Scale bar: 20 μm. Asterisks (*) indicate VM channels formed by tumor cells. (C) The expression of LC3-I to LC3-II conversion, SQSTM1 and KDR, p-KDR, LAMB2, and CDH5 in GSCs after 5 μM CQ treatment. (D) Western blot detection of p-KDR, KDR, LAMB2, CDH5 and SQSTM1 in GSCs in medium with 100 μg/ml BEV and/or 5 μM CQ. The results are expressed as the mean ± SEM from 3 experiments.
ATG5 is recognized as a core molecular machinery component involved in autophagosome formation, which was also detected in GSCs (Fig. 2C). Therefore, we additionally knocked down ATG5 (siATG5) in GSCs (Fig. 5A), which resulted in a marked decrease in intracellular green fluorescent spots in GSCs cultured with EBM (Fig. 5B and Fig. S6) associated with significantly reduced numbers of tubules (Fig. 5C). In the scaffold, GSCs containing siATG5 (siATG5-GSCs) cultured with EBM expressed reduced levels of VM-associated proteins KDR, CDH5 and LAMB2 (Fig. 5A). Moreover, the phosphorylation level of KDR at Y1175 was decreased in siATG5-GSCs cultured with EBM, in which BEV failed to induce KDR phosphorylation as showed by the ratio of p-KDR with KDR (Fig. 5D). Therefore, in the microenvironment deprived of nutrients, autophagy is increased in GSCs associated with KDR phosphorylation to promote the formation of VM by GSCs necessary for maintaining the VEGF-independent survival of tumor cells. To determine the role of autophagy in the formation of VM by GSCs in vivo, we transplanted siATG5-GSCs into the brain of NOD-SCID mice with or without BEV. Mice receiving GSCs and siATG5-GSCs were killed at the 4-wk point. BEV administration and knockdown of ATG5 resulted in the shrinkage of orthotopically growing tumors, respectively (Fig. S7). In mice receiving both siATG5-GSCs and BEV treatment, tumor growth was significantly inhibited compared with other tumor-bring mice (Fig. S7). Then, tumors were removed for analysis of vasculogenesis. Tumors formed by siATG5-GSCs showed normal numbers of EC-derived vessels (Fig. 5E and Fig. S8A). In contrast, the number of VM detected by PAS and CD34 staining was significantly decreased in tumors formed by siATG5-GSCs (Fig. 5F and Fig. S8B). Administration of BEV, which markedly increased the number of VM in the tumors formed by GSCs, had no effect on the formation of VM by siATG5-GSCs. These results suggest that autophagy promotes the formation of VM by GSCs independent of VEGF. Furthermore, in the absence of autophagy, tumor cells are not able to form VM induced by BEV.
Figure 5.
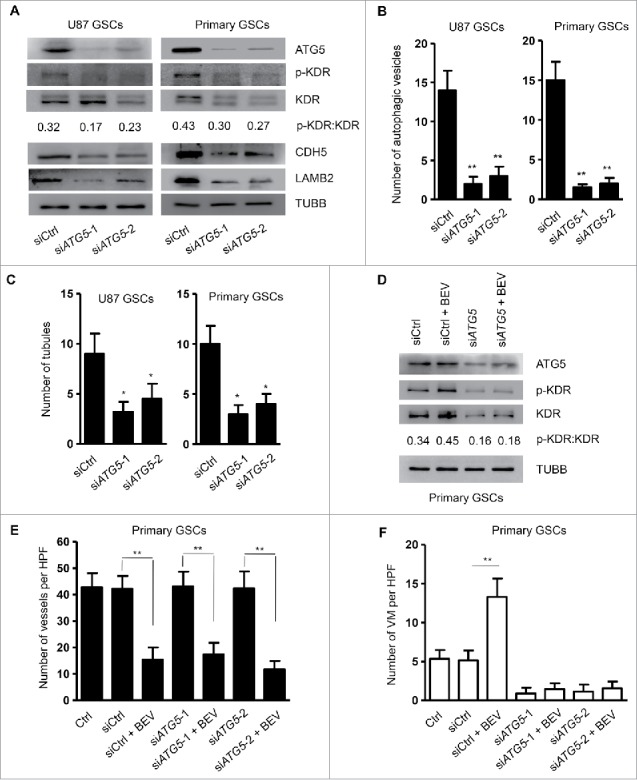
Knockdown of ATG5 reduces tubular structure formation by GSCs and phosphorylation of KDR. (A) The expression of ATG5, p-KDR, KDR, CDH5 and LAMB2 in GSCs transfected with siATG5. (B) Two hundred cells were randomly chosen to count green fluorescent spots within the cells. (C) The number of tubular structures formed by GSCs and siATG5-GSCs in the scaffold counted with confocal microscopy. (D) Western blot detection of p-KDR and KDR in siATG5-GSCs cultured with 100 μg/ml BEV. (E) and (F) Mice with intracranial injection of GSCs transfected with siCtrl RNA or siATG5 were treated with BEV. Forty-two animals were then randomly divided into 7 groups consisting of 6 animals each. After 4 wk, tumors were collected to analyze vessel density (E) and formation of VM (F). HPF, high-power field. The results are expressed as the mean ± SEM from 3 experiments.
Autophagy promotes the phosphorylation of KDR in GSCs via ROS
Autophagy may display its biological activity via ROS and cause the phosphorylation of KDR in ECs to mediate angiogenesis.25 We found an increased ROS level released by GSCs cultured in EBM, which was reduced by addition of CQ. In contrast, RAPA treatment of GSCs increased the level of ROS production (Fig. 6A). After BEV treatment, the levels of ROS produced by GSCs in EBM were also significantly elevated, which were inhibited by CQ and knockdown of ATG5 (Fig. 6B and Fig. S9). After treatment with BEV plus a ROS inhibitor, antioxidant N-acetylcysteine (NAC), confocal microscopy showed significant reduction of tubular structures formed by GSCs in the scaffold (Fig. 6C). Thus, inhibition of ROS reduced the formation of VM by GSCs. BEV treatment resulted in the phosphorylation of KDR, increased LC3-I to LC3-II conversion and the degradation of SQSTM1. Combined treatment of GSCs in EBM with BEV and NAC significantly decreased the phosphorylation of KDR and total KDR without changes in both LC3-I to LC3-II conversion and degradation of SQSTM1 (Fig. 6D). However, the change of p-KDR is more prominent than that of KDR according to the ratio of p-KDR with KDR. As shown in Fig. 6E, NAC and the phosphoinositide 3-kinase (PI3K) inhibitor LY294002 abolished phosphorylation of PIK3R1 (phosphoinositide-3-kinase regulatory subunit 1), suggesting that the PI3K-AKT signaling pathway is required for ROS-mediated KDR phosphorylation. These results indicate that ROS acts as a downstream target of autophagy to promote VEGF-independent KDR phosphorylation in GSCs.
Figure 6.
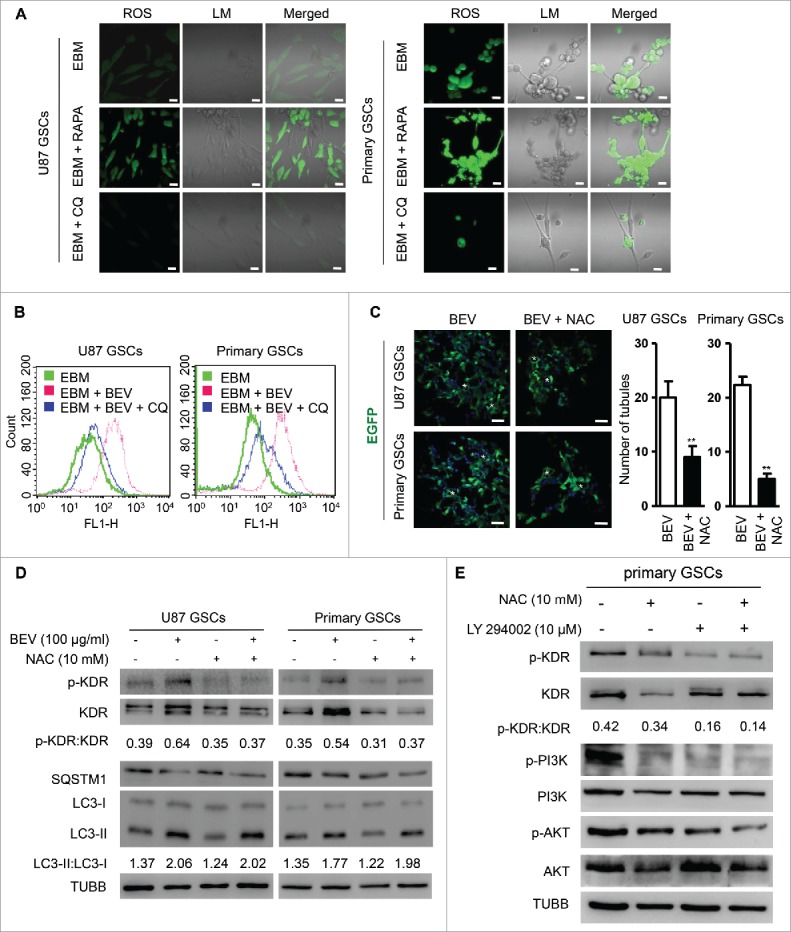
Autophagy promotes the formation of VM by GSCs through ROS-mediated KDR phosphorylation. (A) ROS release measured in GSCs cultured in EBM, EBM + 100 nM RAPA, and EBM + 5 μM CQ. Scale bar: 20 μm. (B) Flow cytometry showing ROS release in GSCs cultured in the scaffold with EBM, EBM + 5 μM CQ and EBM + 5 μM CQ + 100 μg/ml BEV. (C) Confocal microscopy showing EGFP-transfected GSCs treated with 100 μg/ml BEV and BEV plus NAC (ROS inhibitor, 10 mM) to form vascular tubule in 3D scaffold (left panel). The number of tubular structures was counted in the scaffold (right panel). Scale bar: 50 μm. Asterisks (*) indicate VM channel formed by tumor cells. (D) The expression of KDR and KDR (Y1175) phosphorylation in GSCs cultured with 100 μg/ml BEV and/or 10 mM NAC in the scaffold for 72 h. (E) The expression of KDR (Y1175) phosphorylation and PI3K-AKT activation in GSCs cultured with 100 μg/ml BEV and/or 10 mM ROS inhibitor NAC or 10 μM PI3K inhibitor LY29400 in the scaffold for 72 h.
High expression of ATG5 and p-KDR in GBM is correlated with the formation of VM and the survival of patients
To investigate the role of ATG5 in human GBM progression, we examined GBM specimens from 95 patients and found the formation of VM in the specimens of 49 patients (51.6%). The expression of ATG5 in VM-positive GBM was significantly higher than in VM-negative GBM (Fig. S10A). There was a significant correlation between VM and ATG5 in GBM specimens (r = 0.6727, P <0.001) (Fig. 7A, left panel). Moreover, we found a consistent coexpression of ATG5 and p-KDR on serial GBM sections (Fig. S10B). There was a significant correlation between ATG5 and p-KDR in GBM specimens (r = 0.7743, P < 0.001) (Fig. 7A, right panel). Fig. 7B showed that patients with VM-positive GBM had shorter progression-free survival (PFS) and overall survival (OS) than those with VM-negative tumors (P < 0.001). Both PFS and OS of patients with ATG5high tumors were significantly shorter than those with ATG5low tumors (P < 0.001) (Fig. 7C). Similar trend was observed in patients with BECN1high and BECN1low tumors (Fig. S11A and C). However, patients with SQSTM1high tumors showed better prognoses (Fig. S11B). In addition, patients with high p-KDR levels in tumors had shorter PFS (P < 0.001) and OS (P < 0.01) than those with low p-KDR levels in tumors (Fig. 7D). Moreover, GBM tissues with VM expressed higher levels of KDR in tumors than surrounding brain tissues (Fig. S10C). Furthermore, GBM tissues containing VM expressed high levels of ATG5 and ATG7 as compared with surrounding brain tissues without VM (Fig. S10C). There are also increases in LC3-I to LC3-II conversion and SQSTM1 degradation in GBM tissues containing VM (Fig. S10C). These results demonstrate the clinical relevance of autophagy in promoting the formation of VM and GBM progression.
Figure 7.
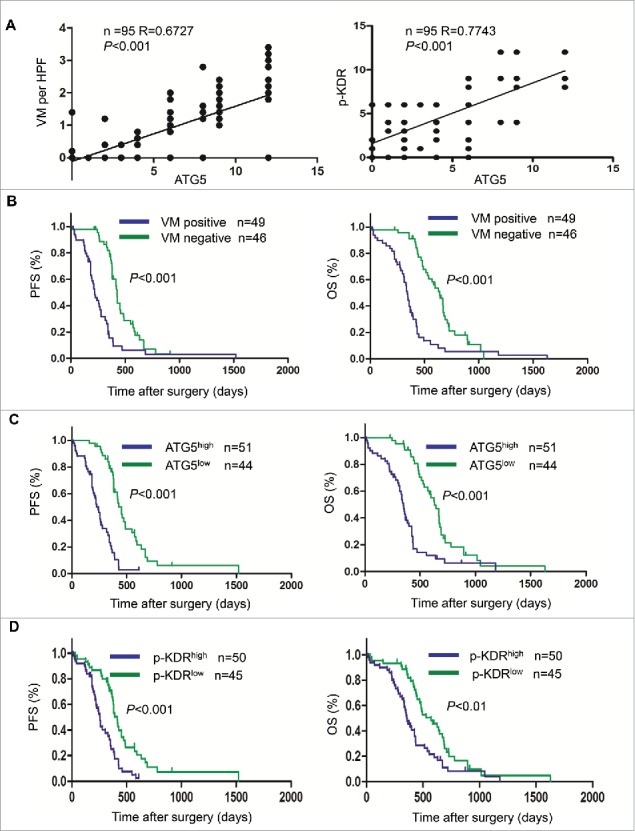
The correlation between the expression levels of ATG5 and KDR with VM as well as patient prognosis. (A) The correlation coefficient (R) between ATG5 and VM as well as p-KDR. (B) Progression free survival rate (PFS) and overall survival rate (OS) in patients divided into VM-positive and VM-negative GBM groups. (C) PFS and OS in patients divided into ATG5high and ATG5low GBM groups. (D) PFS and OS in patients divided into p-KDRhigh and p-KDRlow GBM groups.
Discussion
Antiangiogenic therapy leads to devascularization that limits tumor growth. However, the benefits of angiogenesis inhibitors are typically transient and resistance often develops in tumors.2,3,5,6,8,26 Current antiangiogenic strategies are mainly directed against tumor vascular ECs with the limitation that tumors do not rely solely on blood vessels formed by host ECs for nourishment. Instead, tumors are able to form their own vasculature for which the term VM has been used to describe the fact that tumor cells mimic ECs to form vasculogenic networks.9,10,18 More recently, the antiangiogenic medicine, BEV, has been found to promote the formation of VM in ovarian cancer.27 BEV induces autophagy in tumor cells as an adaptive cytoprotective response, leading to resistance to further BEV therapy.28 Cells exposed to various stress inducers undergo autophagy as a process of self-digestion, during which cytoplasmic cargo sequestered inside the double-membrane vesicles are delivered to the lysosome for degradation. Several in vitro studies suggest that, during tumor development, autophagic self-catabolism of damaged organelles promotes tumor cell survival under hypoxia and nutrient shortage.20,21 Thus, it is important to understand the mechanisms of autophagy in tumor antiangiogenic treatment to improve the effect of therapies.
Our study suggests that BEV reduces xenograft glioma growth and microvascular density but increases VM in an intracranial transplantation model where the autophagy inhibitor CQ abolishes the formation of VM induced by BEV in tumors, suggesting that autophagy induced by conventional antiangiogenic therapy is protective for tumor cells.28 Furthermore, the formation of VM in GBM formed by GSCs in mice, mediated by autophagy required KDR activation. KDR activation has been reported to be either VEGF-dependent or VEGF-independent.29-31 Our study showed that when BEV was used to neutralize VEGF activity released by GSCs cultured in EBM, KDR in GSCs remained activated as evidenced by the phosphorylation at Y1175. In contrast, addition of CQ or siATG5 in GSCs abolished KDR activation, indicating that autophagy activates KDR and regulates the formation of VM by GSCs in a VEGF-independent fashion. KDR consists of an intracellular domain and an extracellular domain.17 VEGF activates KDR by binding to the extracellular domain, whereas ROS functions as a switch to activate the intracellular domain of KDR independent of VEGF.32
ROS has been reported to activate KDR expressed by ECs to regulate angiogenesis.25 This function of ROS is also closely associated with the formation of VM in tumors.33 However, little is known about how both autophagy and ROS regulate KDR activation to form VM in tumors. Cellular metabolism produces a large amount of ROS under physiological and pathological conditions to regulate the formation of autophagosomes.34,35 Autophagy removes excessive ROS by eliminating damaged mitochondria.36 The outcome of this delicate interaction between autophagy and ROS is determined by the microenvironment where cells suvive.36 In rat aortic ECs, autophagy regulates angiogenesis by elevating the levels of intracellular ROS.25 Our study found that large amounts of ROS were produced when GSCs formed VM. ROS levels in GSCs declined when autophagy was suppressed by CQ and knockdown of ATG5 but increased when autophagy was enhanced by RAPA. These results indicate that autophagy and ROS synergistically promote the formation of VM in GSCs. Autophagic degradation of ROS scavengers results in ROS accumulation in the cytoplasm stored in autophagic lysosomes as a major producer of ROS in addition to mitochondria.34,37,38 Both hypoxia and nutrient deprivation predispose tumor cells to autophagy that leads to increases in the levels of ROS.39 Inhibition of autophagy in ECs inactivates both ROS and KDR pathways, and abrogates the ability of ECs to form channel-like structures.25
It is surprising that BEV treatment activates KDR in GSCs independent of VEGF.30,40 Inhibition of autophagy in GSCs, with CQ decreases KDR expression whereas ROS inhibitor NAC failed to attenuate KDR expression, but instead, reduced VM-related proteins CDH5 and LAMB2 in GSCs. This may be due to higher levels of KDR in GSCs.18,41 Although BEV inhibits the autocrine loop of VEGF-KDR in GSCs, the antibody failed to inhibit the differentiation of GSCs to VM. BEV was also unable to suppress autophagy that caused elevated ROS to activate KDR. The mechanism by which ROS mediate KDR phosphorylation remains unclear. It has been reported that the PI3K-AKT signaling pathway plays a key role in angiogenesis by ECs induced by ROS.42 ROS-dependent KDR phosphorylation is essential to VEGF-stimulated recruitment of PI3K-AKT to the KDR.43 Our results showed that the PI3K-AKT signaling pathway is required for ROS to mediate KDR phosphorylation. Therefore, during BEV therapy, it is important to also inhibit both autophagy- and ROS-mediated activation of KDR in GSCs.44
In summary, by using a 3D scaffold culture model, we have identified a critical role of autophagy in the formation of VM by GSCs. We further demonstrated that autophagy-induced ROS through PI3K-AKT pathway promotes the phosphorylation of KDR in GSCs as well as the formation of VM by GSCs independent of VEGF (Fig. 8). This may explain the reason for increased VM after BEV treatment that induces autophagy and ROS release in GSCs. Therefore, autophagy should be considered as a potential target in reducing VM to increase the therapeutic benefit of conventional antiangiogenic therapies in human GBM.
Figure 8.
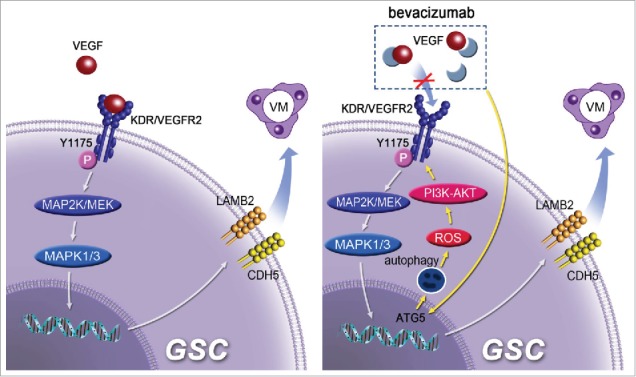
A model for the role of autophagy in promoting the formation of VM and BEV resistance by GSCs. ROS mediates autophagy-induced phosphorylation of KDR/VEGFR-2 by VEGF-independent manner in GSCs through the PI3K-AKT pathway.
Materials and methods
Reagents
The 3D collagen scaffold was obtained courtesy of Professor Jian-Wu Dai from Third Military Medical University. The preparation process has been described elsewhere.45 Stem cell culture medium (STM) consisting of human FGF2/bFGF (10 ng/ml; PeproTech, 100–18B), human EGF (10 ng/ml; PeproTech, AF-100–15), B27-supplement (1:50; Gibco, 17504–044), penicillin-streptomycin (100 U/ml; HyClone, SV30010) was prepared with DMEM/F12 (Invitrogen, 12400–024). Endothelial cell basal medium-2 (EBM, Lonza, CC-3162) was supplemented with 2% fetal calf serum (Lonza, CC-3162). DMEM contained 10% fetal calf serum and penicillin-streptomycin (100 U/ml). Chloroquine (CQ) and rapamycin (RAPA) were purchased from Sigma-Aldrich (C6628 and R8781). N-acetylcysteine (NAC) was got from Enzo Life Science (ALX-105–005). LY294002 was obtained from Abcam (ab120243), which is one of autophagic sequestration inhibitors for class I PI3Ks and class III PtdIns3Ks. Autophagic sequestration is inhibited by class I PI3Ks-yielded PtdIns(3,4,5)P3, but stimulated by class III PtdIns3Ks-produced PtdIns3P. Overall, LY294002 blocks autophagy because class I PI3Ks function upstream of class III PtdIns3Ks.46 siRNA for ATG5 knockdown was obtained from Ribobio (C10511–03).
Antibodies
Antibodies used include mouse anti-LAMB2/laminin B2 monoclonal antibody (mAb; BD Biosciences, 610722), rabbit anti-CDH5/cadherin 5 mAb (Cell Signaling Technology, 2158), rabbit anti-PROM1/CD133 polyclonal antibody (pAb; Santa Cruz Biotechnology, sc-30220), rabbit anti-GFAP pAb (Abcam, ab7260), mouse anti-CD34 mAb (Abcam, ab187282), rabbit anti-VEGF pAb (Proteintech, 19003–1-AP), rabbit anti-phospho- KDR/VEGFR-2 mAb (Cell Signaling Technology, 2478), rabbit anti-KDR/VEGFR-2 mAb (Cell Signaling Technology, 2479), mouse anti-LC3B mAb (Santa Cruz Biotechnology, sc-376404), rabbit anti-ATG5 mAb (Cell Signaling Technology, 8540), rabbit anti-ATG7 mAb (Cell Signaling Technology, 8558), rabbit anti-SQSTM1/p62 pAb (Sigma-Aldrich, P0067), rabbit anti-BECN1 mAb (Abcam, ab51031), mouse anti-PI3K p85 mAb (Abcam, ab86714), rabbit anti-pan-AKT pAb (Abcam, ab8805), rabbit anti-phospho-PI3K p85 (Y607) pAb (Abcam, ab182651), rabbit anti-phospho-pan-AKT pAb (Abcam, ab38449). Fluorescent secondary antibodies used for detection were Cy3-conjugated goat anti-rabbit IgG (Thermo Fisher, A10520) and Cy5-conjugated goat anti-mouse IgG (Thermo Fisher, M32218).
Cell culture
The GBM cell line U87 (ATCC, HTB-14) was maintained as described.47 Primary GBM cells were isolated from human glioblastoma (GBM) specimens as described previously.48 For tumor sphere formation assay, U87MG and primary cells were plated in 100-mm culture dish, and after reaching 80% confluence, the cells were washed with phosphate-buffered saline (PBS; Beyotime Biotechnology, ST476) twice before further culture in stem cell medium. After 7 to 10 d when spheres grew to the size showing a dark core under light microscopy, the spheres were detached by Accutase™ (Millipore, SCR005) to obtain a single cell suspension.
Lentiviral infection
GSCs were infected with concentrated siATG5-eGFP lentivirus or empty control lentivirus vectors (Obio Technology, NBFW-lenti-3299). The sequence for the siRNAs were cloned into pLKD-CMV-G&PR-U6-shRNA and listed in Table S1. Cells were selected and enriched by puromycin (1 μg/ml; Solarbio Science & Technology, P8230) and flow cytometry (BD FACSAria II, New Jersey, USA). The knockdown efficiency was verified by RT-PCR and immunoblotting.
Three-dimensional collagen scaffold culture
The 3D scaffolds were soaked in DMEM for 8 h then sterilized filter papers were used to absorb DMEM. GSCs in 40 μl culture medium were seeded on 3D scaffolds. After 4 h cultures, medium was added to enable cells to permeate and attach the inner surface of the scaffolds.
Immunofluorescence staining of 3D scaffold
Scaffolds with cells for 3-d culture were cut into 6-μm frozen sections and fixed with ice-cold acetone. The frozen sections were blocked with 3% BSA (Sigma-Aldrich, A3912) for 30 min at 37°C and incubated with primary antibodies overnight at 4°C. The sections were then incubated with secondary antibodies and Hoechst at 37°C. Images were observed using a confocal microscope (Zeiss, LSM780NLO, Jena, Germany).
In vitro tubule formation
Scaffolds with EGFP-GSCs for 3-d culture were cut into 10-μm frozen sections and fixed with ice-cold acetone. The sections were then incubated with Hoechst at 37°C. Images were observed using a confocal microscope (Zeiss, LSM780NLO, Jena, Germany). Five fields were randomly chosen to take picture in the cells affluent areas. Tubule formation was analyzed by ImageJ software.18
Scanning electron microscopy
Cells on scaffolds were fixed in 2.5% glutaraldehyde at 4°C for 4 h. The scaffolds were dehydrated through a graded ethanol series for 10 min each. Ethanol was extracted in 3:1, 1:1 and 1:3 mixtures of ethanol and amyl acetate for 20 min each followed by 100% amyl acetate for storage. The scaffolds were then dried by supercritical CO2 extraction, and coated with gold. The images were recorded with a scanning electron microscope (KYKY Technology Co., Ltd, KYKY-EM3200, Beijing, China).
Western blot
GSCs were digested by trypsin from scaffolds and lysed with RIPA buffer (Beyotime Biotechnology, P0013B) supplemented with cocktail inhibitors (Thermo, 78430). BCA was used to measure protein concentration. Proteins were separated by SDS-PAGE (Beyotime Biotechnology, P0012A) and transferred onto PVDF-membranes, which were blocked with 5% nonfat milk in PBST buffer (PBS containing 0.5‰ Tween-20; Beyotime Biotechnology, ST825) then incubated with primary antibodies followed by horseradish peroxidase-conjugated secondary antibodies (ZSGB-BIO; anti-rabbit IgG, ZB-2301; anti-mouse IgG, ZB-2305). Proteins were detected by using a chemiluminescence detection system (BIO-RAD, ChemiDoc™ MP Imaging System) and autoradiography. TUBB/β-Tubulin detected with a rabbit mAb (Cell Signaling Technology, 5346) was used as a loading control.
Autophagy flow assay
GSCs were transfected with 5 × 10⁷ pHBAd-CMV-IRES-GFP shuttle plasmid (HANBIO; hanbio20130521-Adpremade-002) in each well of 6-well plates. After culture on scaffolds for 24 h, the accumulation and distribution of GSCs containing EGFP-LC3 puncta were observed by confocal microscopy 48 h after transfection. GSCs with EGFP-LC3 puncta were counted by randomly selecting 200 separate 400 × fields.
ROS measurement
After culture on scaffolds for 72 h, GSCs were trypsinized and incubated with the fluorescent probe 5-(and-6)-chloromethyl-2′, 7′-dichlorodihydrofluorescein diacetate, acetyl ester (CM-H2DCFDA; Life technologies, C6828) for 10 min before being loaded to a flow cytometer (BD, FACSVerse, New Jersey, USA).
For confocal microscopy, GSCs were collected after culture on scaffold for 72 h and seeded in petri dishes. After 4 h, the cells were incubated with DCF fluorescence probe for 10 min followed by confocal microscopy observation (Zeiss, LSM780NLO, Jena, Germany).
Patients and tumor specimens
Primary GBM specimens were obtained from 95 patients who underwent surgical resection in the Southwest Hospital, Third Military Medical University (TMMU) of Chongqing and the Affiliated Provincial Hospital of Anhui Medical University of Hefei in China with written consent during the period of January 2007 and June 2014. The study was conducted with approval by the Ethics Committee of Southwestern Hospital and in accordance with the declaration of Helsinki. GBMs were reviewed using the World Health Organization (WHO) Classification of central nervous system tumor (2012). Brain tissues adjacent to tumors were used as control. Tissue sections of 5 μm were cut from formalin-fixed, paraffin-embedded representative GBM blocks and stained with hematoxylin and eosin. The quantity and distribution of VM and other features pertaining to VM were evaluated in all sections. The number of VM in 400 × fields was assessed. Clinicopathologic parameters were obtained from medical records of the patients kept at the Department of Pathology (Table S2).
Immunohistochemical staining
Tissue slices of 5 μm from 10% neutral formalin-fixed, paraffin-embedded tumors were deparafinized and hydrated through a series of xylenes and alcohols. The slices were incubated with rabbit anti-ATG5 pAb (Abcam, ab78073; dilution of 1:50), mouse anti-SQSTM1/p62 mAb (Abcam, ab56416; dilution of 1:100), rabbit anti-BECN1 mAb (Abcam, ab51031; dilution of 1:50), or anti-p-KDR/VEGFR-2 (Cell Signaling Technology, 2478; dilution of 1:500), with PBS and then incubated with avidin-biotin-peroxidase (DAKO, K5007) at room temperature for 10 min followed by visualization with 3,3′-diaminobezidine chromogen (DAKO, K5007) for 1 to 2 min. The slices were washed with running tap water for 15 min and then counterstained with hematoxylin.
ATG5, SQSTM1, BECN1 and p-KDR were considered positive by cytoplasm staining. ATG5, SQSTM1, BECN1 and p-KDR expression levels were analyzed in a semiquantitative manner using a composite score system, as measured by assessing both the percentage and intensity of stained tumor cells. The percentage of positive cells was rated per high-power field (HPF) using 400 × magnification as follows: sections with 1% positive cells were rated as 0, 1 to 25% positive cells as 1, 26 to 50% positive cells as 2, 51% to 75% positive cells as 3 and 76% to 100% positive cells as 4. The staining intensity was rated as follows: 1 for weak intensity, 2 for moderate intensity, and 3 for high intensity. Points for staining intensity and the percentage of positive cells were multiplied. Tumor specimens were classified into 3 groups according to overall scoring: negative expression as 0 to 1, weak expression as 2 to 4, and high expression as 6 to 12 points. Total scores were as follows: 0 to 4 (low) and 6 to 12 (high). All slides were evaluated independently by 2 pathologists without knowledge of the identity of patients and the clinical outcome.
Immunohistochemical and periodic acid-Schiff (PAS) double-staining
After immunohistochemical staining with mouse anti-CD34 monoclonal antibody (dilution 1:150), the slices were exposed to sodium periodate for 10 min and then rinsed with distilled water for 5 min, followed by incubating with PAS for 15 min. All slices were counterstained with hematoxylin, dehydrated, and mounted. Normal human stomach mucous membrane was used as the positive control. VM characterized as channels were lined by tumor cells without necrosis, hemorrhage, or inflammatory cells in the environment. Red blood cells were detected in CD34-/PAS + VM lumens. Under a microscope with 400 × magnification, staining for CD34 was used to evaluate microvessel density (MVD), the mean number of vessels was defined as MVD. VM channels were counted in all sections.
Xenograft
GSCs (5 × 10⁴) with pLVX-eGFP-linker-luciferase lentivirus were injected intracranially into the right frontal lobes of 4- to 6-wk old female NOD-SCID mice (Laboratory Animal Center, Southwest Hospital, Third Military Medical University, China). Twenty animals were then randomly divided into 4 groups consisting of 5 animals each. Fourteen d after injection, mice were intraperitoneally administrated with saline; twice weekly with BEV (10 mg/kg) in saline; CQ (30 mg/kg) in saline daily, and BEV in combination with CQ. Growing xenograft tumors were detected and quantified by bioluminescence imaging using an In Vivo Image System (IVIS) Spectrum (PerkinElmer, Waltham, Massachusetts, USA) and Living Image Software for IVIS at d 21 and 30 after treatment. The animal experiments were approved by the Institutional Animal Care and Use Committee of Southwest Hospital, Third Military Medical University in accordance with the Guide for the Care and Use of Laboratory Animals.
Furthermore, 42 animals were randomly divided into 7 groups consisting of 6 animals each. GSCs (5 × 10⁴) transfected with siCtrl RNA or siATG5 were injected intracranially into the NOD-SCID mice. Fourteen d after injection mice were intraperitoneally administrated with BEV (10 mg/kg) in saline. After 4 wk, tumors were collected to analyze vessel density and formation of VM.
Statistical analysis
Unless specified, all experiments were performed at least 3 times. Data are presented as the mean ± SEM (the standard error of the mean). Statistical analyses were performed using the software SPSS Statistics 17.0. Statistical significance was analyzed using the Student t test. The correlation between ATG5 expression and VM was analyzed using the Pearson χ2 test. Patient survival was analyzed by the Kaplan-Meier method. P values less than 0.05 were considered statistically significant (*P < 0.05, **P < 0.01, ***P < 0.001).
Supplementary Material
Abbreviations
- 3D scaffold
3-dimensional collagen scaffold
- ATG5
autophagy-related 5
- BECN1
Beclin 1
- BEV
bevacizumab
- CDH5
cadherin 5
- CQ
chloroquine
- EBM
endothelial cell basal medium
- EC
endothelial cell
- EGFP
enhanced green fluorescent protein
- GBM
glioblastoma multiforme
- GFAP
glial fibrillary acidic protein
- GSC
glioma stem cell
- HPF
high-power field
- LAMB2
laminin subunit β 2
- KDR/VEGFR-2
kinase insert domain receptor
- mAb
monoclonal antibody
- MAP1LC3/LC3
microtubule-associated protein 1 light chain 3
- MTOR
mechanistic target of rapamycin
- NAC
N-acetylcysteine
- OS
overall survival
- pAb
polyclonal antibody
- PAS
periodic acid-Schiff
- PFS
progression-free survival
- PI3K
phosphoinositide 3-kinase
- POU5F1
POU Class 5 Homeobox 1
- PROM1
prominin 1
- RAPA
rapamycin
- ROS
reactive oxygen species
- SEM
scanning electron microscopy
- SQSTM1
sequestosome 1
- STM
stem cell culture medium
- TUBB
tubulin β class I
- VM
vasculogenic mimicry
- VEGF
vascular endothelial growth factor
Disclosure of potential conflicts of interest
There were no potential conflicts of interest to be disclosed.
Acknowledgments
The authors thank Dr. Jian-Wu Dai (Institute of Combined Injury, State Key Laboratory of Trauma, Burns and Combined Injury, Chongqing Engineering Research Center for Nanomedicine, Department of Preventive Medicine, Third Military Medical University, Chongqing, China) for the 3-dimensional (3D) collagen scaffold and Mrs. Wei Sun and Li-Ting Wang (Central Laboratory, Third Military Medical University, Chongqing, China) for technical assistance in laser confocal scanning microscopy. The authors also thank their colleagues for helpful comments.
Funding
This study was supported by grants from the National Natural Science Foundation of China (No. 81230062, No. 81372684), the National Key Research and Development Program (No. 2016YFA0101203), and the Open Project of the Key Laboratory of Tumor Immunopathology, Ministry of Education of China, Chongqing, China (No. 2013jszl11, No. 2015jszl104). JMW was also supported in part by the Intramural Research Program of the National Cancer Institute, National Institutes of Health Contract HHSN261200800001E.
References
- [1].Das S, Marsden PA. Angiogenesis in glioblastoma. N Engl J Med 2013; 369:1561-63; PMID:24131182; https://doi.org/ 10.1056/NEJMcibr1309402 [DOI] [PMC free article] [PubMed] [Google Scholar]
- [2].Nghiemphu PL, Liu W, Lee Y, Than T, Graham C, Lai A, Green RM, Pope WB, Liau LM, Mischel PS, et al.. Bevacizumab and chemotherapy for recurrent glioblastoma: a single-institution experience. Neurology 2009; 72:1217-22; PMID:19349600; https://doi.org/ 10.1212/01.wnl.0000345668.03039.90 [DOI] [PMC free article] [PubMed] [Google Scholar]
- [3].Bergers G, Hanahan D. Modes of resistance to anti-angiogenic therapy. Nat Rev Cancer 2008; 8:592-603; PMID:18650835; https://doi.org/ 10.1038/nrc2442 [DOI] [PMC free article] [PubMed] [Google Scholar]
- [4].Ellis LM, Hicklin DJ. VEGF-targeted therapy: mechanisms of anti-tumour activity. Nat Rev Cancer 2008; 8:579-91; PMID:18596824; https://doi.org/ 10.1038/nrc2403 [DOI] [PubMed] [Google Scholar]
- [5].Verhoeff JJ, van Tellingen O, Claes A, Stalpers LJ, van Linde ME, Richel DJ, Leenders WP, van Furth WR. Concerns about anti-angiogenic treatment in patients with glioblastoma multiforme. BMC cancer 2009; 9:444; PMID:20015387; https://doi.org/ 10.1186/1471-2407-9-444 [DOI] [PMC free article] [PubMed] [Google Scholar]
- [6].Kreisl TN, Kim L, Moore K, Duic P, Rovce C, Stroud I, Garren N, Mackey M, Butman JA, Camphausen K, et al.. Phase II trial of single-agent bevacizumab followed by bevacizumab plus irinotecan at tumor progression in recurrent glioblastoma. J Clin Oncol 2009; 27:740-45; PMID:19114704; https://doi.org/ 10.1200/JCO.2008.16.3055 [DOI] [PMC free article] [PubMed] [Google Scholar]
- [7].Ebos JM, Lee CR, Cruz-Munoz W, Bjarnason GA, Christensen JG, Kerbel RS. Accelerated metastasis after short-term treatment with a potent inhibitor of tumor angiogenesis. Cancer Cell 2009; 15:232-39; PMID:19249681; https://doi.org/ 10.1016/j.ccr.2009.01.021 [DOI] [PMC free article] [PubMed] [Google Scholar]
- [8].Paez-Ribes M, Allen E, Hudock J, Takeda T, Okuyama H, Vinals F, Inoue M, Berqers G, Hanahan D, Casanovas O. Antiangiogenic therapy elicits malignant progression of tumors to increased local invasion and distant metastasis. Cancer Cell 2009; 15:220-31; PMID:19249680; https://doi.org/ 10.1016/j.ccr.2009.01.027 [DOI] [PMC free article] [PubMed] [Google Scholar]
- [9].Yue WY, Chen ZP. Does vasculogenic mimicry exist in astrocytoma? J Histochem Cytochem 2005; 53:997-1002; PMID:15923371; https://doi.org/ 10.1369/jhc.4A6521.2005 [DOI] [PubMed] [Google Scholar]
- [10].El Hallani S, Boisselier B, Peglion F, Rousseau A, Colin C, Idbaih A, Marie Y, Mokhtari K, Thomas JL, Eichmann A, et al.. A new alternative mechanism in glioblastoma vascularization: tubular vasculogenic mimicry. Brain 2010; 133:973-82; PMID:20375132; https://doi.org/ 10.1093/brain/awq044 [DOI] [PMC free article] [PubMed] [Google Scholar]
- [11].Liu XM, Zhang QP, Mu YG, Zhang XH, Sai K, Pang JC, Ng HK, Chen ZP. Clinical significance of vasculogenic mimicry in human gliomas. J Neurooncology 2011; 105:173-79; PMID:21533525; https://doi.org/ 10.1007/s11060-011-0578-5 [DOI] [PMC free article] [PubMed] [Google Scholar]
- [12].Dome B, Hendrix MJ, Paku S, Tovari J, Timar J. Alternative vascularization mechanisms in cancer: Pathology and therapeutic implications. Am J Pathol 2007; 170:1-15; PMID:17200177; https://doi.org/ 10.2353/AJPATH.2007.060302 [DOI] [PMC free article] [PubMed] [Google Scholar]
- [13].Folberg R, Hendrix MJ, Maniotis AJ. Vasculogenic mimicry and tumor angiogenesis. Am J Pathol 2000; 156:361-81; PMID:10666364; https://doi.org/ 10.1016/S0002-9440(10)64739-6 [DOI] [PMC free article] [PubMed] [Google Scholar]
- [14].Soda Y, Marumoto T, Friedmann-Morvinski D, Soda M, Liu F, Michiue H, Pastorino S, Yang M, Hoffman RM, Kesari S, et al.. Transdifferentiation of glioblastoma cells into vascular endothelial cells. Proc Natl Acad Sci U S A 2011; 108:4274-80; PMID:21262804; https://doi.org/ 10.1073/pnas.1016030108 [DOI] [PMC free article] [PubMed] [Google Scholar]
- [15].Wang R, Chadalavada K, Wilshire J, Kowalik U, Hovinga KE, Geber A, Fligelman B, Leversha M, Brennan C, Tabar V. Glioblastoma stem-like cells give rise to tumour endothelium. Nature 2010; 46:829-33; PMID:21102433; https://doi.org/ 10.1038/nature09624 [DOI] [PubMed] [Google Scholar]
- [16].Ricci-Vitiani L, Pallini R, Biffoni M, Todaro M, Invernici G, Cenci T, Maira G, Parati EA, Stassi G, Larocca LM, et al.. Tumour vascularization via endothelial differentiation of glioblastoma stem-like cells. Nature 2010; 468:824-28; PMID:21102434; https://doi.org/ 10.1038/nature09557 [DOI] [PubMed] [Google Scholar]
- [17].Roskoski R., Jr. VEGF receptor protein-tyrosine kinases: structure and regulation. Biochem Biophys Res Commun 2008; 375:287-91; PMID:18680722; https://doi.org/ 10.1016/j.bbrc.2008.07.121 [DOI] [PubMed] [Google Scholar]
- [18].Yao X, Ping Y, Liu Y, Chen K, Yoshimura T, Liu M, Gong W, Chen C, Niu Q, Guo D, et al.. Vascular endothelial growth factor receptor 2 (VEGFR-2) plays a key role in vasculogenic mimicry formation, neovascularization and tumor initiation by Glioma stem-like cells. PLoS One 2013; 8:e57188; PMID:23536763; https://doi.org/ 10.1371/journal.pone.0057188 [DOI] [PMC free article] [PubMed] [Google Scholar]
- [19].Soda Y, Myskiw C, Rommel A, Verma IM. Mechanisms of neovascularization and resistance to anti-angiogenic therapies in glioblastoma multiforme. J Mol Med(Berl) 2013; 91:439-48; PMID:23512266; https://doi.org/ 10.1007/s00109-013-1019-z [DOI] [PMC free article] [PubMed] [Google Scholar]
- [20].White E. The role for autophagy in cancer. J Clin Invest 2015; 125:42-46; PMID:25654549; https://doi.org/ 10.1172/JCI73941 [DOI] [PMC free article] [PubMed] [Google Scholar]
- [21].Degenhardt K, Mathew R, Beaudoin B, Bray K, Anderson D, Chen G, Mukherjee C, Shi Y, Gelinas C, Fan Y, et al.. Autophagy promotes tumor cell survival and restricts necrosis, inflammation, and tumorigenesis. Cancer Cell 2006; 10:51-64; PMID:16843265; https://doi.org/ 10.1016/j.ccr.2006.06.001 [DOI] [PMC free article] [PubMed] [Google Scholar]
- [22].Qiao LL, Liang N, Zhang J, Xie J, Liu F, Xu D, Yu X, Tian Y. Advanced research on vasculogenic mimicry in cancer. J Cell Mol Med 2015; 19:315-26; PMID:25598425; https://doi.org/ 10.1111/jcmm.12496 [DOI] [PMC free article] [PubMed] [Google Scholar]
- [23].Han C, Sun B, Wang W, Cai W, Lou D, Sun Y, Zhao X. Overexpression of microtubule-associated protein-1 light chain 3 is associated with melanoma metastasis and vasculogenic mimicry. Tohoku J Exp Med 2011; 223:243-51; PMID:21415575; https://doi.org/ 10.1620/tjem.223.243 [DOI] [PubMed] [Google Scholar]
- [24].Harder LM, Bunkenborg J, Andersen JS. Inducing autophagy: a comparative phosphoproteomic study of the cellular response to ammonia and rapamycin. Autophagy 2014; 10:339-55; PMID:24300666; https://doi.org/ 10.4161/auto.26863 [DOI] [PMC free article] [PubMed] [Google Scholar]
- [25].Du J, Teng RJ, Guan T, Eis A, Kaul S, Konduri GG, Shi Y. Role of autophagy in angiogenesis in aortic endothelial cells. Am J Physiol Cell Physiol 2012; 302:C383-91; PMID:22031599; https://doi.org/ 10.1152/ajpcell.00164.2011 [DOI] [PMC free article] [PubMed] [Google Scholar]
- [26].Han KL, Ren M, Wick W, Abrey L, Das A, Jin J, Reardon DA. Progression-free survival as a surrogate endpoint for overall survival in glioblastoma: a literature-based meta-analysis from 91 trials. Neuro Oncol 2014; 16:696-706; PMID:24335699; https://doi.org/ 10.1093/neuonc/not236 [DOI] [PMC free article] [PubMed] [Google Scholar]
- [27].Xu Y, Li Q, Li XY, Yang QY, Xu WW, Liu GL. Short-term anti-vascular endothelial growth factor treatment elicits vasculogenic mimicry formation of tumors to accelerate metastasis. J Exp Clin Canc Res 2012; 31:16; PMID:22357313; https://doi.org/ 10.1186/1756-9966-31-16 [DOI] [PMC free article] [PubMed] [Google Scholar]
- [28].Hu YL, DeLay M, Jahangiri A, Molinaro AM, Rose SD, Carbonell WS, Aghi MK. Hypoxia-induced autophagy promotes tumor cell survival and adaptation to antiangiogenic treatment in glioblastoma. Cancer Res 2012; 72:1773-83; PMID:22447568; https://doi.org/ 10.1158/0008-5472.CAN-11-3831 [DOI] [PMC free article] [PubMed] [Google Scholar]
- [29].Jin ZG, Ueba H, Tanimoto T, Lungu AO, Frame MD, Berk BC. Ligand-independent activation of vascular endothelial growth factor receptor 2 by fluid shear stress regulates activation of endothelial nitric oxide synthase. Circ Res 2003; 93:354-63; PMID:12893742; https://doi.org/ 10.1161/01.res.0000089257.94002.96 [DOI] [PubMed] [Google Scholar]
- [30].Francescone R, Scully S, Bentley B, Yan W, Taylor SL, Oh D, Moral L, Shao R. Glioblastoma-derived tumor cells induce vasculogenic mimicry through Flk-1 protein activation. J Biol Chem 2012; 287:24821-31; PMID:22654102; https://doi.org/ 10.1074/jbc.M111.334540 [DOI] [PMC free article] [PubMed] [Google Scholar]
- [31].Holmes K, Roberts OL, Thomas AM, Cross MJ. Vascular endothelial growth factor receptor-2: Structure, function, intracellular signalling and therapeutic inhibition. Cell Signal 2007; 19:2003-12; PMID:17658244; https://doi.org/ 10.1016/j.cellsig.2007.05.013 [DOI] [PubMed] [Google Scholar]
- [32].Ushio-Fukai M. VEGF signaling through NADPH oxidase-derived ROS. Antioxid Redox Signal 2007; 9:731-39; PMID:17511588; https://doi.org/ 10.1089/ars.2007.1556 [DOI] [PubMed] [Google Scholar]
- [33].Vartanian AA, Burova OS, Stepanova EV, Baryshnikov AY, Lichinitser MR. Melanoma vasculogenic mimicry is strongly related to reactive oxygen species level. Melanoma Res 2007; 17:370-79; PMID:17992120; https://doi.org/ 10.1097/CMR.0b013e3282f1d2ec [DOI] [PubMed] [Google Scholar]
- [34].Scherz-Shouval R, Elazar Z. Regulation of autophagy by ROS: physiology and pathology. Trends Biochem Sci 2011; 36:30-38; PMID:20728362; https://doi.org/ 10.1016/j.tibs.2010.07.007 [DOI] [PubMed] [Google Scholar]
- [35].Azad MB, Chen Y, Gibson SB. Regulation of autophagy by reactive oxygen species (ROS): implications for cancer progression and treatment. Antioxid Redox Signal 2009; 11:777-90; PMID:18828708; https://doi.org/ 10.1089/ARS.2008.2270 [DOI] [PubMed] [Google Scholar]
- [36].Navarro-Yepes J, Burns M, Anandhan A, Khalimonchuk O, del Razo LM, Quintanilla-Vega B, Pappa A, Panayiotidis MI, Franco R. Oxidative stress, redox signaling, and autophagy: cell death versus survival. Antioxid Redox Signal 2014; 21:66-85; PMID:24483238; https://doi.org/ 10.1089/ars.2014.5837 [DOI] [PMC free article] [PubMed] [Google Scholar]
- [37].Li L, Tan J, Miao Y, Lei P, Zhang Q. ROS and Autophagy: Interactions and Molecular Regulatory Mechanisms. Cell Mol Neurobiol 2015; 35:615-21; PMID:25722131; https://doi.org/ 10.1007/s10571-015-0166-x [DOI] [PubMed] [Google Scholar]
- [38].Kubota C, Torii S, Hou N, Saito N, Yoshimoto Y, Imai H, Takeuchi T. Constitutive reactive oxygen species generation from autophagosome/lysosome in neuronal oxidative toxicity. J Biol Chem 2010; 285:667-74; PMID:19850931; https://doi.org/ 10.1074/jbc.M109.053058 [DOI] [PMC free article] [PubMed] [Google Scholar]
- [39].Poillet-Perez L, Despouy G, Delage-Mourroux R, Boyer-Guittaut M. Interplay between ROS and autophagy in cancer cells, from tumor initiation to cancer therapy. Redox Biol 2015; 4:184-92; PMID:25590798; https://doi.org/ 10.1016/j.redox.2014.12.003 [DOI] [PMC free article] [PubMed] [Google Scholar]
- [40].Schnegg CI, Yang MH, Ghosh SK, Hsu MY. Induction of Vasculogenic Mimicry Overrides VEGF-A Silencing and Enriches Stem-like Cancer Cells in Melanoma. Cancer Res 2015; 75:1682-90; PMID:25769726; https://doi.org/ 10.1158/0008-5472.CAN-14-1855 [DOI] [PMC free article] [PubMed] [Google Scholar]
- [41].Hamerlik P, Lathia JD, Rasmussen R, Wu Q, Bartkova J, Lee M, Moudry P, Jr Bartek J, Fischer W, Lukas J, et al.. Autocrine VEGF-VEGFR2-Neuropilin-1 signaling promotes glioma stem-like cell viability and tumor growth. J Exp Med 2012; 209:507-20; PMID:22393126; https://doi.org/ 10.1084/jem.20111424 [DOI] [PMC free article] [PubMed] [Google Scholar]
- [42].Wang Y, Yan W, Lu X, Qian C, Zhang J, Li P, Shi L, Zhao P, Fu Z, Pu P, et al.. Overexpression of osteopontin induces angiogenesis of endothelial progenitor cells via the avβ3/PI3K/AKT/eNOS/NO signaling pathway in glioma cells. Eur J Cell Biol 2011; 90:642-8: PMID:21616556; https://doi.org/ 10.1016/j.ejcb.2011.03.005 [DOI] [PubMed] [Google Scholar]
- [43].Abid MR, Spokes KC, Shih SC, Aird WC. NADPH oxidase activity selectively modulates vascular endothelial growth factor signaling pathways. J Biol Chem 2007; 282:35373-85; PMID:17908694; https://doi.org/ 10.1074/jbc.M702175200 [DOI] [PubMed] [Google Scholar]
- [44].Brossa A, Grange C, Mancuso L, Annaratone L, Satolli MA, Mazzone M, Camussi G, Bussolati B. Sunitinib but not VEGF blockade inhibits cancer stem cell endothelial differentiation. Oncotarget 2015; 6:11295-309; PMID:25948774; https://doi.org/ 10.18632/oncotarget.3123 [DOI] [PMC free article] [PubMed] [Google Scholar]
- [45].Han J, Xiao ZF, Chen L, Chen B, Li X, Han S, Zhao Y, Dai J. Maintenance of the self-renewal properties of neural progenitor cells cultured in three-dimensional collagen scaffolds by the REDD1-mTOR signal pathway. Biomaterials 2013; 34:1921-28; PMID:23246064; https://doi.org/ 10.1016/j.biomaterials.2012.11.063 [DOI] [PubMed] [Google Scholar]
- [46].Klionsky DJ, Abdelmohsen K, Abe A, Abedin MJ, Abeliovich H, Acevedo Arozena A, et al.. Guidelines for the use and interpretation of assays for monitoring autophagy (3rd edition). Autophagy 2016; 12:1-222; PMID:26799652; https://doi.org/ 10.1080/15548627.2015.1100356 [DOI] [PMC free article] [PubMed] [Google Scholar]
- [47].Kanzawa T, Germano IM, Komata T, Ito H, Kondo Y, Kondo S. Role of autophagy in temozolomide-induced cytotoxicity for malignant glioma cells. Cell Death Differ 2004; 11:448-57; PMID:14713959; https://doi.org/ 10.1038/sj.cdd.4401359 [DOI] [PubMed] [Google Scholar]
- [48].Shi Y, Chen C, Zhang X, Liu Q, Xu JL, Zhang HR, Yao XH, Jiang T, He ZC, Ren Y, et al.. Primate-Specific miR-663 Functions as a Tumor Suppressor by Targeting PIK3CD and Predicts the Prognosis of Human Glioblastoma. Clin Cancer Res 2014; 20:1803-13; PMID:24523440; https://doi.org/ 10.1158/1078-0432.CCR-13-2284 [DOI] [PubMed] [Google Scholar]
Associated Data
This section collects any data citations, data availability statements, or supplementary materials included in this article.