Abstract
Purpose
18F-FDG-PET/CT is used to characterize many malignancies, but is not recommended for localized prostate cancer. This study explores the value of multi-parametric MRI (mpMRI) in characterizing incidental prostate 18F-FDG uptake.
Methods
Thirty-one patients who underwent 18F-FDG-PET/CT for reasons unrelated to prostate cancer and prostate mpMRI were eligible for this retrospective study. The mpMRI included T2-weighted (T2W), dynamic contrast enhancement (DCE), apparent diffusion coefficient (ADC), and MR spectroscopy (MRS) sequences. 14 patients were excluded (n=8 insufficient histopathology, n=6 radical prostatectomy before PET), and final analysis included 17 patients. A nuclear medicine physician, blinded to clinicopathologic findings, identified suspicious areas and maximum standardized uptake values (SUVmax) on 18F-FDG-PET/CT. Sector-based imaging findings were correlated with annotated histopathology from whole-mount or MRI/transrectal ultrasound fusion biopsy samples. Positive predictive values (PPVs) were estimated using generalized estimating equations with logit link. Results were evaluated with Kruskal-Wallis and Dunn’s multiple comparisons tests.
Results
The PPV of 18F-FDG-PET alone in detecting prostate cancer was 0.65. Combining 18F-FDG-PET as a base parameter with mpMRI (T2W, DCE, ADC, and MRS) increased the PPV to 0.82, 0.83, 0.83, and 0.94, respectively. All benign lesions had SUVmax<6. Malignant lesions had higher SUVmax values that correlated with Gleason scores. There was a significant difference in SUVmax per prostate between the Gleason≥4+5 and benign categories (p=0.03).
Conclusions
Focal incidental prostate 18F-FDG uptake has low clinical utility alone, but regions of uptake may harbor high-grade prostate cancer, especially if SUVmax>6. Using mpMRI to further evaluate incidental 18F-FDG uptake aids the diagnosis of prostate cancer.
Keywords: 18F-FDG PET, prostate cancer, multi-parametric MRI, incidental FDG uptake
Introduction
Positron emission tomography using fluorodeoxyglucose (18F-FDG) is widely performed to stage many types of cancer since metabolically active cancers tend to utilize the glycolytic pathway. 18F-FDG PET/CT allows cancers to be located for tumor detection, staging and treatment monitoring. While 18F-FDG PET/CT is widely used to characterize many types of cancer, current guidelines recommend against using 18F-FDG PET/CT in prostate cancer (PCa). Activity spillover from adjacent bladder and potential residual urine in prostatic urethra can complicate image evaluation. Nonetheless, many 18F-FDG PET/CT scans are performed for reasons other than prostate cancer in patients with known or suspected prostate cancer. The implications of an incidental positive 18F-FDG PET/CT in such patients are not well understood [1–4].
Gaining a better understanding of incidentally detected focal prostate 18F-FDG uptake may have clinical utility for many patients, especially considering that there were 2.3 million 18F-FDG PET/CT scans performed in 2012, with the volume expected to reach 11 million 18F-FDG PET/CT scans by 2021 in the U.S. [5]. Since 18F-FDG is the most common agent utilized for PET/CT imaging, improving the characterization of incidental focal prostatic uptake on 18F-FDG PET/CT scans performed for other indications may provide clinical benefit, particularly because prostate cancer is very common, affecting 1 in every 7 American men [6].
18F-FDG PET/CT currently plays no role in the detection of prostate cancer. A study by Jadvar et al. indicated that 18F-FDG PET/CT may serve as a biomarker in castrate-resistant metastatic PCa but its use in primary disease is rare [7]. Aiming to explore the biomarker potential of 18F-FDG PET/CT further, Bartoletti et al. examined a group of patients with normal PSA and 18F-FDG PET/CT scans performed for other reasons. The six patients in this case series were all found to have PCa, with Gleason scores ranging from 3+3 (n=1) to ≥4+3 (n=5), with one patient having Gleason 5+3 disease [8]. However, it was difficult to ascertain whether the uptake on 18F-FDG PET/CT corresponded to the tumor. In surveying our patient population we found 17 patients with 18F-FDG uptake in the prostate. These patients also had mpMRI of the prostate, and thus it was possible to correlate the uptake with histology. Therefore, this study explores the value of mpMRI in better characterizing incidentally detected focal prostate 18F-FDG uptake. The main goal of our study was to correlate focal uptake of 18F-FDG uptake in the prostate with findings from mpMRI and histopathology to better understand the significance of incidental prostate uptake.
Materials and Methods
Study Design and Patient Population
This single-institution retrospective study was approved by the local institutional review board. The study was compliant with the Health Insurance Portability and Accountability Act and informed consent was obtained from each patient, though for this type of retrospective study formal consent is not required. We searched our local picture archiving and communication system (PACS) for male patients having both prostate MRI and 18F-FDG PET/CT examinations from March 2008 to May 2013. Thirty-one patients were found to have both of these imaging studies. Inclusion criteria aside from the 18F-FDG PET/CT and multi-parametric MRI of the prostate included available MRI/transrectal ultrasound (TRUS) fusion guided biopsy and/or whole-mount prostate histopathology. Of the 31 patients, 6 were excluded for having had radical prostatectomy prior to 18F-FDG PET/CT imaging, and 8 patients were excluded for lack of sufficient histopathology data. Thus, a total of 17 patients were included in the final analysis [Figure 1].
Figure 1.
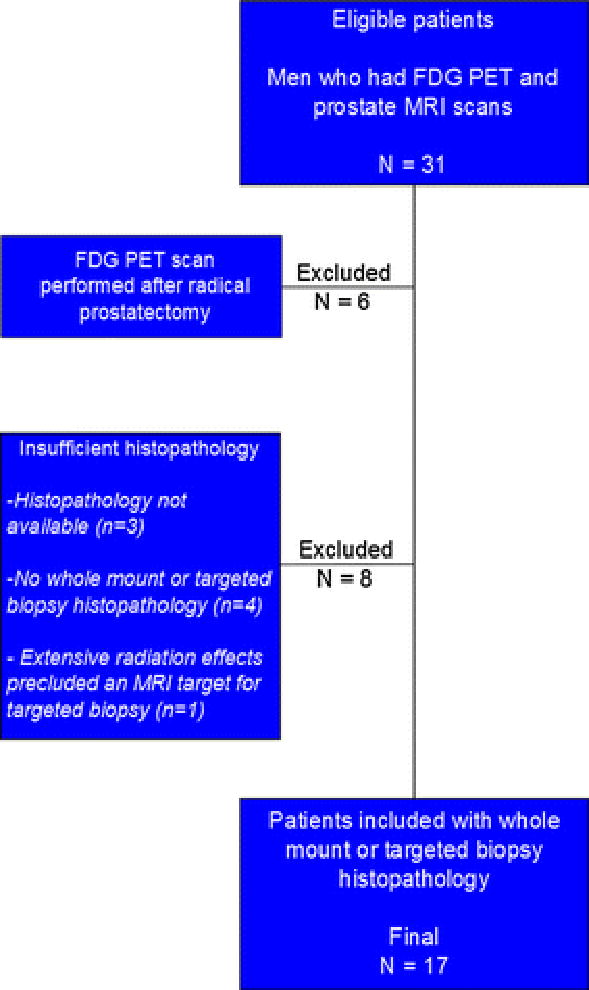
Flowchart demonstrating the inclusion criteria for this study. Seventeen patients who had 18F-FDG PET/CT scans performed with prostate glands present and who had undergone prostate MRI with subsequent targeted biopsy or whole mount histopathology available were ultimately included in the study. Six patients were excluded for having radical prostatectomy prior to 18F-FDG PET/CT exam and eight patients excluded for insufficient histopathology.
Image Acquisition
The 18F-FDG PET/CT imaging was performed using a GE Discovery ST PET/CT (General Electric Medical Systems, Milwaukee, WI, USA), and a low-dose, non-contrast CT scan (120 kVp, 60 mAs) was obtained for attenuation correction and co-registration, as described previously [9]. The indications for obtaining 18F-FDG PET/CT examinations for each patient included in the study are listed in Table 1. Six patients underwent prostate mpMRI after 18F-FDG PET/CT for metastatic workup of pheochromocytoma (n=2), lymphoma (n=2), thyroid cancer (n=1), or thymoma (n=1). The remaining 11 patients underwent prostate mpMRI before their 18F-FDG PET/CT exams.
Table 1.
Patient characteristics and indications for 18F-FDG PET/CT scans
| Pt | 18F-FDG PET/CT indication | Prostate mpMRI before or after PET? | Prostate mpMRI indication | Worst Gleason | Age (yr) | PSA (ng/mL) | Prostate volume (mL) | PSAD | SUVmax, prostate |
|---|---|---|---|---|---|---|---|---|---|
| 1 | Metastatic RCC | before | Abnormal DRE | Benign | 53 | 2.65 | 45 | 0.06 | 3.33 |
| 2 | Pheochromocytoma | after | Elevated PSA | Benign | 49 | 4.48 | 35 | 0.13 | 5.90 |
| 3 | RCC | before | Elevated PSA | Benign | 72 | 4.43 | 152 | 0.03 | 4.70 |
| 4 | Lung nodule | before | Elevated PSA | 3+3 | 56 | 13.10 | 75 | 0.17 | 4.10 |
| 5 | Mantle cell lymphoma | after | Elevated PSA and prior negative TRUS biopsy | 3+4 | 70 | 9.64 | 36 | 0.27 | 4.61 |
| 6 | Metastatic RCC | before | Elevated PSA | 3+4 | 75 | 7.50 | 54 | 0.14 | 4.96 |
| 7 | MGUS | before | Elevated PSA | 3+4 | 73 | 8.72 | 40 | 0.22 | 3.98 |
| 8 | HCC | before | Elevated PSA | 3+4 | 55 | 8.60 | 32 | 0.27 | 7.24 |
| 9 | Large cell lung cancer | before | Elevated PSA | 4+4 | 59 | 8.58 | 26 | 0.33 | 2.99 |
| 10 | Lung adenocarcinoma | before | Elevated PSA and prior negative TRUS biopsy | 4+4 | 67 | 14.10 | 32 | 0.44 | 6.25 |
| 11 | Metastatic papillary thyroid cancer | after | Incidental 18F-FDG prostate uptake | 4+4 | 61 | 2.64 | 41 | 0.06 | 25.35 |
| 12 | Follicular lymphoma | after | Elevated PSA | 4+4 | 70 | 8.28 | 38 | 0.22 | 5.63 |
| 13 | Pheochromocytoma | after | Elevated PSA | 4+4 | 72 | 14.95 | 28 | 0.53 | 7.00 |
| 14 | Metastatic workup | before | Elevated PSA and two prior negative TRUS biopsies | 4+5 | 77 | 27.10 | 57 | 0.48 | 16.85 |
| 15 | Metastatic thymoma | after | Incidental 18F-FDG prostate uptake | 4+5 | 66 | 8.53 | 33 | 0.26 | 6.64 |
| 16 | Metastatic workup | before | Elevated PSA | 5+4 | 72 | 6.90 | 45 | 0.15 | 19.31 |
| 17 | Metastatic workup | before | Elevated PSA | 5+5 | 51 | 39.64 | 60 | 0.66 | 13.91 |
| Mean | 65 | 11.17 | 49 | 0.26 | 8.40 | ||||
| Min | 49 | 2.64 | 26 | 0.03 | 2.99 | ||||
| Max | 77 | 39.64 | 152 | 0.66 | 25.35 |
Pt = patient; yr = years; PSAD = PSA density; RCC = renal cell carcinoma, MGUS = monoclonal gammopathy of undetermined significance, HCC = hepatocellular carcinoma; DRE = digital rectal exam; TRUS = transrectal ultrasound
The MRI scans were acquired using a 3.0 Tesla clinical MR scanner (Achieva 3.0T-TX, Philips Healthcare, Best, NL) with the anterior half of a 32-channel SENSE cardiac coil (Invivo, Gainesville, FL, USA) positioned over the pelvis and an endorectal coil (BPX-30, Medrad, Pittsburgh, PA, USA), as described previously [10]. The multi-parametric MRI sequences used for lesion detection included triplanar (coronal, sagittal and axial) T2-weighted (T2W), diffusion-weighted MRI (DW-MRI) and corresponding apparent diffusion coefficient (ADC) maps, multi-voxel 3-dimensional localized magnetic spectroscopy and axial 3-dimensional fast field echo dynamic contrast enhanced sequences, as previously reported [11]. The indications for obtaining the prostate mpMRI included elevated PSA (n=11), elevated PSA with prior negative 12-core systematic TRUS biopsy (n=3), abnormal digital rectal exam (n=1), and incidental 18F-FDG uptake in the prostate on PET/CT (n=2) [Table 1].
Data Analysis
FDG PET/CT
An experienced nuclear medicine physician (MLL), who was blinded to histology and clinical information, prospectively identified suspicious areas on attenuation-corrected 18F-FDG PET/CT scans. Volumes of interest were manually drawn to delineate the suspicious areas from which the maximum standardized uptake values (SUVmax) could be calculated. The SUVmax values were recorded for each focus of abnormal 18F-FDG uptake in the prostate as well as for each patient’s whole prostate.
mpMRI
The MR images were assessed for target lesions as documented in each patient’s prostate MRI report. Each of the four mpMRI parameters (T2W, DCE, ADC, and MRS) was independently scored by an experienced radiologist (BT).
18F-FDG PET/CT and mpMRI correlation with histopathology
In the initial step of imaging and histopathology correlation, mpMRI and 18F-FDG PET/CT were registered using a commercial software tool that fuses anatomic axial T2W MRI to the CT component of the 18F-FDG PET/CT scan (MIM 5.2, Cleveland, OH, USA). Then, the prostate was divided into 6 sectors (right and left at apex, mid and base portions of the prostate) on fused T2W MRI and CT images to perform sector-based analysis [Figure 2] for correlation of 18F-FDG PET/CT and mpMRI with histopathology. Each sector was analyzed with respect to the presence or absence of the 18F-FDG PET/CT positive lesions volumes of interest and the radiologist-defined mpMRI lesions. Lesion-based analysis was also performed for mpMRI and 18F-FDG PET/CT based on suspicious lesions identified on the 18F-FDG PET/CT scans. Both sector-based and lesion-based imaging findings were correlated with annotated histopathology from whole-mount prostatectomy specimens processed within patient specific MRI based customized molds [12] or MRI/TRUS fusion biopsy [10].
Figure 2.
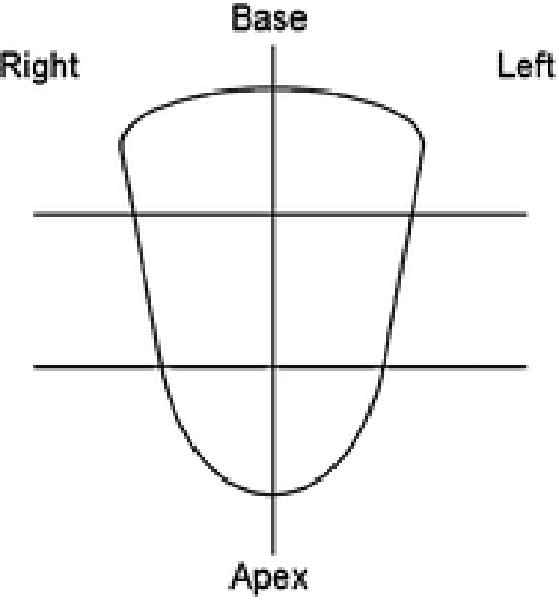
Schematic diagram of the six sectors used in the sector-based analysis for this study. Midline along with apical, mid, and base divisions were utilized to represent the prostate in six approximately equal sections.
Statistical Analysis
Generalized estimating equations (GEEs) with logit link and working independence correlation structure were used to estimate sector-based sensitivity and specificity, and lesion-based positive predictive values (PPV). Robust variance estimate and delta method were used to calculate the standard errors (SE). The Wald test was used to calculate the p-values of the pairwise differences in sensitivity, specificity, and PPV between different imaging modalities. GraphPad Prism (ver 6.01, San Diego, CA) was used to conduct the Kruskal-Wallis and Dunn’s multiple comparisons tests in comparing mean SUVmax with respect to each patient’s worst Gleason score.
Results
The seventeen patients analyzed in this study had a mean age, mean serum PSA, and mean prostate SUVmax of 65 years (range 49 – 77), 11.17 ng/mL (range 2.64 – 39.64), and 8.40 (range 2.99 – 25.35), respectively [Table 1]. The median time interval between the 18F-FDG PET/CT scan and prostate MRI scan was 48 days (range 1 day to 3.9 years, standard deviation 11.6 months). Benign lesions were found in 3 of the 17 patients (18%), consisting of primarily inflammatory changes, while the remaining 14 of 17 patients (82%) had prostate cancer lesions. An example of a patient with a prostate cancer lesion detected incidentally is shown in Figure 3. The sector-based sensitivity, specificity, PPV, and NPV of each imaging modality alone for detecting prostate cancer are shown in Table 2. All modalities except magnetic resonance spectroscopy (MRS) had higher sensitivity than specificity values. MRS had a high specificity of 0.92 while T2, ADC, and DCE had specificity values of 0.72, 0.73, and 0.74, respectively. 18F-FDG PET had the lowest specificity value of 0.52. The PPV and NPV for 18F-FDG PET were also comparatively much lower, 0.65 and 0.62, respectively.
Figure 3.
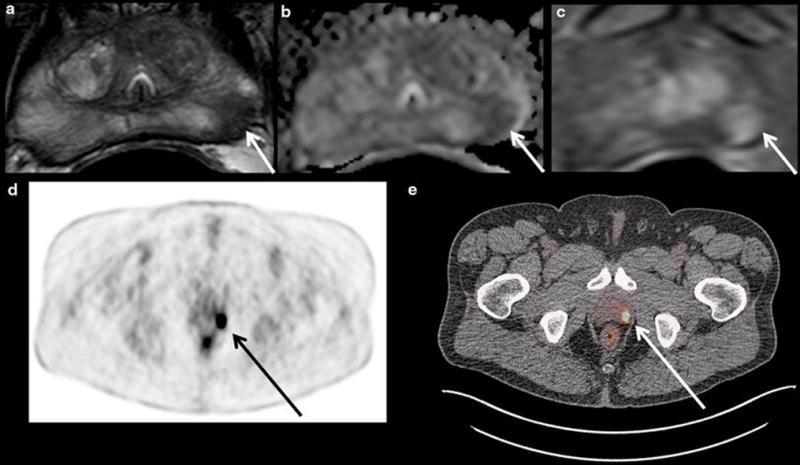
Images shown are from a 61 year old patient with serum PSA 2.64 ng/mL who underwent 18F-FDG PET/CT for staging of metastatic papillary thyroid cancer and was found to have a significant increase in metabolic activity of a left-sided prostate focus warranting further evaluation. He subsequently underwent multi-parametric MRI of the prostate, which identified a suspicious lesion in the left apical mid peripheral zone that was positive on T2W MRI (a), ADC map of DW MRI (b), and DCE MRI (c). The left apical mid peripheral zone lesion (white arrows in a-c) corresponded to the high uptake area on the 18F-FDG PET/CT scan (black arrow on the PET scan in d and white arrow on the PET/CT in e), which had an SUVmax of 25.35. This lesion corresponded to Gleason 4+4=8 prostate adenocarcinoma on MRI/ultrasound targeted biopsy and radical prostatectomy.
Table 2.
Sector-based analysis results for detection of prostate cancer using a single modality
| Estimates ± SE | T2W | ADC | DCE | MRS | FDG |
|---|---|---|---|---|---|
| Sensitivity | 0.80 ± 0.04 | 0.78 ± 0.05 | 0.75 ± 0.06 | 0.44 ± 0.12 | 0.73 ± 0.09 |
| Specificity | 0.72 ± 0.04 | 0.73 ± 0.05 | 0.74 ± 0.04 | 0.92 ± 0.05 | 0.52 ± 0.09 |
| PPV | 0.78 ± 0.07 | 0.78 ± 0.07 | 0.78 ± 0.07 | 0.87 ± 0.10 | 0.65 ± 0.09 |
| NPV | 0.75 ± 0.07 | 0.73 ± 0.08 | 0.71 ± 0.08 | 0.58 ± 0.09 | 0.62 ± 0.12 |
We observed that the sector-based PPV of 18F-FDG PET/CT alone in detecting prostate cancer was 0.65. Combining the results from the 18F-FDG PET/CT as a base parameter with each of the mpMRI modalities (T2, DCE, ADC, MRS) increased the PPV of 18F-FDG PET to 0.82, 0.83, 0.83, and 0.94, respectively [Table 3].
Table 3.
Positive Predictive Value estimates and standard error values for the sector-based analysis of multiple single imaging modalities along with combination modalities with 18F-FDG as a base parameter
| PPV | FDG | T2 | DCE | ADC | MRS | FDG+T2 | FDG+DCE | FDG+ADC | FDG+MRS |
|---|---|---|---|---|---|---|---|---|---|
| Estimate | 0.65 | 0.78 | 0.78 | 0.78 | 0.87 | 0.82 | 0.83 | 0.83 | 0.94 |
| SE | 0.09 | 0.07 | 0.07 | 0.07 | 0.10 | 0.07 | 0.07 | 0.08 | 0.07 |
The sector-based sensitivity of each imaging modality was estimated in the subgroups of patients with lower grade Gleason score (3+3 or 3+4) and higher grade Gleason score (≥4+3). These differences in sensitivity were not significant for any parameter except DCE MRI, where the sensitivity was 0.85 versus 0.61 for higher compared to lower Gleason score tumors, respectively (p=0.0496) [Figure 4]. Although it was not significant (p=0.23), the sensitivity for 18F-FDG PET was also higher for the higher grade Gleason scores, 0.82 compared to 0.61 for the lower grade Gleason score sectors.
Figure 4.
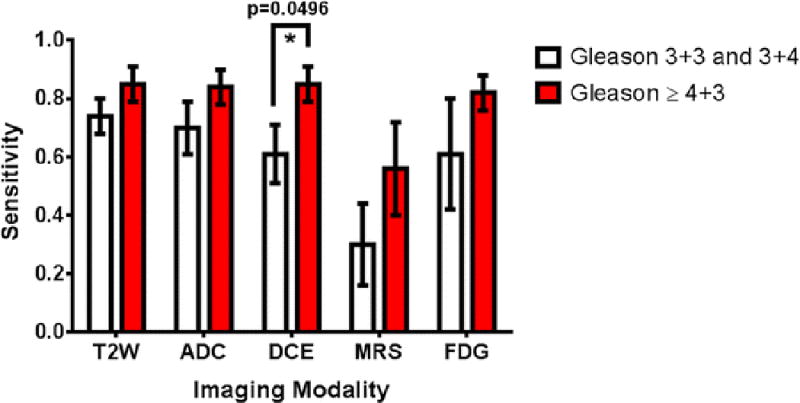
Sensitivity estimates for the use of single imaging modalities to detect prostate cancer. Results are stratified into patients with lower grade cancers (Gleason score 3+4 and below) and higher grade cancers (Gleason score greater than or equal to 4+3). The only statistically significant difference was for DCE, with sensitivity values of 0.85 ± 0.06 for detecting high Gleason score PCa compared to 0.61 ± 0.10 for lower grade cancer and a p-value of 0.0496. All other comparisons had p-values > 0.05.
The lesion-based analysis allowed for determination of PPVs for each modality and between different modalities. The results were identical for T2W MRI and ADC images. The PPV was highest for MRS, at 0.75, but also had the greatest variability, with standard error 0.16. PPV estimates and standard error values for T2W MRI, DCE MRI, and 18F-FDG PET were 0.59 ± 0.10, 0.62 ± 0.10, and 0.51 ± 0.09, respectively. The p-values of the lesion-based PPVs were not significant for any of the pairwise differences (P>0.05).
Further lesion-based analysis revealed that the mean SUVmax values were less than 6 for all benign lesions. The malignant lesions had increasingly higher mean SUVmax values that correlated with Gleason scores. Similar results were obtained for SUVmax per prostate compared to the worst Gleason score per prostate. The trend between SUVmax and worst Gleason score was not statistically significant (p=0.072). However, there was a statistically significant difference between the mean SUVmax of benign lesions and very high-grade (Gleason ≥4+5) lesions (p=0.03) [Figure 5].
Figure 5.
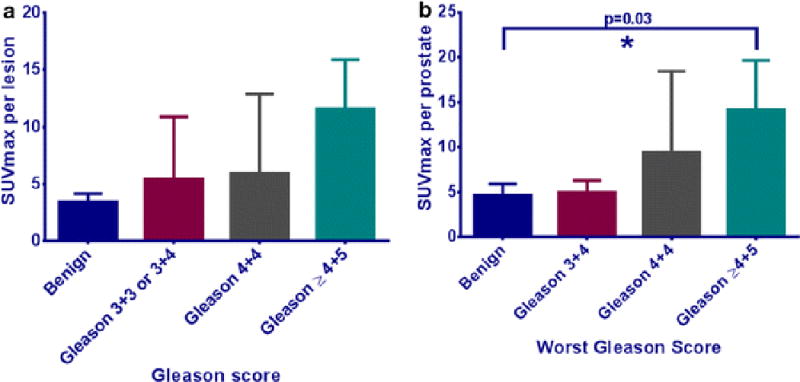
(a) Mean SUVmax and Gleason score for individual lesions, with SUVmax increasing with higher Gleason scores. (b) Mean SUVmax and worst Gleason score per prostate. The trend between SUVmax and worst Gleason score was not statistically significant on the Kruskal-Wallis test (p=0.072). The Dunn’s multiple comparison test revealed a statistically significant difference between the mean SUVmax of benign lesions and very high grade (Gleason ≥ 4+5) lesions (p=0.03).
We observed that patients’ serum PSA levels were generally higher with higher grade Gleason scores; however, this trend was not statistically significant (p=0.13), although a significant difference was found between the mean PSA values of the benign and Gleason≥4+5 categories (p=0.03). PSA density was also observed to increase with higher grade Gleason scores. While the categorical trend was non-significant (p=0.055), there were two significant differences between the benign and low-grade (Gleason 3+3 and 3+4) categories as compared to patients with worst Gleason≥4+5, with p-values of 0.027 and 0.048, respectively [Figure 6].
Figure 6.
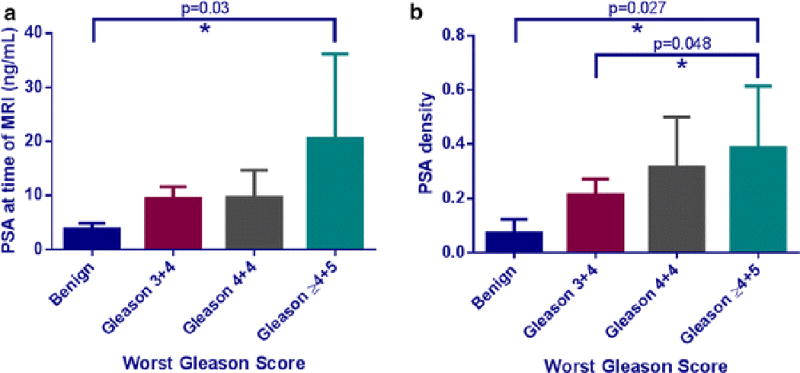
(a) Mean serum PSA obtained at the time of MRI examination compared to the worst Gleason score obtained for each patient’s prostate cancer. The trend between PSA and Gleason was not significant, with p=0.13 on the Kruskal-Wallis test. The serum PSA values of benign and Gleason ≥ 4+5 disease were found to be significantly different with p=0.03 on the Dunn’s multiple comparison test. (b) Mean serum PSA density calculated at the time of MRI based on the planimetric MRI prostate volume compared to the worst Gleason score per patient. The trend between PSA density and Gleason score approached significance (p=0.055) on the Kruskal-Wallis test and there were statistically significant differences observed between PSA density in patients with benign disease compared to both the Gleason 4+4 and Gleason ≥ 4+5 categories, with p=0.048 and p=0.027 on the Dunn’s multiple comparison tests, respectively.
Discussion
This retrospective study aimed to address the need for further evaluation of incidentally detected focal 18F-FDG uptake in the prostate in patients who have had 18F-FDG PET/CT scans performed for other reasons. Our results suggest that such patients may benefit from multi-parametric MRI (mpMRI) to improve the detection of prostate cancer and potentially reduce the uncertainty associated with focal incidental uptake of 18F-FDG within the prostate. Our results indicate that 18F-FDG PET/CT has higher sensitivity for higher Gleason score lesions compared to lower Gleason score lesions. This result was not significant likely due to the increased standard error compared to DCE MRI, which did have a significant result and similar sensitivity values. Thus, a region that shows up positively in the prostate on 18F-FDG PET/CT, even if it is found incidentally, can be clinically significant and should be further evaluated with mpMRI. Due to the overlap between SUVmax values between benign lesions and low-grade (Gleason 3+3 or 3+4) lesions, it is possible that 18F-FDG PET/CT will fail to detect lower grade Gleason score cancer. However, this may actually be a clinically useful feature since current diagnostic strategies for prostate cancer already result in overdiagnosis and overtreatment of clinically indolent cancers. It is more important that the highly malignant prostate tumors are not missed, and our results indicate promise for using mpMRI to find highly malignant lesions among areas of incidental 18F-FDG uptake in the prostate. Multi-parametric MRI of the prostate is also useful because it can be used to guide biopsies to high-risk locations in the prostate.
In a prospective study by Minamimoto et al., regions of focal 18F-FDG PET uptake (SUVmax cutoff >2.9) were biopsied under TRUS guidance, and they concluded that 18F-FDG PET/CT could potentially detect prostate cancer with 80.0% sensitivity and 87.0% PPV in cases with Gleason score ≥7. They proposed that a positive finding of 18F-FDG-PET/CT in the prostate with a PSA value ≥10.0 ng/mL may suggest that the lesion contains prostate cancer with a Gleason score of 7 or greater. Thus, they concluded that 18F-FDG-PET/CT was an accurate method of assessing a patient with a greater than intermediate risk for prostate cancer [13]. On the other hand, Hwang et al. reported their experience of incidental uptake in 120 patients, 23 of whom were diagnosed with prostate cancer via TRUS guided biopsy after depiction of the incidental uptake in the prostate. The SUVmax was higher in the cancer group (5.7 ± 5.1) than in the benign group (4.8 ± 2.7), but the difference was not statistically significant (p=0.37). Moreover, they did not identify a significant correlation between SUVmax and Gleason score (correlation coefficient 0.315, p=0.143) [2]. None of these studies included mpMRI, MRI targeted biopsy or whole mount histology correlation. We observed significant differences between benign and high-grade (Gleason≥4+5) tumors on the basis of SUVmax, PSA, and PSA density. These parameters can be used to create a diagnostic flowchart that uses SUVmax, PSA, and PSA density thresholds to categorize patients with incidentally found focal prostatic 18F-FDG uptake as having benign or malignant lesions. The important thresholds were found to be SUVmax >6 for malignant areas, and SUVmax <6 combined with either PSA density less than 0.14 or PSA less than 5 ng/mL for benign areas [Figure 7]. Based on our findings, we recommend that men with focal incidental prostatic FDG uptake are further evaluated by urologists, who can perform a digital rectal exam and determine the serum PSA. Depending on these clinical findings, a prostate mpMRI may be warranted, and can improve the characterization of the incidental FDG uptake. Naturally, these conclusions are limited by the relatively small size of this cohort.
Figure 7.
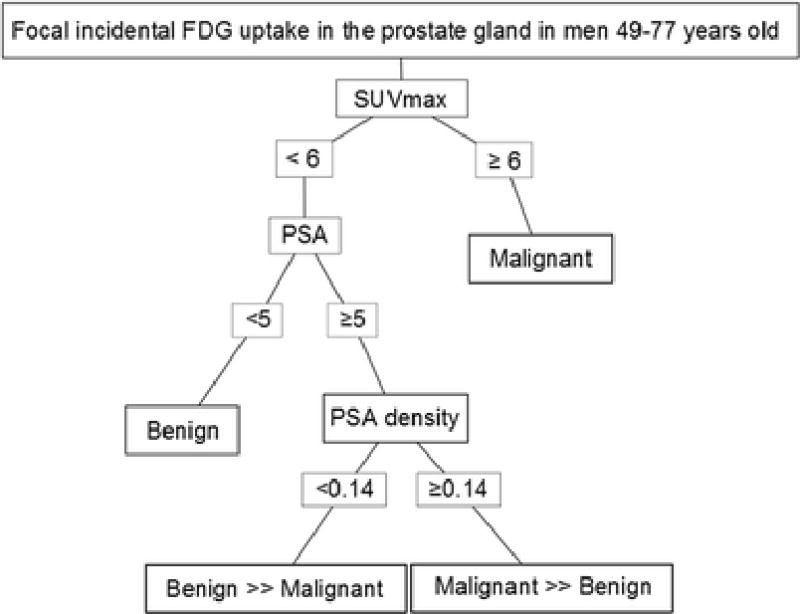
Decision flowchart for characterizing incidental 18F-FDG uptake in the prostate. Lesions with SUVmax ≥6 were all malignant. All of the benign lesions had SUVmax <6. However, there were also several malignant lesions that had SUVmax <6. Further stratification of to determine the likelihood of malignant or benign findings in each prostate could be made on the basis of PSA and PSA density. Patients who had PSA <5 ng/mL had only benign findings. Those with PSA ≥5ng/mL could be further separated into predominantly benign or malignant categories on the basis of PSA density. Patients who had PSA density <0.14 within the lower SUVmax category had predominantly benign findings. Conversely, patients with PSA density ≥0.14 had predominantly malignant findings. This flowchart may serve as a decision aide in patients with incidental 18F-FDG uptake in the prostate gland to better evaluate these lesions for malignancy.
Our study has several limitations. First, it was retrospective in nature and 18F-FDG PET/CT studies were done for the workup of several other primary malignancies but not for prostate mpMRI findings in the majority of patients. However, the uptake depicted on 18F-FDG PET/CT was not found to correspond to prostatic metastases either in biopsy or whole mount histology. Second, our study included a limited number of eligible patients. However, the sector and lesion-based analysis enabled us to perform a correlation between 18F-FDG PET/CT, mpMRI and histology. Moreover, our findings demonstrate a relatively high percentage of malignant lesions (82%) compared to other studies that reported a predominance of benign lesions in areas with incidental 18F-FDG uptake in the prostate [14]. One reason for this finding includes three patients with known prostate cancer at the time of PET imaging who were undergoing 18F-FDG PET/CT as part of a metastatic workup for another cancer. A more likely reason for the high percentage of malignant lesions found in our study is that all patients had to have undergone mpMRI scans based on a suspicion of prostate cancer. Finally, the high prevalence of prostate cancer in our patient cohort may limit the applicability of our PPV and NPV estimates to a more generalized patient population since these metrics are prevalence dependent.
In conclusion, focal incidental prostate 18F-FDG PET/CT uptake has low clinical utility alone, but areas with incidental 18F-FDG uptake may harbor high-grade prostate cancer, especially if the SUVmax value is greater than 6. Our study indicates that mpMRI of the prostate is a useful further step in evaluation after PSA and DRE following the detection of an area of incidental intra-prostatic 18F-FDG uptake, as mpMRI better characterizes suspicious areas resulting in higher positive predictive values compared to 18F-FDG PET/CT alone.
Acknowledgments
This research was made possible through the National Institutes of Health (NIH) Medical Research Scholars Program, a public-private partnership supported jointly by the NIH and generous contributions to the Foundation for the NIH from Pfizer Inc, The Doris Duke Charitable Foundation, The Newport Foundation, The American Association for Dental Research, The Howard Hughes Medical Institute, and the Colgate-Palmolive Company, as well as other private donors. For a complete list, please visit the Foundation website at: http://fnih.org/work/education-training-0/medical-research-scholars-program
References
- 1.Bhosale P, Balachandran A, Vikram R, et al. What Is the Clinical Significance of FDG Unexpected Uptake in the Prostate in Patients Undergoing PET/CT for Other Malignancies? Int J Mol Imaging. 2013;2013 doi: 10.1155/2013/476786. Article ID 476786. [DOI] [PMC free article] [PubMed] [Google Scholar]
- 2.Hwang I, Chong A, Jung SI, et al. Is further evaluation needed for incidental focal uptake in the prostate in 18-fluoro-2-deoxyglucose positron emission tomography-computed tomography images? Ann Nucl Med. 2013;27:140–145. doi: 10.1007/s12149-012-0663-7. [DOI] [PubMed] [Google Scholar]
- 3.Cho SK, Choi JY, Yoo J, et al. Incidental Focal (18)F-FDG Uptake in the Prostate: Clinical Significance and Differential Diagnostic Criteria. Nucl Med Mol Imaging. 2011;45:192–196. doi: 10.1007/s13139-011-0092-x. [DOI] [PMC free article] [PubMed] [Google Scholar]
- 4.Han EJ, HO J, Choi WH, et al. Significance of incidental focal uptake in prostate on 18-fluoro-2-deoxyglucose positron emission tomography CT images. Br J Radiol. 2010;83:915–920. doi: 10.1259/bjr/19887771. [DOI] [PMC free article] [PubMed] [Google Scholar]
- 5.BIO-TECH Report #370. The Market for PET Radiopharmaceuticals & PET Imaging. 2014 http://biotechsystems.com/reports/370/default.asp. Accessed 21 Dec 2014.
- 6.American Cancer Society. What are the key statistics about prostate cancer? 2013 http://www.cancer.org/cancer/prostatecancer/detailedguide/prostate-cancer-key-statistics. Accessed 15 Nov 2014.
- 7.Jadvar H, Desai B, Ji L, et al. Baseline 18F-FDG PET/CT parameters as imaging biomarkers of overall survival in castrate-resistant metastatic prostate cancer. J Nucl Med. 2013;54:1195–1201. doi: 10.2967/jnumed.112.114116. [DOI] [PMC free article] [PubMed] [Google Scholar]
- 8.Bartoletti R, Meliani E, Bongini A, et al. Fluorodeoxyglucose positron emission tomography may aid the diagnosis of aggressive primary prostate cancer: A case series study. Oncol Lett. 2014;7:381–386. doi: 10.3892/ol.2013.1747. [DOI] [PMC free article] [PubMed] [Google Scholar]
- 9.Mena E, Lindenberg ML, Turkbey BI, et al. A Pilot Study of the Value of 18 F-Fluoro-Deoxy-Thymidine PET/CT in Predicting Viable Lymphoma in Residual F-FDG Avid Masses After Completion of Therapy. Clin Nucl Med. 2014;39:874–881. doi: 10.1097/RLU.0000000000000539. [DOI] [PMC free article] [PubMed] [Google Scholar]
- 10.Pinto PA, Chung PH, Rastinehad AR, et al. Magnetic resonance imaging/ultrasound fusion guided prostate biopsy improves cancer detection following transrectal ultrasound biopsy and correlates with multiparametric magnetic resonance imaging. J Urol. 2011;186:1281–1285. doi: 10.1016/j.juro.2011.05.078. [DOI] [PMC free article] [PubMed] [Google Scholar]
- 11.Shakir NA, George AK, Siddiqui MM, et al. Identification of threshold prostate-specific antigen levels to optimize the detection of clinically-significant prostate cancer by MRI/US fusion guided biopsy. J Urol. 2014;192(6):1642–8. doi: 10.1016/j.juro.2014.08.002. [DOI] [PMC free article] [PubMed] [Google Scholar]
- 12.Shah V, Pohida T, Turkbey B. A method for correlating in vivo prostate magnetic resonance imaging and histopathology using individualized magnetic resonance-based molds. Rev Sci Instrum. 2009;80:1–6. doi: 10.1063/1.3242697. [DOI] [PMC free article] [PubMed] [Google Scholar]
- 13.Minamimoto R, Uemura H, Sano F, et al. The potential of FDG-PET/CT for detecting prostate cancer in patients with an elevated serum PSA level. Ann Nucl Med. 2011;25:21–27. doi: 10.1007/s12149-010-0424-4. [DOI] [PubMed] [Google Scholar]
- 14.Seino H, Ono S, Miura H, et al. Incidental prostate 18F-FDG uptake without calcification indicates the possibility of prostate cancer. Oncol Rep. 2014;31:1517–1522. doi: 10.3892/or.2014.3011. [DOI] [PMC free article] [PubMed] [Google Scholar]


