

Abstract
The primary aim of this study was to assess the potential of in vivo photoacoustic tomography for direct functional measurement of ovarian tumor response to antiangiogenic therapy.
Methods
In vivo studies were performed with institutional animal care and use committee approval. We used an orthotopic mouse model of ovarian cancer treated with trebananib (n = 9) or vehicle (n = 9). Tumor-bearing mice were randomized into trebananib or vehicle groups at day 10 and dosed on days 12, 15, and 18 after implantation. Photoacoustic tomography and blood draws were performed at day 10 and then 24 h after each drug dose. Tumors were excised for histopathology after the final studies on day 19. Data analysis to test for statistical significance was performed blinded.
Results
Blockade of angiopoietin signaling using trebananib resulted in reduced total hemoglobin–weighted photoacoustic signal (n = 9, P = 0.01) and increased oxyhemoglobin-weighted photoacoustic signal (n = 9, P < 0.01). The latter observation indicated normalization of the residual tumor vessels, which was also implied by low levels of angiopoietin 1 in serum biomarker profiling (0.76 ± 0.12 ng/mL). These noninvasive measures reflected a 30% reduction in micro-vessel density and increased vessel maturation in ex vivo sections.
Conclusion
Photoacoustic tomography is able to evaluate both vessel regression and normalization in response to trebananib. Non-invasive imaging data were supported by modulation of serum markers in vitro and ex vivo histopathology.
Keywords: photoacoustics, angiogenesis, angiopoietin, ovarian cancer
Photoacoustic tomography (PAT) is a novel molecular imaging modality that encodes the rich optical contrast of biologic tissue in an ultrasound signal, which can be detected with higher spatial resolution and penetration depth than conventional optical imaging (1). Emerging evidence suggests that PAT can assess tissue vascular function without the need for injectable contrast using the differential absorption of oxy- and deoxyhemoglobin (2–5). Moreover, PAT is a relatively low-cost imaging modality (6–8) that can be combined with existing ultrasound systems (9,10). PAT therefore holds significant potential as a future clinical tool for monitoring therapeutic response in cancer patients.
Angiogenesis is a rate-limiting step in the development and progression of cancer (11). In particular, ovarian tumors are often highly vascularized, and overexpression of angiogenic factors correlates with poor prognosis (11–14). Antiangiogenic therapy can induce heterogeneous responses in these patients, ranging from vessel normalization, which can enhance delivery of conventional chemotherapy (15), to regression, which starves the tumor of oxygen (11,16,17). Standard-of-care transvaginal ultrasound measurements of tumor size and monitoring of serum CA125 levels (18) are poor markers of response to antiangiogenic therapy (19,20); vascular parameters are better indicators (21). We therefore hypothesized that PAT would provide a sensitive and noninvasive method to assess ovarian tumor response to antiangiogenic therapy.
Trebananib is a peptibody that prevents the interaction of secreted angiopoietin 1 (Ang1) and 2 (Ang2) with the receptor tyrosine kinase Tie2 (22–24) and is currently in phase III clinical trials. In normal tissues, Ang1 typically promotes blood vessel stabilization and quiescence, whereas Ang2 stimulates angiogenesis. In tumors, the roles of Ang1 and Ang2 are complex and context dependent (16,17,25), hence noninvasive monitoring of tumor responses to trebananib has proved challenging in both the preclinical (23,26–29) and the clinical (30,31) settings. Early reports from phase III (TRINOVA 1) suggest benefits in progression free, but not overall, survival, emphasizing an unmet clinical need for imaging biomarkers that can detect functional response to therapy, direct drug dosing, improve combination therapy scheduling, and ultimately predict outcome.
The primary aim of this study was to assess the potential of noninvasive PAT imaging of tumor hemoglobin concentration and oxygenation as a direct measure of tumor response to antiangiogenic therapy with trebananib.
MATERIALS AND METHODS
Additional full protocols for animal model preparation, blood biomarker profiling, and histopathology are given in the supplemental materials (available at http://jnm.snmjournals.org).
In Vivo Model
Tumors were established in female nu/nu mice (Charles River) at 5 wk of age by orthotopic (intrabursal) injection of 5 × 10⁵ human ovarian carcinoma cells (A2780-SEAP-FL-eGFP) suspended in 10 μL of sterile phosphate-buffered saline. All procedures were approved by the institutional animal care committee. This method of ovarian tumor induction produces a primary tumor that is initially contained within the bursa and over time disseminates into the peritoneum, hence the method was considered a more accurate recapitulation of the human disease for therapy monitoring than a subcutaneous model.
Study Design
The study timeline is shown schematically in Figure 1. Bioluminescence imaging was performed on days 7, 10, and 19 to independently monitor tumor growth using the IVIS-29 system (Caliper Life Sciences). On day 10, animals were randomized by ranking the Fluc total flux signal and dividing animals alternately into 2 groups with matched average tumor burden. Drug-treated mice then received trebananib per manufacturer instructions (Amgen, Inc.; previously referred to as AMG-386 or 2×Con4(C) (23,32)) suspended in 100 μL of phosphate-buffered saline at 5.6 mg/kg, twice weekly by subcutaneous injection on the nape of the neck. Vehicle mice received an equivalent volume of phosphate-buffered saline.
FIGURE 1.
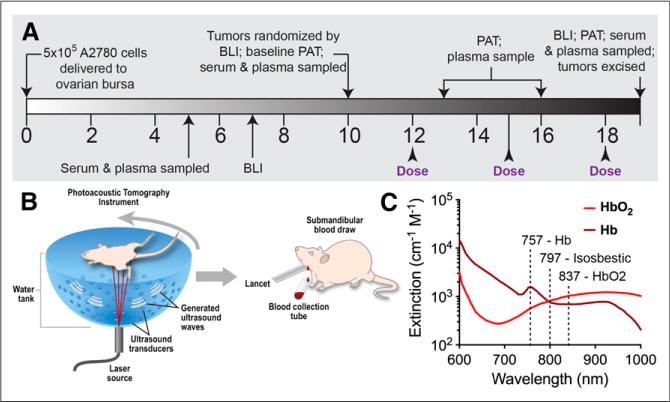
Study design for in vivo imaging and in vitro serum diagnostics. (A) Timeline of therapy response monitoring. (B) Schematic illustrating study performed. (C) Imaging at 757, 797, and 837 nm delineates HbO2 and Hb. Spectra from http://omlc.ogi.edu/spectra/index.html. BLI = bioluminescence imaging.
After baseline PAT and a blood draw of each group at day 10, we obtained PAT images and blood draws at 24 h after each trebananib dose up to completion of the study at day 19. Serum samples were assayed for systemic concentrations of mouse Ang1 (mAng1) and mouse Ang2 (mAng2), whereas plasma was assayed for the presence of the serum alkaline phosphatase (SEAP) reporter gene expressed by our tumor cells, both using standard kits.
PAT
The Nexus 128 (Endra Inc.) PAT system was used to perform the imaging. The equipment is described in the supplemental materials. Animals were anesthetized using a mixture of isoflurane and air, with levels adjusted to maintain a respiration rate of 100 breaths per minute. For each scan, the mouse was laid supine in the animal holder provided. Imaging was performed using the hemoglobin protocol, with scans acquired at wavelengths of 757, 797, and 837 nm using a continuous rotation (12-s total scan time, 240 views, 1 laser pulse per view). Indocyanine green (ICG) imaging was performed at a wavelength of 790 nm. At days 16 and 19 (24 h after the second and third drug doses), a catheter was inserted into the tail vein, and ICG (IO535 [Tokyo Chemical Industry Co., Ltd.], 80-μL bolus at 1.5 mM) was administered after the hemoglobin imaging as a surrogate perfusion marker. Three-dimensional images were reconstructed in volumes of 256 × 256 × 256 with 0.1 × 0.1 × 0.1 mm voxels using the supplied filtered backprojection algorithm (reconstruction time < 1 min).
Histologic Tumor Analysis
Tumors were excised postmortem and either fixed in 10% buffered formalin phosphate (Fisher Scientific) and paraffin-embedded or immersed in 30% sucrose for 24–48 h before being frozen on dry ice in optimal-cutting-temperature compound (4583, Tissue-Tek; Sakura Finetek USA, Inc.) and then stored at − 80°C until sectioning and staining was performed. Sectioning, staining, slide scanning, and quantitative analysis were performed in-house. Adjacent sections from paraffin-embedded tissues were cut for hematoxylin and eosin and CD31 staining. Sectioning of paraffin-embedded tissues and hematoxylin and eosin staining was performed by Histotec Laboratory. Frozen tissues were used for immunofluorescence staining of CD31 and desmin, to indicate vessel density and pericyte localization, respectively.
Image and Statistical Analysis
All data analysis, including image region drawing, was performed blinded until the final statistics were obtained. No outliers were excluded from analysis, but adequate experimental data could not be obtained in some cases (poor blood draw, low imaging signal-to-noise ratio), reducing the number of biologic replicates reported.
Region-of-interest (ROI) analysis for photoacoustic imaging was performed using 3-dimensional volumes drawn in OsiriX (Pixmeo), after the raw data were exported to DICOM format. ROIs were drawn over equivalent regions about both the tumor and the contralateral ovary. In the x (medial-lateral), y (superior-inferior), and z (anterior-posterior) directions, the region was bounded by the inferior vena cava (medial) and skin layer of the mouse (lateral), the kidneys (superior) and the line defined by the lower end of the spleen (inferior), and the superficial skin vessels (anterior) and the ovarian vessels (posterior). Examples of region drawing can be seen in Figure 2 and Supplemental Video 1. Region statistics, including minimum, maximum, mean, SD, and total photoacoustic signal, were exported from OsiriX into comma separated value format.
FIGURE 2.
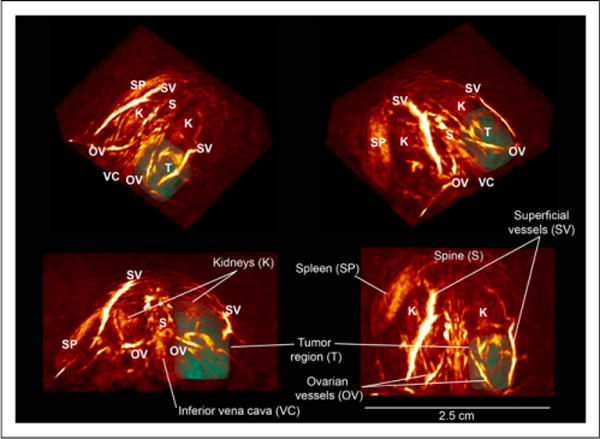
PAT images of THb-weighted signals. Three-dimensional oblique and orthogonal views at day 10 show vasculature in normal tissue and chaotic neovasculature of developing tumor. Tumor (T) is outlined using a 3-dimensional ROI. All images are on same logarithmic intensity scale.
All results in this work are expressed as mean ± SE unless otherwise stated. All experiments were repeated independently in at least 10 animals, except hematoxylin and eosin staining, which was performed in 5 animals. Statistical significance was tested with Prism (GraphPad Software) using a 2-tailed t test at the 95% confidence level (unpaired unless repeated measures) or 2-way ANOVA (comparing effects of time and treatment) using Bonferroni multiple comparisons. Correlations were tested using the nonparametric Spearman correlation and significance established by evaluating the Spearman correlation coefficient in light of the corresponding P value (P < 0.05 indicating a true, significant correlation).
RESULTS
The tumor region in photoacoustic volumes (illustrated in Fig. 2) at 797 nm (total hemoglobin [THb]) showed elevated photoacoustic signal intensity in all mice at day 10 after implantation. When individual mice were followed over time, the tumor region in vehicle-treated mice showed an increase in THb photoacoustic signal but the trebananib-treated mice remained close to the baseline (Fig. 3). Quantification of the photoacoustic signal intensity revealed a 1.5-fold increase in the THb-weighted photoacoustic signal in the vehicle-treated group (23.2 ± 2.9 to 34.7 ± 4.6 arbitrary units; n = 9, P = 0.01; Fig. 4A). No change was observed in the trebananib-treated group (23.4 ± 2.6 to 19.7 ± 2.4 arbitrary units); the difference between the 2 groups was significant (n = 9, P = 0.008). No modulation of the photoacoustic signal was seen in the contralateral region (Fig. 4A).
FIGURE 3.
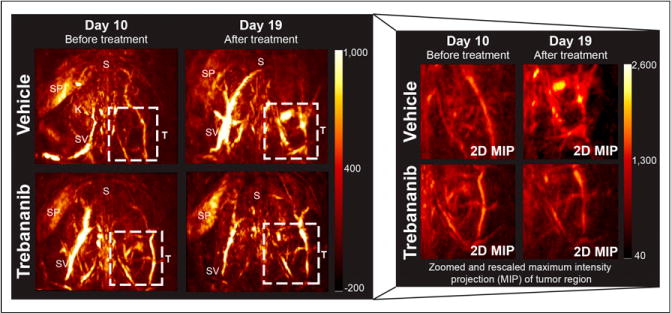
PAT displays changes in tumor vasculature induced by trebananib treatment. Both images of full mouse torso (2 × 2 cm) and zoomed 2-dimensional maximum-intensity projection (MIP) focused on tumor ROI (T) are shown. Top of images point toward head of mouse. K = kidneys; S = spine; SP = spleen; SV = superficial vessels.
FIGURE 4.
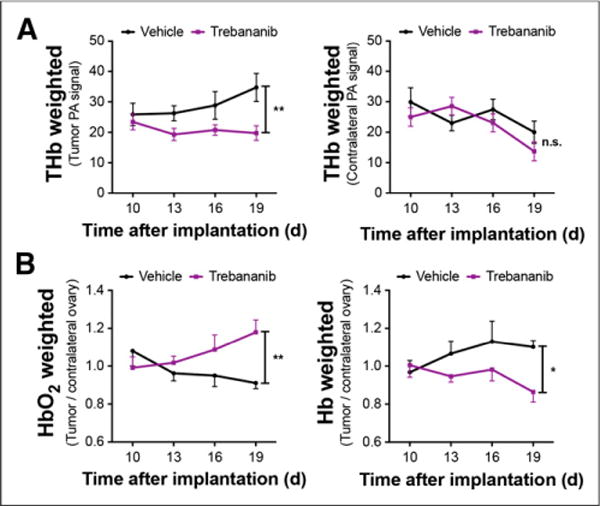
PAT detects reduced vessel density and increased HbO2 in trebananib-treated mice. (A) THb photoacoustic (PA) signal in tumor ROI is significantly elevated in vehicle- compared with trebananib-treated mice; no significant difference is observed in contralateral ROI. (B) In trebananib-treated group, HbO2-weighted signal increases significantly, whereas Hb-weighted signal decreases significantly, over same time course. *P < 0.05. **P < 0.01.
The ability to rapidly perform multiwavelength imaging within a few seconds enables several complementary parameters to be investigated in the same imaging session. PAT volumes were also acquired at 837 and 757 nm, representing tumor oxyhemoglobin (HbO2)- and deoxyhemoglobin (Hb)-weighted images. The HbO2-weighted photoacoustic signal (Fig. 4B) was significantly different between the treatment groups over the time course (n = 9, P < 0.01), increasing 20% in trebananib-treated mice and decreasing 15% in vehicle-treated mice. Conversely, the Hb-weighted photoacoustic signal (Fig. 4B; n = 9, P < 0.05) increased in vehicle-treated mice, whereas it decreased in the trebananib-treated group from 1.01 ± 0.06 to 0.86 ± 0.05. We then injected ICG, which rapidly binds to plasma proteins, intravenously after endogenous hemoglobin imaging and measured the photoacoustic signal at 790 nm. ICG influx was apparent in both groups but was 30% lower in trebananib-treated mice at day 16 (0.92 ± 0.07 vs. 1.31 ± 0.16; n = 7, P = 0.016); this trend remained at day 19 (0.97 ± 0.08 vs. 1.18 ± 0.17; n = 5, P = 0.33) but was no longer significant. Photoacoustic imaging biomarkers therefore detect a significantly lower tumor vessel density in trebananib-treated mice, compared with vehicle-treated controls, indicated by reduced THb concentration and reduced ICG influx. An improvement in vessel function was also observed, indicated by an increase in oxyhemoglobin-weighted signal in treated tumors.
To investigate the potential of serum biomarkers to detect response to trebananib, we measured the concentration of mouse (host blood vessel-derived) angiopoietin 1 (mAng1) and 2 (mAng2) in the serum (Supplemental Fig. 1). No human angiopoietins were detectable in mouse serum or in cell culture (Supplemental Table 1) so angiopoietin signal was not derived from the A2780 cell line. Serum levels of mAng1 in age-matched healthy control mice (0.60 ± 0.06 ng/mL serum) were significantly lower than either tumor-bearing group at day 10 (0.76 ± 0.12 and 0.78 ± 0.08 ng/mL serum, respectively; n = 5, P < 0.05) and were consistent over the treatment time course (0.76 ± 0.08 ng/mL serum at day 19; n = 5, P = 0.08). mAng1 levels (Fig. 5A) in the vehicle-treated group increased by 1.5-fold (n = 10, P < 0.0001) whereas the trebananib-treated group remained at baseline (n = 10, P = 0.65). The level of serum mAng1 in the trebananib-treated group was 30% lower than the vehicle-treated group at day 19 (n = 10, P = 0.03) but indistinguishable from the healthy group (n = 5, P = 0.59). Serum levels of mAng2 (Fig. 5B) were significantly lower in the healthy group (0.25 ± 0.02 ng/mL serum) than the tumor-bearing groups at day 10 (0.30 ± 0.04 and 0.34 ± 0.05 ng/mL serum, respectively; n = 5, P = 0.03). By day 19, however, the tumor-bearing groups and healthy groups were indistinguishable (n = 10, P = 0.65). Levels of circulating mAng2 were moderately correlated with mAng1 in the healthy and vehicle-treated groups (Supplemental Figs. 2A and 2B) but not in trebananib-treated mice (Supplemental Fig. 2C).
FIGURE 5.
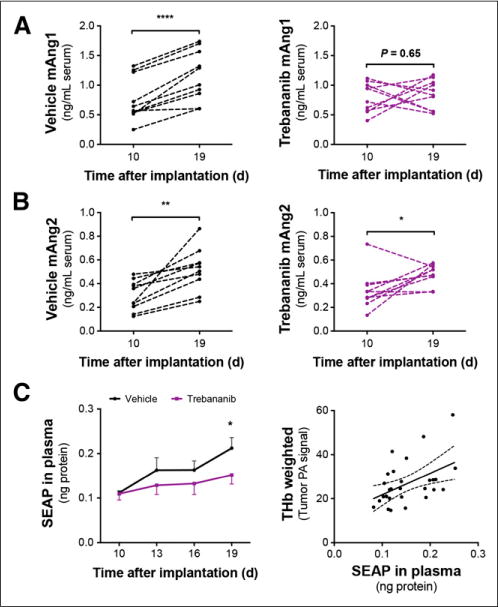
Vessel-derived mAng1 and mAng2 along with tumor cell SEAP protein secretion are modulated by tumor growth and trebananib therapy. (A) Serum concentration of mAng1 is significantly elevated by day 19 in vehicle-treated group but was maintained at baseline in trebananib-treated group. (B) mAng2 is elevated in both groups. (C) Detection of SEAP is significantly lower in trebananib-treated mice by day 19 after treatment, and plasma SEAP is correlated with THb. SEAP in plasma quoted as ng protein detected in 5 μL of isolated plasma. *P < 0.05.
As the A2780 cells used in this study are among the subset of human ovarian cancers that do not express CA125 (Supplemental Table 1) (33), they have been engineered to express the enzyme human secreted alkaline phosphatase (SEAP) as a reporter protein. Plasma SEAP correlates with viable tumor burden in early stage ovarian tumors and indicates response to cytotoxic therapy (34). SEAP levels (Fig. 5C) were significantly reduced by trebananib treatment and correlated with the THb-weighted photoacoustic signal (n = 30, Spearman r = 0.4857, P = 0.036). Because there was no correlation of SEAP levels with tumor burden in vivo, tumor mass ex vivo, or tumor necrotic area, the reduced access of the SEAP protein to the blood vasculature dominates the readout rather than an increase in tumor cell necrosis. Vascular-derived mAngl or mAng2 were not correlated with SEAP (Supplemental Figs. 2D and 2E).
Hematoxylin and eosin staining (Fig. 6) revealed a small increase in necrotic area for trebananib-treated tumors (9.9% ± 1.9% vs. 3.3% ± 0.5%, n = 5 tumors, 2 sections per tumor; P = 0.0078). The pattern of tumor cell death indicates that diffuse cellular necrosis develops in areas of vessel regression, consistent with early response to antiangiogenic therapy (35). No weight loss caused by the therapy was observed (Supplemental Fig. 3A), and neither tumor mass (Supplemental Fig. 3B; n = 14, P = 0.59) nor viable tumor burden in vivo (Supplemental Fig. 3C; n = 9, P = 0.46) were different between the vehicle and treated groups as expected in response to antiangiogenic therapy.
FIGURE 6.
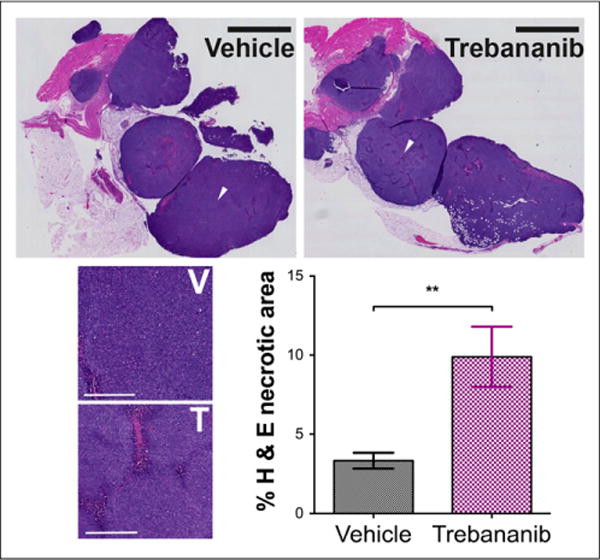
Hematoxylin and eosin (H&E) staining. Tumor cell death was more than 2-fold higher in trebananib-treated group. Scale bar was 2.5 mm whole field (black bar) and 400 urn in zoomed sections (white bar) at location of white arrows in whole field. **P < 0.01. T = trebananib; V = vehicle.
We observed that vehicle-treated tumors had a high density of immature vasculature, with poor association of desmin-positive pericytes. Immunofluorescence data clearly show that trebananib treatment results in a reduced tumor vessel density but improves pericyte association with the residual vessels (Fig. 7), validating our noninvasive measures. Quantification of the immunofluorescence images revealed that CD31-positive vessel density (Fig. 7A) was 30% lower ([5.8 ± 0.5] × 10−5 vs. [8.2 ± 0.5] × 10−5 per μm2 n = 9 biologic replicates ≥ 3 sections per tumor and ≥ 1 field per section; P = 0.0012) in trebananib-treated mice. The tumor area coverage of desmin-positive pericytes increased from 1,500 ± 300 μm2 to 2,700 ± 500 μm2 in trebananib-treated mice (n = 5 biologic replicates then as above; P = 0.023). Importantly, the CD31-positive area that overlapped with desmin-positive area was significantly higher (Fig. 7B), at 25% ± 3% versus 10% ± 1% (n = 5 biologic replicates then as above; P < 0.0001), and the CD31-positive vessel perimeter was smaller in trebananib-treated tumors (44.2 ±2.1 vs. 52.4 ± 2.8 μm, replicates as above; P = 0.03).
FIGURE 7.
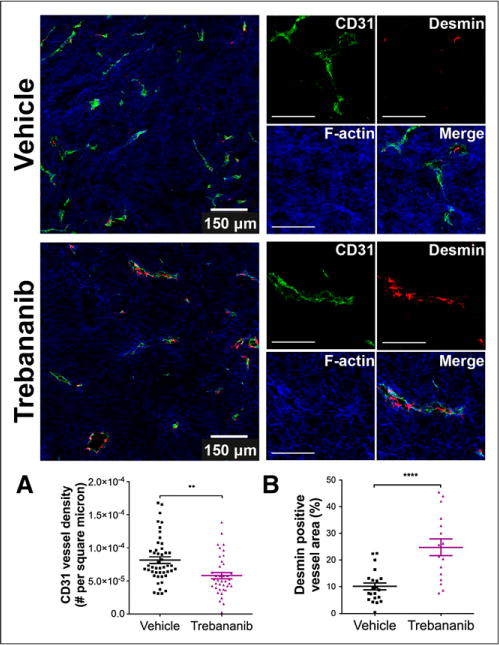
Immunofluorescence staining showed reduced density of CD31-positive tumor vasculature (green) for trebananib-treated group (A) but increased desmin-positive pericyte (red) coverage of vessels (B). Blue stain is filamentous (F-) actin. Scale bar was 150 μm in whole field, 100 μm in zoomed sections. **P < 0.01. ****P < 0.0001.
DISCUSSION
Antiangiogenic therapy holds promise for treatment of ovarian cancer; trebananib, an Ang1- and Ang2-neutralizing peptibody currently in phase III clinical trials, displays potent antiangiogenic activity and has already shown efficacy in ovarian cancer patients (31). Despite the promise of novel therapeutics, there are currently no clinically validated biomarkers of response to antiangiogenic therapy. Here, we found that in vivo PAT of intrinsic tumor hemoglobin concentration and oxygenation provides an early readout of response to trebananib in our mouse model of ovarian cancer.
Our first key finding is that trebananib-induced vessel regression can be detected noninvasively in vivo using PAT. THb-weighted images revealed significantly lower tumor vessel density in trebananib-treated tumors than vehicle-treated controls. Blockade of mAng1 and mAng2 in immature tumor vasculature has previously been shown using only ex vivo measures to prevent endothelial cell proliferation and induce vessel regression in preclinical subcutaneous models (23,32). We observed this in living subjects and also saw a reduced signal from the exogenous blood-pool contrast agent ICG in trebananib-treated tumors, which further supports the value of PAT for detecting vessel regression. Our findings were then confirmed ex vivo by reduced CD31-positive vessel density.
Our second key finding is that trebananib treatment normalizes, rather than completely prevents, mAng1 signaling in mature tumor vessels, leading to a more stable, less permeable, residual vascular architecture, as expected in a vascular normalization response (15). Evidence for vascular normalization was seen as a significant increase in HbO2-weighted photoacoustic signal in trebananib-treated tumors. Furthermore, elevated mAng1 was found in the blood circulation of vehicle-treated mice, consistent with previous work showing that excess mAng1 can promote vascular remodeling and plasticity in tumors (36,37); this was normalized in response to trebananib therapy. Reduced mAng1 signaling would lead to more functional, less tortuous tumor vessels, which was confirmed ex vivo by a significant increase in the proportion of desmin-positive tumor vessels and reduction of vessel size in immunofluorescence sections.
Measures of host serum biomarkers are clearly a pooled measure of the normal and tumor vasculature. mAng1 and mAng2 were both significantly elevated in tumor-bearing groups at day 10 compared with age-matched healthy controls, indicating that the contribution of the tumor vasculature could be detected above normal systemic levels. This suggests mAng1 and mAng2 play a role in early tumor development in this mouse model. By day 19, however, mAng2 levels were overwhelmed by systemic changes; only mAng1 remained above the normal systemic level. The lack of correlation between changes in mAng1 and mAng2 in the trebananib-treated group indicates separate processes are likely responsible for changes in each case. As serum mAng2 levels also increased in age-matched healthy controls, the systemic changes observed may be due to sexual maturation of the mice, which typically occurs at 5–6 wk of age (38) as Ang2 levels are elevated after ovulation. The influence of changes in normal biology on circulating angiopoietin levels therefore needs to be better understood before these changes can be considered as biomarkers in premenopausal women (12). In our study, however, modulation of mAng1 levels are clearly tumor derived and provide an additional confirmation of our PAT observation of vascular normalization before histology being performed. This result suggests a potentially useful combinatorial approach of in vivo imaging and in vitro serum biomarkers.
To adopt PAT as a robust tool for measuring tumor oxygenation in the clinic, our findings at the preclinical level would need to be verified in trials of clinical ovarian cancer imaging with PAT, first on ex vivo tissue specimens, and then in vivo. The present photoacoustic reconstruction does not include modeling of light delivery to account for the wavelength-dependent attenuation of incident light in tissue. This means our data provide a relative hemoglobin-, HbO2-, or Hb-weighted signal. It would be desirable to implement such modeling in a clinical imaging system to derive a quantitative hemoglobin concentration and oxygenation biomarker. Ongoing efforts in the research field are likely to make this a reality in the near future.
CONCLUSION
Our study provides quantitative proof that PAT assessment of tumor vessel density and oxygenation can be related to underlying effects of antiangiogenic therapy observed using serum biomarkers in vitro and histopathology ex vivo. This finding strongly supports the use of noninvasive PAT measures of vessel density and function to detect both vascular regression and normalization. The results from in vivo imaging and in vitro serum biomarkers were complementary, particularly in regard to detecting a vascular normalization for combination therapy, for which noninvasive biomarkers remain elusive. Importantly, both methods could be translated into the current standard of care for ovarian cancer, by combining the emerging imaging modality of PAT with existing transvaginal ultrasound and profiling for Ang1 in serum samples collected for CA125 screening. Our approach could also have broad application in other tumor types (8) to enable optimal scheduling of antiangiogenic therapy with chemotherapy or radiation therapy to yield the maximal therapeutic outcome (15).
Supplementary Material
Acknowledgments
We thank the following for helpful contributions to this work: Angela Coxon, Rick Kendall, and Jann Nichols at Amgen, Inc.; Mike Thornton and Paul Picot at Endra, Inc.; Tim Doyle at the Stanford Small Animal Imaging Facility (SCI3); as well as Andrew Olson and the Stanford Neuroscience Microscopy Service (supported by NIH NS069375). We also thank Lingyun Xu and Edwin Chang in the laboratory of Dr. Gambhir for helpful discussions regarding blood sampling, ELISA, and the animal model, respectively.
This work was funded in part by the Center for Cancer Nanotechnology Excellence and Translation, an NCI-NIH U54 grant (1 U54-CA151459), NCI Ovarian SPORE, The Canary Foundation, NCI EDRN U01, and an AACR-Amgen, Inc. Clinical/Translational Cancer Research Fellowship awarded to Dr. Bohndiek. Dr. Bohndiek also received fellowship support for this work from the AAUW (International Fellowship). Dr. Gambhir is a board member and holds equity in Endra, Inc.
Footnotes
DISCLOSURE
No other potential conflict of interest relevant to this article was reported.
References
- 1.Wang LV, Hu S. Photoacoustic tomography: in vivo imaging from organelles to organs. Science. 2012;335:1458–1462. doi: 10.1126/science.1216210. [DOI] [PMC free article] [PubMed] [Google Scholar]
- 2.Chen SL, Burnett J, Sun D, et al. Photoacoustic microscopy: a potential new tool for evaluation of angiogenesis inhibitor. Biomed Opt Express. 2013;4:2657–2666. doi: 10.1364/BOE.4.002657. [DOI] [PMC free article] [PubMed] [Google Scholar]
- 3.Laufer J, Johnson P, Zhang E, et al. In vivo preclinical photoacoustic imaging of tumor vasculature development and therapy. J Biomed Opt. 2012;17:056016. doi: 10.1117/1.JBO.17.5.056016. [DOI] [PubMed] [Google Scholar]
- 4.Rich LJ, Seshadri M. Photoacoustic imaging of vascular hemodynamics: validation with blood oxygenation level-dependent MR imaging. Radiology. 2015;275:110–118. doi: 10.1148/radiol.14140654. [DOI] [PMC free article] [PubMed] [Google Scholar]
- 5.Herzog E, Taruttis A, Beziere N, et al. Optical imaging of cancer heterogeneity with multispectral optoacoustic tomography. Radiology. 2012;263:461–468. doi: 10.1148/radiol.11111646. [DOI] [PubMed] [Google Scholar]
- 6.Kruger RA, Lam RB, Reinecke DR, et al. Photoacoustic angiography of the breast. Med Phys. 2010;37:6096–6100. doi: 10.1118/1.3497677. [DOI] [PMC free article] [PubMed] [Google Scholar]
- 7.Heijblom M, Piras D, Xia W, et al. Visualizing breast cancer using the Twente photoacoustic mammoscope: what do we learn from twelve new patient measurements? Opt Express. 2012;20:11582–11597. doi: 10.1364/OE.20.011582. [DOI] [PubMed] [Google Scholar]
- 8.Zackrisson S, van de Ven SM, Gambhir SS. Light in and sound out: emerging translational strategies for photoacoustic imaging. Cancer Res. 2014;74:979–1004. doi: 10.1158/0008-5472.CAN-13-2387. [DOI] [PMC free article] [PubMed] [Google Scholar]
- 9.Aguirre A, Ardeshirpour Y, Sanders MM, et al. Potential role of coregistered photoacoustic and ultrasound imaging in ovarian cancer detection and characterization. Transl Oncol. 2011;4:29–37. doi: 10.1593/tlo.10187. [DOI] [PMC free article] [PubMed] [Google Scholar]
- 10.Aguirre A, Guo P, Gamelin J, et al. Coregistered three-dimensional ultrasound and photoacoustic imaging system for ovarian tissue characterization. J Biomed Opt. 2009;14:054014. doi: 10.1117/1.3233916. [DOI] [PMC free article] [PubMed] [Google Scholar]
- 11.Teoh D, Secord AA. Antiangiogenic agents in combination with chemotherapy for the treatment of epithelial ovarian cancer. Int J Gynecol Cancer. 2012;22:348–359. doi: 10.1097/IGC.0b013e31823c6efd. [DOI] [PubMed] [Google Scholar]
- 12.Ramakrishnan S, Subramanian IV, Yokoyama Y, et al. Angiogenesis in normal and neoplastic ovaries. Angiogenesis. 2005;8:169–182. doi: 10.1007/s10456-005-9001-1. [DOI] [PubMed] [Google Scholar]
- 13.Taylor SE, Kirwan JM. Ovarian cancer: current management and future directions. Obstetrics, Gynaecol Reprod Med. 2009;19:130–135. [Google Scholar]
- 14.Yap TA, Carden CP, Kaye SB. Beyond chemotherapy: targeted therapies in ovarian cancer. Nat Rev Cancer. 2009;9:167–181. doi: 10.1038/nrc2583. [DOI] [PubMed] [Google Scholar]
- 15.Jain RK. Normalization of tumor vasculature: an emerging concept in antiangiogenic therapy. Science. 2005;307:58–62. doi: 10.1126/science.1104819. [DOI] [PubMed] [Google Scholar]
- 16.Augustin HG, Koh GY, Thurston G, et al. Control of vascular morphogenesis and homeostasis through the angiopoietin-Tie system. Nat Rev Mol Cell Biol. 2009;10:165–177. doi: 10.1038/nrm2639. [DOI] [PubMed] [Google Scholar]
- 17.Huang H, Bhat A, Woodnutt G, et al. Targeting the ANGPT-TIE2 pathway in malignancy. Nat Rev Cancer. 2010;10:575–585. doi: 10.1038/nrc2894. [DOI] [PubMed] [Google Scholar]
- 18.Karam AK, Karlan BY. Ovarian cancer: the duplicity of CA125 measurement. Nat Rev Clin Oncol. 2010;7:335–339. doi: 10.1038/nrclinonc.2010.44. [DOI] [PubMed] [Google Scholar]
- 19.Bohndiek SE, Brindle KM. Imaging and ‘omic’ methods for the molecular diagnosis of cancer. Expert Rev Mol Diagn. 2010;10:417–434. doi: 10.1586/erm.10.20. [DOI] [PubMed] [Google Scholar]
- 20.Therasse P, Arbuck SG, Eisenhauer EA, et al. New guidelines to evaluate the response to treatment in solid tumors. European Organization for Research and Treatment of Cancer, National Cancer Institute of the United States, National Cancer Institute of Canada. J Natl Cancer Inst. 2000;92:205–216. doi: 10.1093/jnci/92.3.205. [DOI] [PubMed] [Google Scholar]
- 21.Ehling J, Lammers T, Kiessling F. Non-Invasive imaging for studying antiangiogenic therapy effects. Thromb Haemost. 2013;109:375–390. doi: 10.1160/TH12-10-0721. [DOI] [PMC free article] [PubMed] [Google Scholar]
- 22.Maisonpierre PC, Suri C, Jones PF, et al. Angiopoietin-2, a natural antagonist for Tie2 that disrupts in vivo angiogenesis. Science. 1997;277:55–60. doi: 10.1126/science.277.5322.55. [DOI] [PubMed] [Google Scholar]
- 23.Coxon A, Bready J, Min H, et al. Context-dependent role of angiopoietin-1 inhibition in the suppression of angiogenesis and tumor growth: implications for AMG 386, an angiopoietin-1/2-neutralizing peptibody. Mol Cancer Ther. 2010;9:2641–2651. doi: 10.1158/1535-7163.MCT-10-0213. [DOI] [PMC free article] [PubMed] [Google Scholar]
- 24.Davis S, Aldrich TH, Jones PF, et al. Isolation of angiopoietin-1, a ligand for the TIE2 receptor, by secretion-trap expression cloning. Cell. 1996;87:1161–1169. doi: 10.1016/s0092-8674(00)81812-7. [DOI] [PubMed] [Google Scholar]
- 25.Azzi S, Hebda JK, Gavard J. Vascular permeability and drug delivery in cancers. Front Oncol. 2013;3:211. doi: 10.3389/fonc.2013.00211. [DOI] [PMC free article] [PubMed] [Google Scholar]
- 26.Daly C, Eichten A, Castanaro C, et al. Angiopoietin-2 functions as a Tie2 agonist in tumor models, where it limits the effects of VEGF inhibition. Cancer Res. 2013;73:108–118. doi: 10.1158/0008-5472.CAN-12-2064. [DOI] [PubMed] [Google Scholar]
- 27.Hashizume H, Falcon BL, Kuroda T, et al. Complementary actions of inhibitors of angiopoietin-2 and VEGF on tumor angiogenesis and growth. Cancer Res. 2010;70:2213–2223. doi: 10.1158/0008-5472.CAN-09-1977. [DOI] [PMC free article] [PubMed] [Google Scholar]
- 28.Nasarre P, Thomas M, Kruse K, et al. Host-derived angiopoietin-2 affects early stages of tumor development and vessel maturation but is dispensable for later stages of tumor growth. Cancer Res. 2009;69:1324–1333. doi: 10.1158/0008-5472.CAN-08-3030. [DOI] [PMC free article] [PubMed] [Google Scholar]
- 29.Oliner J, Min H, Leal J, et al. Suppression of angiogenesis and tumor growth by selective inhibition of angiopoietin-2. Cancer Cell. 2004;6:507–516. doi: 10.1016/j.ccr.2004.09.030. [DOI] [PubMed] [Google Scholar]
- 30.Herbst RS, Hong D, Chap L, et al. Safety, pharmacokinetics, and antitumor activity of AMG 386, a selective angiopoietin inhibitor, in adult patients with advanced solid tumors. J Clin Oncol. 2009;27:3557–3565. doi: 10.1200/JCO.2008.19.6683. [DOI] [PubMed] [Google Scholar]
- 31.Karlan BY, Oza AM, Richardson GE, et al. Randomized, double-blind, placebo-controlled phase II study of AMG 386 combined with weekly paclitaxel in patients with recurrent ovarian cancer. J Clin Oncol. 2012;30:362–371. doi: 10.1200/JCO.2010.34.3178. [DOI] [PubMed] [Google Scholar]
- 32.Falcôn BL, Hashizume H, Koumoutsakos P, et al. Contrasting actions of selective inhibitors of angiopoietin-1 and angiopoietin-2 on the normalization of tumor blood vessels. Am J Pathol. 2009;175:2159–2170. doi: 10.2353/ajpath.2009.090391. [DOI] [PMC free article] [PubMed] [Google Scholar]
- 33.Shaw TJ, Senterman MK, Dawson K, et al. Characterization of intraperitoneal, orthotopic, and metastatic xenograft models of human ovarian cancer. Mol Ther. 2004;10:1032–1042. doi: 10.1016/j.ymthe.2004.08.013. [DOI] [PubMed] [Google Scholar]
- 34.Nilsson EE, Westfall SD, McDonald C. Liet al. An in vivo mouse reporter gene (human secreted alkaline phosphatase) model to monitor ovarian tumor growth and response to therapeutics. Cancer Chemother Pharmacol. 2002;49:93–100. doi: 10.1007/s00280-001-0396-0. [DOI] [PubMed] [Google Scholar]
- 35.Bohndiek SE, Kettunen MI, Hu DE, Brindle KM. Hyperpolarized 13C spectroscopy detects early changes in tumor vasculature and metabolism after VEGF neutralization. Cancer Res. 2012;72:854–864. doi: 10.1158/0008-5472.CAN-11-2795. [DOI] [PMC free article] [PubMed] [Google Scholar]
- 36.Shim WS, Teh M, Bapna A, et al. Angiopoietin 1 promotes tumor angiogenesis and tumor vessel plasticity of human cervical cancer in mice. Exp Cell Res. 2002;279:299–309. doi: 10.1006/excr.2002.5597. [DOI] [PubMed] [Google Scholar]
- 37.Suri C, McClain J, Thurston G, et al. Increased vascularization in mice over-expressing angiopoietin-1. Science. 1998;282:468–471. doi: 10.1126/science.282.5388.468. [DOI] [PubMed] [Google Scholar]
- 38.Drickamer LC. Seasonal variation in litter size, bodyweight and sexual maturation in juvenile female house mice (Mus musculus) Lab Anim. 1977;11:159–162. doi: 10.1258/002367777780936639. [DOI] [PubMed] [Google Scholar]
Associated Data
This section collects any data citations, data availability statements, or supplementary materials included in this article.