

Abstract
Nanoparticle (NP) based exogenous contrast agents assist biomedical imaging by enhancing the target visibility against the background. However, it is challenging to design a single type of contrast agents that are simultaneously suitable for various imaging modalities. The simple integration of different components into a single NP contrast agent does not guarantee the optimized properties of each individual components. Herein, we describe lanthanide-based core–shell–shell (CSS) NPs as triple-modal contrast agents that have concurrently enhanced performance compared to their individual components in photoluminescence (PL) imaging, magnetic resonance imaging (MRI), and computed tomography (CT). The key to simultaneous enhancement of PL intensity, MRI r1 relaxivity, and X-ray attenuation capability in CT is tuning the interfacial layer in the CSS NP architecture. By increasing the thickness of the interfacial layer, we show that (i) PL intensity is enhanced from completely quenched/dark state to brightly emissive state of both upconversion and downshifting luminescence at different excitation wavelengths (980 and 808 nm), (ii) MRI r1 relaxivity is enhanced by 5-fold from 11.4 to 52.9 mM−1 s−1 (per Gd3+) at clinically relevant field strength 1.5 T, and (iii) the CT Hounsfield Unit gain is 70% higher than the conventional iodine-based agents at the same mass concentration. Our results demonstrate that judiciously designed contrast agents for multimodal imaging can achieve simultaneously enhanced performance compared to their individual stand-alone structures and highlight that multimodality can be achieved without compromising on individual modality performance.
Keywords: Contrast agent, lanthanide nanoparticles, epitaxy, photoluminescence imaging, magnetic resonance imaging, computed tomography
Graphical Abstract
Multimodal imaging is the next frontier in precise medical diagnosis of various diseases because it integrates the advantages of different imaging modalities while offsetting their individual limitations.1–6 In particular, photoluminescence (PL) imaging offers high detection sensitivity and multiplexing but suffers from limited penetration depth of light into tissues.1 Both magnetic resonance imaging (MRI) and computed tomography (CT) have unlimited detection depth and render three-dimensional images but suffer from moderate detection sensitivity and lack of multiplexing.3 MRI and CT are complementary because MRI lends high resolution on soft tissues while CT excels at hard tissues. Therefore, the combination of PL, MRI, and CT gives rise to medical images with high resolution, high sensitivity, and more information for medical diagnosis without limit in the detection depth of the target site.7–11
Contrast agents (CAs) are commonly used in these imaging modalities to enhance the visibility of the target site against the background.3,6,12–19 They can be engineered to accumulate specifically at the disease site, delineate the contour of it with imaging signals, and provide more accurate diagnostic information.20 In multimodal imaging, a multifunctional CA that works for different modes is preferred over the combination of singly functional ones because the separate administration of different types of CAs for various modalities increases the risk of toxicity and other side effects. Despite the potential advantages of such concepts, it remains challenging to design multimodal CAs that simultaneously facilitate PL imaging, MRI, and CT with high performance.21,22
Lanthanide (Ln) doped nanoparticles (NPs) have shown potential as multimodal imaging CAs because of their diverse yet tunable optical and magnetic properties.23–25 With the unique 4f manifold of Ln trivalent cations (Ln3+), Ln-doped NPs upon excitation emit luminescence at different wave-lengths ranging from the ultraviolet (UV) to near-infrared (NIR) regime.26–28 Along with large anti-Stokes shift, low background interference, and excellent photostability, Ln-doped NPs are superior CAs for PL imaging.29–31 Ln3+ such as Gd3+, Dy3+, and Ho3+ are potent agents to relax the water protons for MRI because they have either large number of unpaired electrons in the 4f orbitals and/or a large magnetic moment.24,32 With atomic numbers ranging from 57 to 71, Ln-doped NPs attenuate X-ray more strongly than most commercially available X-ray CT CAs (iodine-based, atomic number 53).33,34 Although the physical properties are diverse and suitable for different imaging applications, respectively, the chemical properties of all Ln ions are quite similar making it easy to incorporate several types of Ln ions into a single architecture for use as multimodal CAs.24 This offers better stability and simpler synthesis than the postsynthetic modifications typical of other multimodal CAs, i.e., coating a PL NP with gadolinium chelates or decorating fluorescent dyes on iron oxide NPs.8–11,23,24,35,36 For these reasons, multimodal imaging platforms using Ln-doped NPs as CAs—especially for combined PL, MRI, and CT imaging—have received considerable research interest.24
Despite the promise of Ln-doped NPs in multimodal imaging, it has been challenging to integrate these imaging functions rationally and optimize every modality concurrently.22 The overall performance of multimodal CAs in multimodal imaging does not equal to the simple addition of imaging functions from every single component. The Ln-based PL/CT/MRI triple-modal CAs could have weaker optical emission than the PL single-modal CAs and weaker magnetic resonance relaxivity than the MRI single-modal CAs.37–45 For example, the high-efficiency PL emission in Ln-doped NPs usually relies on the doping and sparse distribution (doping level <20%) of relatively heavy ions (Yb3+ and Er3+ or Tm3+ or Ho3+) in the host matrix composed of relatively lighter ions (NaYF4).46,47 Therefore, NPs optimized for strong PL emission would perform poorly in CT because CT requires heavier ions. In contrast, enhancing CT contrast with high concentrations of heavy Ln ions would inevitably quench the PL in most cases.
This dilemma persists in Ln-based core–shell (CS) NPs. For instance, luminescent Ln-doped core NPs are usually coated with NaGdF4 epitaxial shell making the CS NPs function as PL-MRI dual-mode CAs.48 High-efficiency PL requires thick epitaxial shells on the core NPs regardless of the core composition. When the thick shell is comprised of NaGdF4, many of the Gd3+ ions are not exposed to the NP surface, and thus not all Gd3+ ions contribute to the relaxation of water protons limiting their MRI performance.49,50 In short, it is challenging to design Ln-NP-based multimodal CAs that have improved performance than their single mode performance, without compromising on one or more modalities.
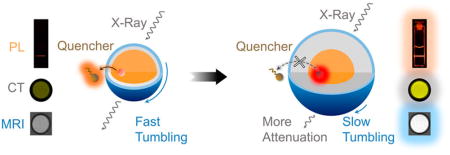
Herein, we report the design and synthesis of β-NaYb0.2/Er0.8F4@NaLuF4@NaGdF4 (Yb/Er@Lu@Gd) heteroepitaxial triple-layer core–shell–shell (CSS) NPs as triple-modal imaging CAs (Scheme 1, upper panel) to address the limitations discussed above. The key to overcoming the conundrum of simultaneously optimizing and enhancing all three modalities is to modulate the interfacial NaLuF4 layer thickness in the CSS-NP architecture (Scheme 1, lower panel). While thicker interfacial NaLuF4 layer allows heavy atoms (Lu3+) in the NP to attenuate more X-rays for enhanced CT contrast, it also acts as a thick epitaxial shell that shields all Yb3+/Er3+ luminescent centers in the core from surface quenching, therefore enhancing the PL. The thicker NaLuF4 interfacial layer is also a larger substrate to decelerate the tumbling of all paramagnetic Gd3+ centers in the outermost NaGdF4 thin layer, therefore enhancing the MRI.51–54 Importantly, we can enhance the PL further by growing thicker NaLuF4 interfacial layer without tuning the thin shell of NaGdF4. Therefore, all paramagnetic Gd3+ centers in the thin NaGdF4 layer are always fully exposed to surrounding water protons to maximize MRI relaxivity. Also, these CSS-NP structures are possible because the crystal lattice size of the NaLuF4 in the interfacial layer is smaller than that of NaYb/ErF4 in the core (Table S1) allowing favorable tensile-strained shell growth.55 Thus, thick (ca. 10 nm) and uniform (roundness close to 1) epitaxial shells can be successfully grown onto the cores, resulting in monodispersed NP architectures without structural deformation. To highlight, we show below that the structural uniformity is a critical factor to realize simultaneous enhancement of the individual modalities within a composite trimodal structure.
Scheme 1.

(a) Schematic Illustration for the β-Yb/Er@Lu@ Gd Heteroepitaxial CSS NPs and Their Use as CAs for Photoluminescence (PL) Imaging, Magnetic Resonance Imaging (MRI), and Computed Tomography (CT) and (b) Overall Performance for the CSS NPs, Which Is Poor When the Interfacial NaLuF4 Layer Is Thin Because It Allows Surface Quenching of PL, Fast Tumbling of the NP, and Attenuating Fewer X-raysa
aThe performance in three modalities is simultaneously enhanced with a thick interfacial NaLuF4 layer because it eliminates surface quenching of PL, decelerates tumbling of magnetic centers, and attenuates more X-rays.
Highly uniform Yb/Er@Lu@Gd heteroepitaxial CSS-NPs were synthesized following a previously reported self-focusing procedure.56,57 Kinetically stable α-NaLuF4 and α-NaGdF4 NPs were synthesized and used as sacrificial NPs to grow shells on the β-NaYb/ErF4 core NPs. The α-NaLuF4 NPs had an average diameter of 8.27 nm (Figure S1), while α-NaGdF4 NPs were 6.18 nm (Figure S2). After thermodynamically stable β-NaYb/ErF4 core NPs were formed, α-NaLuF4 and α-NaGdF4 NPs were injected into the β-NaYb/ErF4 core solution to form CSS-NPs (Figure S3) via Ostwald ripening (see Supporting Information for details).
To obtain the CSS-NPs shown in Figure 1a–c, ca. 9.4 mmol of α-NaLuF4 NPs and 0.96 mmol of α-NaGdF4 NPs were injected successively and ripened against 1 mmol β-NaYb/ErF4 core NPs (see Table S2 for details). The size of the NPs grew from 17.2 nm (Yb/Er core) to 36.6 nm after NaLuF4 shell growth (Yb/Er@Lu CS) and finally to 37.8 nm after NaGdF4 shell growth (Yb/Er@Lu@Gd CSS) (Figure 1d), while perfectly retaining their quasi-spherical shapes (Figures S4 and S5). Measured sizes from representative transmission electron microscopy (TEM) images (Table S3) and element analyses from inductively coupled plasma atomic emission spectroscopy (ICP-AES) (Table S4) confirmed the molar ratio of each Ln3+ in the CSS-NPs. Energy-dispersive X-ray spectroscopy (EDS) confirmed the elemental composition of the core, CS, and CSS structures (Figure S6). The very minimal shift of the peaks of CS and CSS NPs in the X-ray diffraction (XRD) pattern as compared to the core NPs confirmed that both shell layer perfectly adapted the crystal lattice of the core NPs (Figure 1e). Two critical morphological parameters—circularity and roundness—were calculated by characterizing the Feret diameters of the core, CS, and CSS-NPs, respectively. Neither circularity nor roundness changed significantly during NP growth from 17.2 to 37.8 nm, further validating the shape uniformity across all three structures (Figure S7).
Figure 1.

(a–c) TEM images of the synthesized β-NaYb/ErF4 core, β-NaYb/ErF4@NaLuF4 CS, and β-NaYb/ErF4@NaLuF4@NaGdF4 CSS NPs. Inset: high-resolution TEM images showing their lattice fringes. (d) Size distribution of the three samples measured from TEM images, respectively. (e) XRD pattern of the three samples, respectively. The black arrows show the slight shift of the peaks in the CS and CSS NPs versus core NPs toward the high angle. The vertical solid black lines are standard peak positions referenced from JCPDS file # 27-0689.
To assess the functional capabilities of these CSS-NP-based CAs, we first characterized the PL properties to validate that the epitaxial NaLuF4 shell enhances the PL of the β-NaYb/ErF4 core. For the β-NaYb/ErF4 core NPs without the shell, the high concentration of both the sensitizer and activator ions (Yb3+ 20%, and Er3+ 80% respectively) enhances the excitation energy migration to the surface57 and quenches all the possible emission pathways (Figure 2a). No detectable emission peaks for the core NPs were observed across either the visible (450–750 nm) or the NIR (750–900 nm) regime (Figure 2b) with excitation by a continuous wave diode laser at 980 nm. Our attempts to increase the excitation power density of laser from 2.5 W/cm2 to 40 W/cm2 did not result in any detectable emission from the core NPs either (Figure S8). However, after NaLuF4 epitaxial shells were grown onto the cores to form β-Yb/Er@Lu CS-NPs, the excitation energy in the cores was sequestered from surface quenching (Figure 2a), and all three major emission peaks, 540 nm (4S3/2 → 4I15/2), 654 nm (4F9/2 → 4I15/2), and 808 nm (4I9/2 → 4I15/2) were immediately recovered (Figure 2b). Unlike the Yb/Er core NPs, the PL of the CS-NPs increased 2 orders of magnitude when the 980 nm laser excitation power density was elevated from 2.5 to 40 W/cm2 (Figure S8). While we denoted the emission intensity of the completely quenched cores at 2.5 W/cm2 excitation as 1, the integrated emission intensity of the CS-NPs at the same excitation power density demonstrated an enhancement factor of PL as high as 2 × 10⁷ (Figure 2c).
Figure 2.

Photoluminescent properties of the β-NaYb/ErF4@NaLuF4 CS NPs. (a) The simplified energy level diagram of Yb3+/Er3+ showing multiple optical transitions migrate to the surface and are quenched. The upconversion PL emissions are recovered after epitaxial deposition of the NaLuF4 shell. (b) The PL spectra across the visible and NIR range of the β-NaYb/ErF4 core (orange) and β-NaYb/ErF4@NaLuF4 CS (gray) NPs, showing three major emission peaks at 540, 654, and 808 nm. (c) Comparison of absorbance (orange) at 980 nm and integrated emission intensity (gray) of β-NaYb/ErF4 core and β-NaYb/ErF4@NaLuF4 CS NPs.
The absorbance at 980 nm of both β-NaYb/ErF4 core and β-NaYb/ErF4@NaLuF4 CS NPs remains almost the same (0.088 for core and 0.089 for CS) (Figure 2c), highlighting the critical contribution of the optically inert NaLuF4 shell in enhancing the PL by shielding the luminescent centers (both sensitizers Yb3+ and activators Er3+) in the core from surface quenching. There are several other advantages in the β-NaYb/ErF4@NaLuF4 CS structures over other PL CAs. With the NaLuF4 shells, the major emission peaks are at 654 and 808 nm when excited at 980 nm. Both emission peaks are within the biological imaging window,26,58 and they function better than the dominant green emission at 540 nm seen in Yb3+(18%)/Er3+(2%) codoped NaYF4 NPs (Figure S9). Compared to the singly doped NaErF4@NaLuF4,57 the NaYb/ErF4@NaLuF4 CS NPs here have enhanced absorbance of 980 nm excitation owing to larger absorption cross-section of the sensitizer Yb3+—this results in brighter PL emission (Figure S10). With the high doping concentration of Er3+ (80%) in the core, the Yb/Er@Lu CS-NPs can also be excited at 808 nm (Figure S11 and Table S5), another biobenign wavelength in the biological imaging window. Upon 808 nm excitation, they emit at visible regime (654 nm) via upconversion and at the NIR regime (980 nm) via downshifting simultaneously (Figure S12) which cannot be easily realized in conventional systems. In short, the NaLuF4 epitaxial shell enhances the PL of the NaYb/ErF4 cores at various excitation and emission wavelengths.
Next, we explored whether MRI modality is enhanced when incorporated into the same NP structure without affecting the enhanced PL properties (Figure 3a). On depositing NaGdF4 shell the size of the NP grew from 36.6 nm (Yb/Er@Lu CS) to 37.8 nm (Yb/Er@Lu@Gd CSS), while the MRI r1 relaxivity increased from 0.1 mM−1 s−1 (Figure S13a) to 52.9 mM−1 s−1 (per Gd3+) (Figure 3b) at 1.5 T. This is the highest MRI contrast at clinical field reported to date for multimodal imaging CAs that includes an MRI modality.32 Comparing the high relaxivity reported here for the CSS NP, we emphasize that only an ultrasmall Gd3+ NP with controlled surface coating has reported higher relaxivity.59 For Yb/Er@Lu CS-NPs, an r1 value of 0.1 mM−1 s−1 is well within the detection limit, confirming that the Yb/Er@Lu CS with strong PL is silent in MRI. This is because Lu3+ does not have any unpaired electrons in the 4f orbitals but has extremely short electron spin relaxation time (10−13 s). In contrast, Gd3+ ions have seven unpaired electrons and a 105-fold longer electron spin relaxation time (10−8 s) than Lu3+ (Table S6)—both of these factors contribute to the high MRI relaxivity of Yb/Er@Lu@Gd CSS NPs compared to Yb/Er@Lu CS NPs.60
Figure 3.

MRI relaxivity of the β-NaYb/ErF4@NaLuF4@NaGdF4 CSS NPs. (a) Schematic illustration showing that the MRI-silent β-NaYb/ErF4@ NaLuF4 CS NPs gain MRI relaxivity upon deposition of a thin layer of NaGdF4. (b) Relaxivity plot of α-NaGdF4 and β-NaYb/ErF4@NaLuF4@NaGdF4 CSS NPs against Gd3+ concentration at 1.5 T. (c) Concentration-dependent phantom images of α-NaGdF4 and β-NaYb/ErF4@NaLuF4@NaGdF4 CSS NPs. (d) Comparison of NP surface areas with Gd3+ and NP tumbling time.
To study the advantage of the CSS structure in enhancing the MRI contrast, we compared the relaxivity of the sacrificial α-NaGdF4 NPs that were used to grow the NaGdF4 shell and the final CSS structures (Figure 3b). The relaxivity of the α-NaGdF4 NPs was lower than the CSS NPs at about 11.4 mM−1 s−1 (per Gd3+), while still being higher than the commercially available MRI CAs, Gd-DOTA (3.3 mM−1 s−1 per Gd3+, Figure S13b). Concentration-dependent MRI phantom images confirmed that the final Yb/Er@Lu@Gd CSS structures with a thin NaGdF4 shell had a 5-fold enhancement of MRI relaxivity (52.9 mM−1 s−1) than the sacrificial α-NaGdF4 NPs (Figure 3c). When normalized to the same Gd3+ ionic concentration (0.1 mM), the β-Yb/Er@Lu@Gd CSS-NPs with r1 of 52.9 mM−1 s−1 provided a much shorter spin–lattice relaxation time (180 ms) for water protons in the vicinity and a much higher contrast against the background than α-NaGdF4 NPs (670 ms). The enhanced MRI relaxivity allows a much lower dosage of the CAs in clinical scans. We also tested these materials in high field MRI (>3 T) as it offers improved signal-to-noise ratio compared to the clinical field (1.5 T).54,61 The CSS NP CAs exhibited an r1 value of 14.8 mM−1 s−1 at 7.0 T—the highest MRI relaxivity reported to date for contrast agents integrating multiple modalities (Figure S13c).
The relaxivity enhancement of the CSS NPs highlights three important advantages of the CSS structure for MRI as compared to the α-NaGdF4 NPs. First, for the α-NaGdF4 NPs at ~6 nm in diameter, approximately 80% of the Gd3+ ions are anchored inside the α-NaGdF4 crystal lattice 62,63 without access to the surrounding water protons (water exclusion)—this effectively excludes them from contributing to the MRI relaxivity. However, with a thickness of only 0.6 nm (Figure 1d), the NaGdF4 thin shell in a CSS-NP is likely a monolayer because the lattice size of the β-NaGdF4 is almost exactly 0.6 nm (Table S1). This suggests that all of the Gd3+ ions in the CSS NPs are directly exposed to the surrounding water molecules and contribute to water proton relaxation. Second, the surface area increased from 0.12 μm2 to 4.5 μm2 per particle for the CSS-NP relative to the smaller α-NaGdF4 NPs (Figure 3d). This facilitates one single NP CA to influence more water protons simultaneously.49,50 Third, it has been well established that slow tumbling CAs relax water protons more effectively as opposed to faster tumbling CAs.51–54 Comparing α-NaGdF4 NPs to the CSS NPs, the hydrodynamic size increased from 13 to 46 nm (Figure S14). This significantly increased the tumbling time from 0.28 to 12.7 μs (Figure 3d, see Supporting Information for calculation) and enhanced the MRI relaxivity.64 Thus, the CSS structure enables water access to all paramagnetic Gd3+ centers while simultaneously acting as a slower tumbling substrate to achieve larger relaxivity enhancement than that achievable with a stand-alone NaGdF4-based MRI CA.
Next, we studied whether the CSS structure with both strong PL and high MRI also generates high CT contrast. We expected the β-Yb/Er@Lu@Gd CSS-NP to have better X-ray attenuation capabilities than other CT CAs commonly based on iodine because of the higher atomic number of the Ln3+ ions.34 While the interfacial NaLuF4 layer in the heteroepitaxial CSS structures enhances PL emission for the NaYb/ErF4 core and MRI relaxivity for the NaGdF4 outer layer, it accounts for approximately 80% of the total mass of a single β-Yb/Er@Lu@ Gd CSS-NP. We prepared CSS-NPs in serial dilutions and compared their Hounsfield unit (HU) values to the commercially available iodine-based CT CAs (Hexabrix) at the same mass concentration (Figure 4a). The contrast of water was measured to be 3 HU, close to the defined 0 HU in most studies.33 Hexabrix (5 mg/mL) increased the contrast to 139 HU, while CSS-NPs at the same mass concentration achieved a contrast of 237 HU—a gain of nearly 70% more than Hexabrix. When the HU values of the CAs were normalized to the mass concentration of CAs (per mg/mL), the β-Yb/Er@Lu@Gd CSS-NP had a contrast of 41.7 HU/(mg/mL). In comparison, the mass concentration-normalized signal from Hexabrix was only 29.5 HU/(mg/mL) (Figure 4b). This again suggests that the same image contrast can be achieved with much lower concentrations of CAs.
Figure 4.

Comparison of image contrast between β-NaYb/ErF4@NaLuF4@NaGdF4 CSS NPs and Hexarbix in the same CT construct. (a) Concentration-dependent phantom images and (b) HU values against the concentration of the two types of CT contrast agents.
To verify that the interfacial NaLuF4 layer of the β-Yb/Er@Lu@Gd CSS-NP is critical in achieving simultaneously enhanced PL emission, MRI relaxivity, and CT contrast, we synthesized β-Yb/Er@Lu@Gd CSS-NPs with varying interfacial NaLuF4 layer thickness (Figure 5a–c). By depositing different amounts of sacrificial α-NaLuF4 NPs onto the β-NaYb/ErF4 core NPs (Table S7), we obtained CSS-NPs with the interfacial NaLuF4 layer of thicknesses at 1.0, 4.9, and 10.1 nm (Figure 5d–f). All three samples as confirmed from TEM (Figure S15) are uniform, monodispersed, and quasi-spherical (Figure S16). Next, we studied the change of PL emission, MRI relaxivity, and CT contrast of these samples as a function of NaLuF4 interfacial layer thickness. First, when the thickness of interfacial NaLuF4 increased from 1.0 to 10.1 nm, the upconversion PL was enhanced approximately 13-fold (Figure 5g and Figure S17). This increase is attributed to the improved shielding of Yb3+ and Er3+ luminescent centers from the surface by thicker NaLuF4 layers.57 Second, for the thicker NaLuF4 layer the MRI relaxivity was enhanced by the β-Yb/Er@Lu CS structures acting as the supporting substrates for outer NaGdF4 layers. Increasing the interfacial NaLuF4 layer thickness slowed the NP tumbling,52,64 thus enhancing the MRI relaxivity from 36.6 mM−1 s−1 to 51.7 mM−1 s−1 (Figure 5g and Figure S17). Finally, as the thickness of the interfacial NaLuF4 layer is increased, the mass fraction of Lu3+ in a single CSS-NP increased from 25% to 84% (Table S8 and Figure S18) enhancing the X-ray attenuation capability for CT (Figure 5g and Figure S17). These data confirm that the interfacial NaLuF4 layer is a critical component in the imaging performance of CSS-NP and that modulating the interfacial NaLuF4 layer promotes the performance of all three imaging modalities simultaneously.
Figure 5.

(a–c) TEM images of the β-NaYb/ErF4@NaLuF4@NaGdF4 CSS NPs with increasing thickness of the interfacial NaLuF4 layer (Scale bar 100 nm). Size distribution analysis of the β-NaYb/ErF4@NaLuF4@NaGdF4 CSS NPs with the thickness of the interfacial NaLuF4 layer at (d) 1.0 nm, (e) 4.9 nm, and (f) 10.1 nm. (g) Cuvette images, MRI phantom images, and CT phantom images of the β-NaYb/ErF4@NaLuF4@NaGdF4 CSS NPs with the thickness of the interfacial NaLuF4 layer at 1.0, 4.9, and 10.1 nm.
To elucidate the critical role of the interfacial layer further, we deliberately removed the interfacial NaLuF4 layer in the heteroepitaxial NP structures (Figure 6a–c) and evaluated the performance of β-NaYb/ErF4@NaGdF4 (Yb/Er@Gd) CS-NPs as multimodal CAs. Because the lattice size of NaGdF4 is larger than that of NaYb/ErF4 (Table S1), depositing a NaGdF4 shell on the NaYb/ErF4 core results in a compressive strain of the crystal lattice55 and shape deformation in the CS structure as the thickness of the NaGdF4 shell grows (Figure S19). In stark contrast to the β-Yb/Er@Lu@Gd CSS with circularity close to 1, the circularity of β-Yb/Er@Gd CS decreased to 0.57 when approximately 9 mmol NaGdF4 was deposited on the β-Yb/Er cores resulting in a nonuniform shell (Figure S20). Without the uniform and quasi-spherical CS architecture, the optically active Yb3+/Er3+ luminescent centers were more susceptible to surface quenching because of the shortened distance between them and the quenchers around the NPs;57 therefore, the PL emission intensity of β-Yb/Er@Gd CS was less than 10% of that of β-Yb/Er@Lu@Gd CSS-NPs with the same absorbance at 980 nm and excitation at the same power density (Figure 6d). While the thick NaGdF4 shell deformed the CS structures and resulted in quenching of PL, it on the other hand reintroduced the limitation on MRI by preventing most of the Gd3+ paramagnetic centers from accessing surrounding water protons. As a result, the r1 MRI relaxivity of the β-Yb/Er@ Gd CS-NPs drastically dropped from 35.9 mM−1 s−1 to 8.3 mM−1 s−1 at 1.5 T with increased thickness of the NaGdF4 layer (Figure 6e). This value is even lower than that of the α-NaGdF4 sacrificial NPs alone (11.4 mM−1 s−1). More critically, we observed that the evolving trend for the PL emission (increasing from 0.0005 to 0.28 × 10⁸ cps) and MRI relaxivity (decreasing from 35.9 mM−1 s−1 to 8.3 mM−1 s−1) was opposite when we increased the thickness of NaGdF4 without the interfacial NaLuF4 layer (Figure 6d and e). This suggests that the PL and MRI properties cannot be optimized simultaneously without the NaLuF4 interfacial layer in the CSS structures. Finally, the CT contrast of the β-Yb/Er@Gd CS was clearly lower than that of β-Yb/Er@Gd@Lu CSS-NPs because Yb, Er, and Gd all had smaller atomic numbers than Lu (Figure 6f). These results conclusively show that the interfacial NaLuF4 layer in the β-Yb/Er@Gd@Lu CSS-NPs is a critical component in simultaneously enhancing the PL emission, MRI relaxivity, and CT contrast of the CSS-NP CA.
Figure 6.

(a–c) TEM images of the β-NaYb/ErF4@NaGdF4 CS NPs with increasing thickness of the NaGdF4 layer at the absence of the interfacial NaLuF4 layer (Scale bar 100 nm). Comparison of the (d) PL, (e) MRI relaxivity, and (f) CT contrast of β-NaYb/ErF4@NaGdF4 CS NPs and β-NaYb/ErF4@NaLuF4@NaGdF4 CSS NPs (The absorbance of each sample remained the same because each sample had the same Yb/Er content, while Gd or Lu does not absorb light).
In conclusion, we report Ln heteroepitaxial CSS-NP-based multimodal imaging CAs that show simultaneously enhanced performances in PL, MRI, and CT modalities, that is higher than each individual contributing modalities alone. By carefully tuning the interfacial NaLuF4 layer in the CSS architecture, we demonstrate enhancement of both upconversion and down-shifting luminescence by a factor of 107, compared to the core only structure. We also show that the increase in interfacial layer thickness drastically reduces the NP tumbling time (0.28–12.7 μs) resulting in enhanced MRI relaxivity from 11.4 mM−1 s−1 to 52.9 mM−1 s−1 at 1.5 T. The overall composite CSS structure with the larger atomic number Lu in the interfacial shell show strong CT contrast that is 70% higher than the clinical iodine-based CT agents. The described design successfully demonstrates that the performance of each modality can in fact be enhanced in a composite structure rather than being compromised when integrated together. Such multimodal CAs should have tremendous impact on future medical diagnostics, because it allows for uncompromised integration of various imaging modalities within a single imaging probe.
Supplementary Material
Acknowledgments
The authors gratefully acknowledge the NIH (5R01EY024134-02), NIH (HL137187), NIH (HL117048), NIH (P01 AG007996), Air Force Office of Scientific Research (AFOSR) FA9550-15-1-0273 for funding. Work at the Molecular Foundry was supported by the Office of Science, Office of Basic Energy Sciences, of the U.S. Department of Energy under Contract No. DE-AC02-05CH11231. TEM work was done on UCSD Cryo-Electron Microscopy Facility which is supported by NIH grants to Dr. Timothy S. Baker and a gift from the Agouron Institute to UCSD. S.H. acknowledges the support from FISP award (C6007) and thanks Wangzhong Sheng for help with the manuscript.
ABBREVIATIONS
- NP
nanoparticle
- CA
contrast agent
- PL
photoluminescence
- MRI
magnetic resonance imaging
- CT
computed tomography
- CS
core–shell
- CSS
core–shell–shell
Footnotes
Notes
The authors declare no competing financial interest.
The Supporting Information is available free of charge on the ACS Publications website at DOI:10.1021/acs.nano-lett.7b01753.
Experimental section describing complete details of the synthesis, and characterization (PDF)
References
- 1.Kobayashi H, Longmire MR, Ogawa M, Choyke PL. Chem Soc Rev. 2011;40:4626–4648. doi: 10.1039/c1cs15077d. [DOI] [PMC free article] [PubMed] [Google Scholar]
- 2.Jokerst JV, Gambhir SS. Acc Chem Res. 2011;44:1050–1060. doi: 10.1021/ar200106e. [DOI] [PMC free article] [PubMed] [Google Scholar]
- 3.James ML, Gambhir SS. Physiol Rev. 2012;92:897–965. doi: 10.1152/physrev.00049.2010. [DOI] [PubMed] [Google Scholar]
- 4.Kircher MF, de la Zerda A, Jokerst JV, Zavaleta CL, Kempen PJ, Mittra E, Pitter K, Huang RM, Campos C, Habte F, Sinclair R, Brennan CW, Mellinghoff IK, Holland EC, Gambhir SS. Nat Med. 2012;18:829–U235. doi: 10.1038/nm.2721. [DOI] [PMC free article] [PubMed] [Google Scholar]
- 5.Huang YR, He S, Cao WP, Cai KY, Liang XJ. Nanoscale. 2012;4:6135–6149. doi: 10.1039/c2nr31715j. [DOI] [PubMed] [Google Scholar]
- 6.Smith BR, Gambhir SS. Chem Rev. 2017;117:901–986. doi: 10.1021/acs.chemrev.6b00073. [DOI] [PubMed] [Google Scholar]
- 7.Della Rocca J, Liu DM, Lin WB. Acc Chem Res. 2011;44:957–968. doi: 10.1021/ar200028a. [DOI] [PMC free article] [PubMed] [Google Scholar]
- 8.Hu DH, Sheng ZH, Zhang PF, Yang DZ, Liu SH, Gong P, Gao DY, Fang ST, Ma YF, Cai LT. Nanoscale. 2013;5:1624–1628. doi: 10.1039/c2nr33543c. [DOI] [PubMed] [Google Scholar]
- 9.Dong WJ, Li YS, Niu DC, Ma Z, Liu XH, Gu JL, Zhao WR, Zheng YY, Shi JL. Small. 2013;9:2500–2508. doi: 10.1002/smll.201202649. [DOI] [PubMed] [Google Scholar]
- 10.Xue SH, Wang Y, Wang MX, Zhang L, Du XX, Gu HC, Zhang CF. Int J Nanomed. 2014;9:2527–2538. doi: 10.2147/IJN.S59754. [DOI] [PMC free article] [PubMed] [Google Scholar]
- 11.van Schooneveld MM, Cormode DP, Koole R, van Wijngaarden JT, Calcagno C, Skajaa T, Hilhorst J, Hart DC, Fayad ZA, Mulder WJM, Meijerink A. Contrast Media Mol Imaging. 2010;5:231–236. doi: 10.1002/cmmi.376. [DOI] [PMC free article] [PubMed] [Google Scholar]
- 12.Miao QQ, Lyu Y, Ding D, Pu KY. Adv Mater. 2016;28:3662–3668. doi: 10.1002/adma.201505681. [DOI] [PubMed] [Google Scholar]
- 13.Pu KY, Shuhendler AJ, Jokerst JV, Mei JG, Gambhir SS, Bao ZN, Rao JH. Nat Nanotechnol. 2014;9:233–239. doi: 10.1038/nnano.2013.302. [DOI] [PMC free article] [PubMed] [Google Scholar]
- 14.Cai WB, Chen XY. Small. 2007;3:1840–1854. doi: 10.1002/smll.200700351. [DOI] [PubMed] [Google Scholar]
- 15.Mulder WJM, Strijkers GJ, Van Tilborg GAF, Cormode DP, Fayad ZA, Nicolay K. Acc Chem Res. 2009;42:904–914. doi: 10.1021/ar800223c. [DOI] [PMC free article] [PubMed] [Google Scholar]
- 16.Jokerst JV, Thangaraj M, Kempen PJ, Sinclair R, Gambhir SS. ACS Nano. 2012;6:5920–5930. doi: 10.1021/nn302042y. [DOI] [PMC free article] [PubMed] [Google Scholar]
- 17.Huynh E, Leung BYC, Helfield BL, Shakiba M, Gandier JA, Jin CS, Master ER, Wilson BC, Goertz DE, Zheng G. Nat Nanotechnol. 2015;10:325–332. doi: 10.1038/nnano.2015.25. [DOI] [PubMed] [Google Scholar]
- 18.Lovell JF, Jin CS, Huynh E, Jin HL, Kim C, Rubinstein JL, Chan WCW, Cao WG, Wang LV, Zheng G. Nat Mater. 2011;10:324–332. doi: 10.1038/nmat2986. [DOI] [PubMed] [Google Scholar]
- 19.Lemaster JE, Jokerst JV. Wiley Interdiscip Rev Nanomed Nanobiotechnol. 2017;9:e1404. doi: 10.1002/wnan.1404. [DOI] [PMC free article] [PubMed] [Google Scholar]
- 20.Harmsen S, Huang RM, Wall MA, Karabeber H, Samii JM, Spaliviero M, White JR, Monette S, O’Connor R, Pitter KL, Sastra SA, Saborowski M, Holland EC, Singer S, Olive KP, Lowe SW, Blasberg RG, Kircher MF. Sci Transl Med. 2015;7:11. doi: 10.1126/scitranslmed.3010633. [DOI] [PMC free article] [PubMed] [Google Scholar]
- 21.Rieffel J, Chitgupi U, Lovell JF. Small. 2015;11:4445–4461. doi: 10.1002/smll.201500735. [DOI] [PMC free article] [PubMed] [Google Scholar]
- 22.Louie AY. Chem Rev. 2010;110:3146–3195. doi: 10.1021/cr9003538. [DOI] [PMC free article] [PubMed] [Google Scholar]
- 23.Chen GY, Qiu HL, Prasad PN, Chen XY. Chem Rev. 2014;114:5161–5214. doi: 10.1021/cr400425h. [DOI] [PMC free article] [PubMed] [Google Scholar]
- 24.Dong H, Du SR, Zheng XY, Lyu GM, Sun LD, Li LD, Zhang PZ, Zhang C, Yan CH. Chem Rev. 2015;115:10725–10815. doi: 10.1021/acs.chemrev.5b00091. [DOI] [PubMed] [Google Scholar]
- 25.Park YI, Lee KT, Suh YD, Hyeon T. Chem Soc Rev. 2015;44:1302–1317. doi: 10.1039/c4cs00173g. [DOI] [PubMed] [Google Scholar]
- 26.Weissleder R. Nat Biotechnol. 2001;19:316–317. doi: 10.1038/86684. [DOI] [PubMed] [Google Scholar]
- 27.Cheng L, Yang K, Zhang S, Shao MW, Lee ST, Liu Z. Nano Res. 2010;3:722–732. [Google Scholar]
- 28.Liu YS, Tu DT, Zhu HM, Chen XY. Chem Soc Rev. 2013;42:6924–6958. doi: 10.1039/c3cs60060b. [DOI] [PubMed] [Google Scholar]
- 29.Wang F, Banerjee D, Liu YS, Chen XY, Liu XG. Analyst. 2010;135:1839–1854. doi: 10.1039/c0an00144a. [DOI] [PubMed] [Google Scholar]
- 30.Zhou J, Liu Z, Li FY. Chem Soc Rev. 2012;41:1323–1349. doi: 10.1039/c1cs15187h. [DOI] [PubMed] [Google Scholar]
- 31.Naczynski DJ, Sun C, Turkcan S, Jenkins C, Koh AL, Ikeda D, Pratx G, Xing L. Nano Lett. 2015;15:96–102. doi: 10.1021/nl504123r. [DOI] [PMC free article] [PubMed] [Google Scholar]
- 32.Bottrill M, Kwok L, Long NJ. Chem Soc Rev. 2006;35:557–571. doi: 10.1039/b516376p. [DOI] [PubMed] [Google Scholar]
- 33.Lusic H, Grinstaff MW. Chem Rev. 2013;113:1641–1666. doi: 10.1021/cr200358s. [DOI] [PMC free article] [PubMed] [Google Scholar]
- 34.Lee N, Choi SH, Hyeon T. Adv Mater. 2013;25:2641–2660. doi: 10.1002/adma.201300081. [DOI] [PubMed] [Google Scholar]
- 35.Alric C, Taleb J, Le Duc G, Mandon C, Billotey C, Le Meur-Herland A, Brochard T, Vocanson F, Janier M, Perriat P, Roux S, Tillement O. J Am Chem Soc. 2008;130:5908–5915. doi: 10.1021/ja078176p. [DOI] [PubMed] [Google Scholar]
- 36.Liu XL, Jiang H, Ye J, Zhao CQ, Gao SP, Wu CY, Li CH, Li JC, Wang XM. Adv Funct Mater. 2016;26:8694–8706. [Google Scholar]
- 37.Shen JW, Yang CX, Dong LX, Sun HR, Gao K, Yan XP. Anal Chem. 2013;85:12166–12172. doi: 10.1021/ac403486r. [DOI] [PubMed] [Google Scholar]
- 38.Tian G, Yin WY, Jin JJ, Zhang X, Xing GM, Li SJ, Gu ZJ, Zhao YL. J Mater Chem B. 2014;2:1379–1389. doi: 10.1039/c3tb21394c. [DOI] [PubMed] [Google Scholar]
- 39.Xia A, Chen M, Gao Y, Wu DM, Feng W, Li FY. Biomaterials. 2012;33:5394–5405. doi: 10.1016/j.biomaterials.2012.04.025. [DOI] [PubMed] [Google Scholar]
- 40.Wang L, Liu JH, Dai YL, Yang Q, Zhang YX, Yang PP, Cheng ZY, Lian HZ, Li CX, Hou ZY, Ma PA, Lin J. Langmuir. 2014;30:13042–13051. doi: 10.1021/la503444g. [DOI] [PubMed] [Google Scholar]
- 41.Zhou J, Lu ZG, Shan GG, Wang SH, Liao Y. Biomaterials. 2014;35:368–377. doi: 10.1016/j.biomaterials.2013.09.088. [DOI] [PubMed] [Google Scholar]
- 42.Yang DM, Dai YL, Liu JH, Zhou Y, Chen YY, Li CX, Ma PA, Lin J. Biomaterials. 2014;35:2011–2023. doi: 10.1016/j.biomaterials.2013.11.018. [DOI] [PubMed] [Google Scholar]
- 43.González-Béjar M, Francés-Soriano L, Pérez-Prieto J. Front Bioeng Biotechnol. 2016;4:47. doi: 10.3389/fbioe.2016.00047. [DOI] [PMC free article] [PubMed] [Google Scholar]
- 44.Ni DL, Bu WB, Zhang SJ, Zheng XP, Li M, Xing HY, Xiao QF, Liu YY, Hua YQ, Zhou LP, Peng WJ, Zhao KL, Shi JL. Adv Funct Mater. 2014;24:6613–6620. [Google Scholar]
- 45.Li Y, Gu YY, Yuan W, Cao TY, Li K, Yang SP, Zhou ZG, Li FY. ACS Appl Mater Interfaces. 2016;8:19208–19216. doi: 10.1021/acsami.6b02856. [DOI] [PubMed] [Google Scholar]
- 46.Zhao JB, Jin DY, Schartner EP, Lu YQ, Liu YJ, Zvyagin AV, Zhang LX, Dawes JM, Xi P, Piper JA, Goldys EM, Monro TM. Nat Nanotechnol. 2013;8:729–734. doi: 10.1038/nnano.2013.171. [DOI] [PubMed] [Google Scholar]
- 47.Han SY, Deng RR, Xie XJ, Liu XG. Angew Chem, Int Ed. 2014;53:11702–11715. doi: 10.1002/anie.201403408. [DOI] [PubMed] [Google Scholar]
- 48.Liu CY, Gao ZY, Zeng JF, Hou Y, Fang F, Li YL, Qiao RR, Shen L, Lei H, Yang WS, Gao MY. ACS Nano. 2013;7:7227–7240. doi: 10.1021/nn4030898. [DOI] [PubMed] [Google Scholar]
- 49.Chen F, Bu WB, Zhang SJ, Liu XH, Liu JN, Xing HY, Xiao QF, Zhou LP, Peng WJ, Wang LZ, Shi JL. Adv Funct Mater. 2011;21:4285–4294. [Google Scholar]
- 50.Johnson NJJ, Oakden W, Stanisz GJ, Prosser RS, van Veggel F. Chem Mater. 2011;23:3714–3722. [Google Scholar]
- 51.Cormode DP, Sanchez-Gaytan BL, Mieszawska AJ, Fayad ZA, Mulder WJM. NMR Biomed. 2013;26:766–780. doi: 10.1002/nbm.2909. [DOI] [PMC free article] [PubMed] [Google Scholar]
- 52.Werner EJ, Datta A, Jocher CJ, Raymond KN. Angew Chem, Int Ed. 2008;47:8568–8580. doi: 10.1002/anie.200800212. [DOI] [PubMed] [Google Scholar]
- 53.Song Y, Xu XY, MacRenaris KW, Zhang XQ, Mirkin CA, Meade TJ. Angew Chem, Int Ed. 2009;48:9143–9147. doi: 10.1002/anie.200904666. [DOI] [PMC free article] [PubMed] [Google Scholar]
- 54.Caravan P. Chem Soc Rev. 2006;35:512–523. doi: 10.1039/b510982p. [DOI] [PubMed] [Google Scholar]
- 55.Johnson NJJ, van Veggel F. ACS Nano. 2014;8:10517–10527. doi: 10.1021/nn503946t. [DOI] [PubMed] [Google Scholar]
- 56.Johnson NJJ, Korinek A, Dong CH, van Veggel F. J Am Chem Soc. 2012;134:11068–11071. doi: 10.1021/ja302717u. [DOI] [PubMed] [Google Scholar]
- 57.Johnson NJJ, He S, Diao S, Chan EM, Dai HJ, Almutairi A. J Am Chem Soc. 2017;139:3275–3282. doi: 10.1021/jacs.7b00223. [DOI] [PubMed] [Google Scholar]
- 58.Smith AM, Mancini MC, Nie SM. Nat Nanotechnol. 2009;4:710–711. doi: 10.1038/nnano.2009.326. [DOI] [PMC free article] [PubMed] [Google Scholar]
- 59.Johnson NJJ, He S, Hun VAN, Almutairi A. ACS Nano. 2016;10:8299–8307. doi: 10.1021/acsnano.6b02559. [DOI] [PubMed] [Google Scholar]
- 60.Pintacuda G, John M, Su XC, Otting G. Acc Chem Res. 2007;40:206–212. doi: 10.1021/ar050087z. [DOI] [PubMed] [Google Scholar]
- 61.Caravan P, Farrar CT, Frullano L, Uppal R. Contrast Media Mol Imaging. 2009;4:89–100. doi: 10.1002/cmmi.267. [DOI] [PMC free article] [PubMed] [Google Scholar]
- 62.Kim BH, Hackett MJ, Park J, Hyeon T. Chem Mater. 2014;26:59–71. [Google Scholar]
- 63.Zarschler K, Rocks L, Licciardello N, Boselli L, Polo E, Garcia KP, De Cola L, Stephan H, Dawson KA. Nanomedicine. 2016;12:1663–1701. doi: 10.1016/j.nano.2016.02.019. [DOI] [PubMed] [Google Scholar]
- 64.Avedano S, Botta M, Haigh JS, Longo DL, Woods M. Inorg Chem. 2013;52:8436–8450. doi: 10.1021/ic400308a. [DOI] [PMC free article] [PubMed] [Google Scholar]
Associated Data
This section collects any data citations, data availability statements, or supplementary materials included in this article.