

Abstract
We compared the dynamics of key methionine methyl groups in the water-accessible hydrophobic cavity of amyloid fibrils and Fluorenylmethyloxycarbonyl-Methionine (FMOC-Met), which renders general hydrophobicity to the environment without the complexity of the protein. Met35 in the hydrated cavity was recently found to undergo a dynamical cross-over from the dominance of methyl rotations at low temperatures to the dominance of diffusive motion of methyl axis at high temperatures. Current results indicate that in FMOC-Met this cross-over is suppressed, similar to what was observed for the dry fibrils, indicating that hydration of the cavity is driving the onset of the dynamical transition.
Keywords: methyl group dynamics, deuterium NMR, solids-state NMR, relaxation times, methionine
Graphical abstract

1. Introduction
Dynamics of methyl-bearing side chains have been long used to probe protein and peptide properties such as hydrophobic core packing,1–9 interaction with surfaces,10 water-accessibility,2,11 and others. Investigations of methyl dynamics in solid-state can be a useful tool for non-soluble biological systems such as amyloid fibrils.12 In the solid state one can also explore a much wider temperature range to elucidate the mechanistic details of motions, as well as perform experiments as a function of water content to probe the effects of solvent on the dynamics.2
We have recently investigated site-specific methyl group dynamics in the hydrophobic core and hydrophobic cavities of amyloid fibrils comprised of Aβ1-40 protein using static 2H solid-state NMR.13,14 One of the most interesting findings was the observation of a water-accessible cavity in the cross-β subunits defined by M35 residues. Additionally, longitudinal relaxation data indicated that the side-chain of M35 undergoes a cross-over behavior at around 250 K, at which the dominant relaxation mechanism changes from methyl rotations at low temperatures to methyl axis diffusion at high temperatures.13 The cross-over behavior suggests that the fibrils may undergo the so-called dynamical transitions, defined as an onset of larger-scale motions when protein is heated from cryogenic temperatures.15–18 The onset of the larger scale motions has been connected to the onset of biological function for a number of proteins.3,19,20
From the fundamental standpoint it is important to understand whether the existence of the cross-over behavior is inherent to methionine side chains in the hydrophobic cavity of the fibrils, or if it is also present in methionine side-chains belonging to simpler systems. Early works by Keinry et al.21 detected an onset of larger-amplitude methyl axis motions in crystalline L-methionine and one of the methionine residues in crystalline sperm-whale myoglobin, while L-methionine immersed in the D,L lattice as well as another methionine residue in myoglobin did not display this behavior. Thus, local environment influences the existence and features of the cross-over behavior. Note that all of these crystalline systems contained a large percentage of water in the crystallization matrix. The following questions remain to be answered: how important is general hydrophobicity without the complexity of the protein environment on defining the features of the cross-over behavior in methionine side-chains? How essential is the role of solvent? Our previous work on dry fibril samples suggested that the cross-over is likely to be solvent-driven,13 however comparative studies on simpler hydrophobic systems are required to further clarify/confirm the observed trend. We address these questions in the current work by investigating the methyl group in Fluorenylmethyloxycarbonyl-Methionine (FMOC-Met) in powder solid state. FMOC group imposes the presence of a large hydrophobic moiety (Fig. 1) that influences packing, yet lacks the complexity of a protein system. It thus permits us to probe the influence of local structural effects, as opposed to overall protein conformational ensemble. Additionally, it allows us to separate any effects of solvent.
Fig. 1.
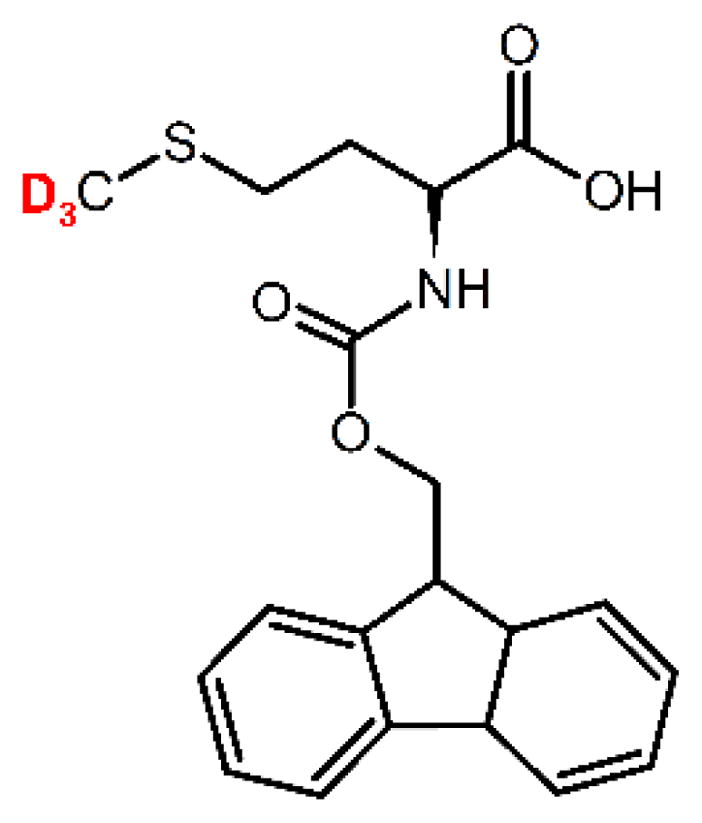
Structure of FMOC-Methionine indicating the position of deuterium labeling.
2. Materials and Methods
Materials
FMOC-Metionine-d3 from CDN Isotopes, Inc. (QC, Canada).
NMR Spectroscopy
Data were collected on 17.6 T and 9.4 T spectrometers equipped with static probes. 2H T1Z (Zeeman order) measurements under static conditions were performed by the inversion recovery sequence for relaxation times below 90 ms and saturation recovery sequence for longer times. All measurements on the 9.4 T spectrometer were performed using the quadrupolar echo detection scheme, while for the measurements on the 17.6 T spectrometer the multiple echo acquisition detection scheme (QCPMG) was utilized.22 QCPMG detection breaks the powder pattern spectrum into a series of spikes that roughly follow the shape of the powder pattern. The durations of 90° pulses were between 2.0–3.0 μs. Ten to fifteen QCPMG echoes were collected with 52 μs pulse spacing, corresponding to QCPMG spikelets (sidebands) spaced at 20 kHz intervals. The number of scans ranged from 32 to 256 depending on the precision of the data needed to define non-exponential decays. Seven to nine relaxation delays were collected. Relaxation data are reported for the spikelets corresponding to major singularity at 0 kHz. Spectra were processed using 500 Hz exponential line broadening. Temperature calibration was performed by recording static lead nitrate line shapes23 and using the freezing point of D2O, 3.8°C, as the fixed point for the calibration.
Modeling
Simulations required the use of two motional modes: methyl three-site jumps and diffusion of the methyl axis. Simulation procedures for the first mode, methyl three-site jumps, was extensively described in previous works.8,13 The quadrupolar coupling constant of 175 kHz and ideal tetrahedral geometry around the methyl carbon were used.14 The second mode was modeled as diffusion of the methyl axis (S-Cε) along an arc on a side of the cone with the axis along the Cγ-S bond. The two lone pairs of electrons on the sulfur cause deviations from the tetrahedral geometry and thus the angle of the methyl axis with respect to the Cγ-S is set to 99°. 24 The diffusion process was simulated by discretizing the orientation of the methyl axis along an arc of angular length α in steps of 1° along the polar angle φ, using nearest neighbors jumps with the rate constant kD = D/(Δφ)2, where D is the diffusion coefficient. The relaxation rates were fitted with the EXPRESS software package.25 Quadrupolar echo detection scheme was simulated for relaxation at 9.4 T and QCPMG detection was simulated for relaxation at 17.6 T, in accordance with the experiment.
3. Results and Discussion
Qualitative analysis of raw relaxation data points to absence of clear cross-over in FMOC-Met
Both experimental and modeling approaches for the FMOC-methionine powder sample followed closely the ones developed for the Aβ fibrils.13 Longitudinal relaxation rates were collected at two fields and the high field collection utilized the signal-enhancing detection (QCPMG). Examples of QCPMG spectra are shown in Fig. 1 and the relaxation data reported corresponds to the major singularity at 0 kHz. Similarly to the Aβ fibrils case, we have found non-exponential relaxation behavior (Fig. 2) that necessitates the use of the stretched-exponential function:26
Fig. 2.

Left: Examples of QCPMG spectra corresponding to the largest relaxation delay in the longitudinal relaxation time measurements at two temperatures. Right: corresponding relaxation build-up curves M(t) in the saturation recovery experiment at 17.6 T. Dashed lines correspond to the best fit mono-exponential decays and solid lines to the best fit stretched-exponential function defined in Eq. 1. Intensity is shown in arbitrary units.
| (1) |
in which M(t) is the signal intensity, is the effective relaxation time, and β is the parameter which reflects the degree of non-exponentiality, 0 < β ≤ 1. β less than 1 corresponds to a non-exponential behavior. Note that for saturation recovery measurements M(0)= 0. Eq. (1) is one of the typical empirical functions that are used in descriptions of various dynamic effects in glasses.27,28 It can be viewed as an integral of ordinary mono-exponential relaxation functions over a distribution of the relaxation rates.29 As will be elaborated in the modeling section, the non-exponential relaxation reflects the presence of multiple conformers with different values of correlation times for the underlying motional mechanism, the three-site jumps. If the distribution of the correlation times is unimodal, with a well-defined central value, and a width within approximately one to two orders of magnitude of the central value, the integrated relaxation curve can be phenomenologically approximated by the stretched exponential function, Eq.(1). The difference of the parameter β from unity reflects the relative width of the underlying distribution. An alternative explanation, the presence of two separate well defined states, relaxing with distinct rates and contributing to the overall relaxation is possible and indeed we observed such a scenario for methyl groups in FMOC-Leucine.30 However, in the present case this model cannot hold consistently for the entire temperature range, as shown in the Supplementary Material (S1). We will thus proceed with the assumption of the unimodal distribution of correlation times.
The relaxation behavior of methyl groups in Aβ fibrils and FMOC-Met has distinct differences (Fig. 3), reflecting the importance of the local environment. The relaxation times are smaller in FMOC-Met and the T1 minimum is shifted to larger temperatures, which is also reflected in the temperature dependence of the values of β (i.e., β increases around the T1 minimum, as summarized in Supplementary Material SI2)8.
Fig. 3.

A) Plots of and β vs. 1000/T on semilog scale, for FMOC-methionine (blue circles) and fibrils of Aβ1-40 in native 3-fold morphology13 in the hydrated (red diamonds) and dry (black squares) states at 17.6 T. Intensities were taken at 0 kHz spikelet. Error bars smaller than the size of the symbol are not shown. B) High temperature expansion for .
Qualitatively, one of the striking differences is the absence of dramatic leveling of the relaxation curve which was observed for the hydrated fibrils at around 250 K. Rather, for FMOC-Met there is a slight gradual change in the slope at high temperatures (Figure 3B), which is qualitatively similar to the case of the dry fibrils. The comparison indicates that for the FMOC-Met system methyl jumps remain the dominant relaxation mechanism across the entire temperature range, and an additional weakly contributing mechanism is present at high temperatures. The field-dependence of the relaxation (Fig. 4) indicates that this extra motional mechanism is in the slow limit with respect to the Larmor frequency, as was the case for the fibrils.
Fig. 4.

Plots of and β vs. 1000/T on semilog scale, for FMOC-methionine at 17.6 T (blue circles) and 9.4 T (red squares). Intensities were taken at 0 kHz spikelet. Error bars smaller than the size of the symbol are not shown. The solid-lines represent the fits to the two-mode motional model consisting of methyl three-site jumps and diffusive motion of the methyl axis, as described in the text.
Modeling indicates that FMOC-Met is qualitatively similar to Met35 in the dry amyloid fibrils
Modeling of the relaxation data employed two motional modes: three-site methyl jumps and diffusive motion of the methyl axis. The diffusive motion is modeled as a restricted diffusion of the S-Cε axis on an arc of length α (Fig. 5). This asymmetric diffusion geometry was introduced in order to describe adequately both the relaxation and the line shape data in the fibrils14 which exhibited effective asymmetry in the quadrupolar tensor. The length of the arc of 34°, the same value as in the fibrils, is consistent with the experimental data for the FMOC-Met sample (Fig. 4).
Fig. 5.

Schematic representation of the diffusion along the restricted arc α, modeled as nearest neighbor jumps.
Further, the model assumes a distribution of conformers with different methyl three-site jump rate constants, for which temperature dependence follows the Arrhenius Law. A global description at all temperatures is shifted to the activation energy space and the distribution is then characterized by different values of the activation energy Ea for each conformer.8 The model parameters for this mode then comprise the central value for the activation energy 〈Ea〉, the width of the Gaussian distribution of activation energies σ, and the Arrhenius law prefactor k0. Our previous analysis indicated that when the width of the distribution is small compared to the central value, the assumption of the Gaussian shape holds for most cases.8,31 The fitted value of 〈Ea〉 =9.6 ± 0.7 kJ/mol in FMOC-Met is somewhat larger compared to the value of 7.3 ± 0.6 kJ/mol that has been found for the fibrils (in both the dry and hydrated states), and the widths of the distributions σ are comparable: 2.6 ± 0.4 for the fibrils and 2.9 ± 0.3 for the FMOC-Met. Thus, the packing is somewhat tighter in the FMOC-Met, while the width of conformational heterogeneity is similar. The fact that the activation energies are the same for both the hydrated and dry states of the fibrils indicates that the three-site jump processes are governed by the structure of the immediate environment.
The values of the diffusion coefficient D are the same at all temperatures within the experimental precision, and fall in the 1.3·106–1.1·106 s−1 range (Fig. 6). In contrast, for the hydrated fibril samples the diffusion coefficient displayed clear temperature dependence with the activation energy of 12 kJ/mol for the three-fold morphology (spanning the values between 6.2·106 and 2.0·106 s−1 in the 310 – 250 K range), while for the dry fibrils the diffusion coefficient was temperature independent with the values in the 1.0 to 1.2·106 s−1 range.13
Fig. 6.

Plots of vs 1000/T on semilog scale for experimental data at 17.6 T (circles), the simulated contribution due to methyl three-site jumps (solid lines), and the simulated contribution due to methyl axis diffusion (dotted lines). The arrow points to the cross-over temperature in the hydrated fibrils samples.
Thus, FMOC-Met behaves very similarly to the dry fibrils in terms of the diffusion mode. As observed for the dry fibrils, the diffusive motion in FMOC-Met is never dominant and the three-site methyl jumps dominate relaxation in the entire temperature range. This is illustrated in Fig. 6 in which experimental relaxation rates are compared with those simulated on the basis of either the three-site methyl jumps mechanism (solid lines) or the methyl axis diffusion mechanism (dotted lines). For both FMOC-Met and the dry fibrils, the contribution due to diffusion is significantly smaller than the contribution of the three-site jumps, while for the wet fibrils the relaxation due to diffusion is more effective at the high temperatures and the cross-over occurs at the intersection of the two lines. Note, that if the two motions were fully independent of each other, the relaxation rates due to the individual mechanisms would be additive. However, in our case the separation of the time scales is not sufficient to render the mechanisms independent.
Combined with the results discussed in the introduction for hydrated crystalline L-methionine, methionine in D,L lattice and methionine in hydrated crystalline sperm-whale myoglobin,21 we conclude that the hydrophobicity of the environment is not sufficient to cause the cross-over behavior. These results strongly support the role of solvent in facilitating the cross-over through enhancement of larger-scale motions.
Conclusion
The significance of this work is the demonstration that the methyl group dynamics in FMOC-Met system is qualitatively similar to methyl groups of M35 in the dry amyloid fibril samples. I.e., the onset of the diffusive motion of the methyl axis is suppressed and methyl jumps remain the dominant mechanism over the entire temperature range. Further, the values of the diffusion coefficients are almost identical in the dry fibrils and in FMOC-Met. Thus, the presence of the hydrophobic environment by itself is not sufficient to cause the dynamical transition. Rather, the cross-over behavior of M35 in the hydrated amyloid fibril samples is driven by the hydration of the hydrophobic cavity. FMOC-Met packing is somewhat tighter than in the dry fibrils, as reflected in the 24% increase in the values activation energy for the methyl jumps, while the width of the conformational heterogeneity, reflected in the values of σ, are similar in the two samples.
Supplementary Material
Highlights.
We compared the dynamics of methyl groups in FMOC-Met and M35 in amyloid fibrils
2H static solid-state NMR was the main experimental tool
The dynamical cross-over is suppressed in FMOC-Met, similar to the dry fibrils
Hydration of fibrils’ cavity is driving the dynamical transition
Acknowledgments
Support for this research was received from National Institutes of Health Grant 1R15 GM111681-02 to L.V. We thank Prof. Gina Hoatson at the College of William and Mary for access to the 17.6 T spectrometer. Some of the experiments were performed at the National High Magnetic Field Laboratory, which is supported by National Science Foundation Cooperative Agreement No. DMR-1157490, the State of Florida and the U.S. Department of Energy.
Footnotes
Publisher's Disclaimer: This is a PDF file of an unedited manuscript that has been accepted for publication. As a service to our customers we are providing this early version of the manuscript. The manuscript will undergo copyediting, typesetting, and review of the resulting proof before it is published in its final citable form. Please note that during the production process errors may be discovered which could affect the content, and all legal disclaimers that apply to the journal pertain.
References
- 1.Igumenova TI, Frederick KK, Wand AJ. Chem Rev. 2006;106:1672–1699. doi: 10.1021/cr040422h. [DOI] [PMC free article] [PubMed] [Google Scholar]
- 2.Krushelnitsky A, Reichert D. Prog Nucl Magn Reson Spectrosc. 2005;47:1–25. [Google Scholar]
- 3.Lee AL, Wand AJ. Nature. 2001;411:501–504. doi: 10.1038/35078119. [DOI] [PubMed] [Google Scholar]
- 4.Mittermaier AK, Kay LE. Tr Biochem Sci. 2009;34:601–611. doi: 10.1016/j.tibs.2009.07.004. [DOI] [PubMed] [Google Scholar]
- 5.Vold RL, Vold RR. Deuterium Relaxation in Molecular Solids. In: Warren W, editor. Advances in Magnetic and Optical Resonance. Acadenic Press; San Diego: 1991. pp. 85–171. [Google Scholar]
- 6.Xue Y, Pavlova MS, Ryabov YE, Reif B, Skrynnikov NR. J Am Chem Soc. 2007;129:6827–6838. doi: 10.1021/ja0702061. [DOI] [PubMed] [Google Scholar]
- 7.McDermott A, Polenova T. Curr Opin Structr Biol. 2007;17:617–622. doi: 10.1016/j.sbi.2007.10.001. [DOI] [PubMed] [Google Scholar]
- 8.Vugmeyster L, Ostrovsky D, Penland K, Hoatson GL, Vold RL. J Phys Chem B. 2013;117:1051–1061. doi: 10.1021/jp311112j. [DOI] [PMC free article] [PubMed] [Google Scholar]
- 9.Vugmeyster L, Ostrovsky D, Ford JJ, DBS, Lipton AS, Hoatson GL, Vold RL. J Am Chem Soc. 2009;131:13651–13658. doi: 10.1021/ja902977u. [DOI] [PubMed] [Google Scholar]
- 10.Weidner T, Breen NF, Li K, Drobny G, Castner DG. Proc Natl Acad Sci U S A. 2010;107:13288–13293. doi: 10.1073/pnas.1003832107. [DOI] [PMC free article] [PubMed] [Google Scholar]
- 11.Vugmeyster L, Ostrovsky D, Khadjinova A, Ellden J, Hoatson GL, Vold RL. Biochemistry. 2011;50:10637–10646. doi: 10.1021/bi201515b. [DOI] [PMC free article] [PubMed] [Google Scholar]
- 12.Linser R, Sarkar R, Krushelnitzky A, Mainz A, Reif B. J Biomol NMR. 2014;59:1–14. doi: 10.1007/s10858-014-9822-6. [DOI] [PubMed] [Google Scholar]
- 13.Vugmeyster L, Ostrovsky D, Clark MA, Falconer BI, Hoatson GL, Qiang W. Biophys J. 2016;111:2135–2148. doi: 10.1016/j.bpj.2016.10.001. [DOI] [PMC free article] [PubMed] [Google Scholar]
- 14.Vugmeyster L, Clark MA, Falconer BI, Ostrovsky D, Gantz D, Qiang W, Hoatson GL. J Biol Chem. 2016;291:18484–18495. doi: 10.1074/jbc.M116.740530. [DOI] [PMC free article] [PubMed] [Google Scholar]
- 15.Doster W. Eur Biophys J. 2008;37:591–602. doi: 10.1007/s00249-008-0274-3. [DOI] [PubMed] [Google Scholar]
- 16.Khodadadi S, Pawlus S, Roh JH, Sakai VG, Mamontov E, Sokolov AP. J Chem Phys. 2008;128:5. doi: 10.1063/1.2927871. [DOI] [PubMed] [Google Scholar]
- 17.Khodadadi S, Sokolov AP. Soft Matter. 2015;11:4984–4998. doi: 10.1039/c5sm00636h. [DOI] [PubMed] [Google Scholar]
- 18.Miao YL, Yi Z, Glass DC, Hong L, Tyagi M, Baudry J, Jain NT, Smith JC. J Am Chem Soc. 2012;134:19576–19579. doi: 10.1021/ja3097898. [DOI] [PubMed] [Google Scholar]
- 19.Rasmussen BF, Stock AM, Ringe D, Petsko GA. nature. 1992;357:423–424. doi: 10.1038/357423a0. [DOI] [PubMed] [Google Scholar]
- 20.Ringe D, Petsko GA. Biophys Chem. 2003;105:667–680. doi: 10.1016/s0301-4622(03)00096-6. [DOI] [PubMed] [Google Scholar]
- 21.Keniry MA, Rothgeb TM, Smith RL, Gutowsky HS, Oldfield E. Biochemistry. 1983;22:1917–1926. doi: 10.1021/bi00277a028. [DOI] [PubMed] [Google Scholar]
- 22.Larsen FH, Jakobsen HJ, Ellis PD, Nielsen NC. Mol Phys. 1998;95:1185–1195. [Google Scholar]
- 23.Beckmann PA, Dybowski C. J Magn Reson. 2000;146:379–380. doi: 10.1006/jmre.2000.2171. [DOI] [PubMed] [Google Scholar]
- 24.Haynes WM, Lide DR. CRC handbook of chemistry and physics. 92. Boca Raton, Fla: CRC Press; 2011. [Google Scholar]
- 25.Vold RL, Hoatson GL. J Magn Reson. 2009;198:57–72. doi: 10.1016/j.jmr.2009.01.008. [DOI] [PubMed] [Google Scholar]
- 26.Beckmann PA, Schneider E. J Chem Phys. 2012;136:054508. doi: 10.1063/1.3677183. [DOI] [PubMed] [Google Scholar]
- 27.Sillescu H. J NonCryst Sol. 1999;243:81–108. [Google Scholar]
- 28.Schnauss W, Fujara F, Hartmann K, Sillescu H. Chem Phys Lett. 1990;166:381–384. [Google Scholar]
- 29.Lindsey CP, Patterson GD. J Chem Phys. 1980;73:3348–3357. [Google Scholar]
- 30.Vugmeyster L, Ostrovsky D, Moses M, Ford JJ, Lipton AS, Hoatson GL, Vold RL. J Phys Chem. 2010;114:15799–15807. doi: 10.1021/jp1082467. [DOI] [PubMed] [Google Scholar]
- 31.Vugmeyster L, Osrovsky D, Villafranca TR, Sharp J, Xu W, Lipton AS, Hoatson GL, Vold RL. J Phys Chem B. 2015;119:14892–14904. doi: 10.1021/acs.jpcb.5b09299. [DOI] [PMC free article] [PubMed] [Google Scholar]
Associated Data
This section collects any data citations, data availability statements, or supplementary materials included in this article.