Abstract
Although a number of in vitro disease models have been developed using hiPSCs, one limitation is that these two-dimensional (2-D) systems may not represent the underlying cytoarchitectural and functional complexity of the affected individuals carrying suspected disease variants. Conventional 2-D models remain incomplete representations of in vivo-like structures and do not adequately capture the complexity of the brain. Thus, there is an emerging need for more 3-D hiPSC-based models that can better recapitulate the cellular interactions and functions seen in an in vivo system.
Here we report a protocol to develop a 3-D system from undifferentiated hiPSCs based on the serum free embryoid body (SFEB). This 3-D model mirrors aspects of a developing ventralized neocortex and allows for studies into functions integral to living neural cells and intact tissue such as migration, connectivity, communication, and maturation. Specifically, we demonstrate that the SFEBs using our protocol can be interrogated using physiologically relevant and high-content cell based assays such as calcium imaging, and multi-electrode array (MEA) recordings without cryosectioning. In the case of MEA recordings, we demonstrate that SFEBs increase both spike activity and network-level bursting activity during long-term culturing. This SFEB protocol provides a robust and scalable system for the study of developing network formation in a 3-D model that captures aspects of early cortical development.
Keywords: Neuroscience, Issue 125, iPSC, 3D, SFEB, neurons, human cortical development, physiology
Introduction
We have previously reported a 3-D model system, generated from patient-derived human induced pluripotent stem cells (hiPSCs) that recapitulates some aspects of early cortical network development1. This 3-D model, a serum-free embryoid body (SFEB), improves on previous simple aggregation hiPSC models2,3. A growing body of work is revealing that 3-D structures like our SFEBs, approximate aspects of neural development commonly observed in vivo and at an earlier time point than observed in 2-dimensional (2-D)/monolayer hiPSC models4,5. Initial studies have been focused on the self-organizing complexity of 3-D bodies without demonstrating their physiological complexity2.
The protocol described here has been used on undifferentiated hiPSCs derived from fibroblasts and peripheral blood mononuclear cells (PBMCs). These cells are maintained on γ-irradiated mouse embryonic feeders (MEFs). These hiPSC colonies are manually cleaned of spontaneously differentiated cells, enzymatically harvested, and resuspended in medium containing Rho-Kinase inhibitor Y-27632 (ROCKi). Undifferentiated hiPSCs are subjected to dissociation and centrifugation before being transferred to 96-well low adhesion V-bottom plates. After plating, neural induction is initiated using dual SMAD inhibition (SB431542 and LDN193189 along with dickkopf 1 (DKK-1)) to drive an anterior-frontal forebrain neuronal-fate lineage6. After 14 days, the SFEBs are transferred to cell culture inserts in a 6-well plate. Once transferred, the round SFEBs begin to spread and thin, while maintaining local network connections as is often observed in hippocampal organotypic slice culture preparations using similar cell culture inserts1,7.
The use of an SFEB based 3-D platform in this format is amenable to the efficient production of cortical networks that may be interrogated using cell based physiological assays such as calcium imaging or electrophysiological assays such as single cell recordings or multi-electrode array (MEA)1. Although 3-D systems bear the markers of early cortical development, other studies have shown that these 3-D bodies may require longer incubation times to allow for the inherently slower pace of human tissue development8. This SFEB protocol successfully generates 3-D SFEBs from undifferentiated hiPSCs that captures aspects of the early development of the cortex.
The potential of SFEBs to model network aberrations in neurological disorders is a strength of this system. The hiPSCs derived from patient tissue can be grown into cells of the nervous system that are subject to assays relating to cell biology as well as concomitant gene expression. Human iPSCs are being used to ascertain the genetic profile of large groups of individuals with varying neurological disorders with complex etiologies such as autism spectrum disorder (ASD), schizophrenia9, Rett Syndrome10, and Alzheimer's disease11,12. Until recently, iPSC models were typically monolayer preparations that, while proficient in evaluating molecular interactions, were inadequate in deciphering the complex cellular interactions seen in vivo. Animal models have been the default substitute for recreating the whole-organ platform. These animal models are plagued by poor translation of findings and have limited ability to replicate human genetic profiles identified by large genetic screening studies. Thus, the development of 3-D systems from iPSCs adds a needed layer of complexity in human disease modeling13,14. The next step for 3D hiPSC platforms is to accommodate the large scale requirements of high throughput screening using cell based assays15.
Protocol
1. Generation of Neural Progenitor Cells
- Maintain hiPSCs derived from fibroblasts and PBMCs in 6-well plates on a γ-irradiated mouse embryonic feeder (MEF) cell layer in human iPSC medium supplemented with small-molecules (see the Materials Table). NOTE: Daily maintenance is a modified version of previously reported procedures1,16.
- Plate 6 x 10⁵ MEFs onto each well of a 6-well tissue culture grade plate in 300 μL/well recommended medium (following manufacturer's protocol).
- After 48 h, replace MEFs medium with 300 μL/well hiPSC medium for 1 h before adding hiPSCs.
- Quickly thaw hiPSCs in a 37 °C water bath and slowly add 1 mL hiPSC medium dropwise. Transfer the hiPSCs and medium to a 15 mL conical tube. Add medium to bring the total volume to 5 mL. Centrifuge for 4 min at 129 x g, aspirate the supernatant, gently re-suspend the pellet in 1 mL hiPSC medium with ROCK inhibitor at 1:1,000 concentration.
- Plate the cell suspension (typically seeded at 300,000 cells/well) onto the MEF cell layer and incubate at 37 °C, 5% CO2, 95% humidity.
- Monitor iPSC culture closely using a light microscope. After 48 h, remove cultures that have uneven edges, have grown to become cystic-like or appear yellowish-brown under the light microscope to minimize spontaneous differentiation. NOTE: After 7 - 10 days, hiPSC colonies should form. Colonies should be round, with clearly defined borders and uniform cell densities, and devoid of loosely packed non-uniform cells.
After expansion and freezing cells (for backup), grow hiPSC colonies on plates until they reach 50 - 75% confluence.
Seven-days post plating, use mild enzymatic treatment (5-10 min with 300 μL of enzyme solution) and gentle trituration (2-4 times with a 1,000 µL pipet) to harvest and prepare hiPSCs for neural precursor cell differentiation.
Centrifuge the cell suspension at 129 x g for 4 min, aspirate the supernatant, and resuspend the pellet in 5 mL human iPSC medium. Transfer the cell suspension to a 0.1% gelatin coated 5 cm cell culture dish for 1 h at 37 °C to eliminate MEFs and to maximize the hiPSC yield. Transfer the medium (with non-adherent cells) to another 5 cm gelatin coated dish.
Transfer the non-adherent cells to a 15 mL centrifuge tube using a transfer pipet. Gently rinse the plates with 3 mL medium and add it to the 15 mL tube.
Centrifuge the cell suspension at 129 x g for 4 min, aspirate the supernatant, and gently resuspend the pellet in medium. Determine the cell count using an automated cell counter. Plate 9,000 cells/well in a 96-well low-adhesion V-bottom plate.
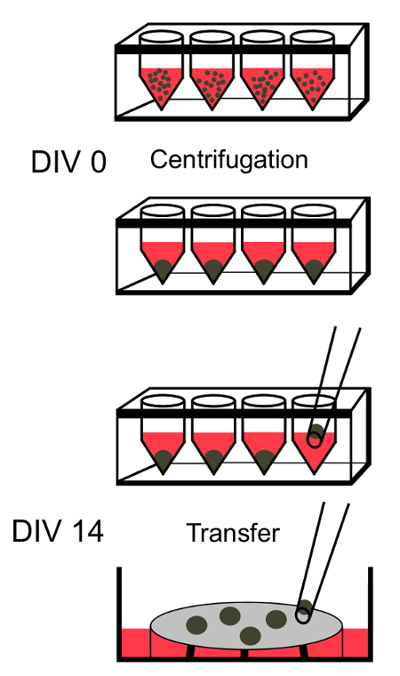
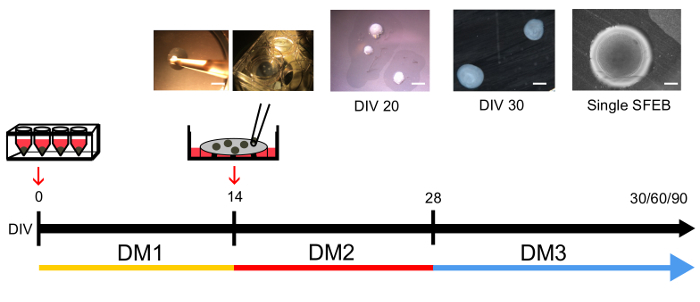
Centrifuge the plate at 163 x g for 3 min. Incubate the plate at 37 °C, 95% humidity and 5% CO2. Using a pipette, change 50% medium every other day by removing half of the medium and replacing it with fresh chemically-defined differentiating medium 1 (DM1; Figure 1; Table of Materials) for 14 days.
2. Serum-Free Embryoid Body (SFEB) Induction (Figure 2)
Place 40 µm cell culture inserts into 6-well plates and add 1 mL DM1 medium at least 1 h prior to the addition of aggregates.
- On day 14, transfer the aggregates with 20 µL medium using a 200 µL wide mouth tip onto 40 µm cell culture inserts and change the medium to DM2. NOTE: Cell culture inserts are specialized inserts that sit slightly off the bottom of the well and consist of a polytetrafluoroethylene membrane suspended across a plastic frame. This membrane is biocompatible and can efficiently sustain nutrient and oxygen transport to the SFEBs, which are placed on top. They are commonly used with organotypic hippocampal slice cultures taken from mouse or rat7,17,18.
- Transfer 4-6 aggregates to one cell culture insert and allow adequate space between the aggregates. Remove as much excess solution as possible using a fine pipette tip (e.g. 200 μL tip). NOTE: It is acceptable to briefly disturb the SFEB as they will move on the cell culture insert as the solution in removed from around the SFEBs.
- Maintain the cultures in 1 mL of DM2 at 37 °C, 95% humidity and 5% CO2. Using a pipette, change 75% medium every other day by removing three quarters of the medium and replacing with three quarters fresh medium. For example, remove 750 μL of medium and add 750 μL of fresh medium.
After 14 days of culture, switch to DM3 medium with 75% medium change every other day and for another 16 days.
To maintain the SFEBs on cell culture inserts beyond 30 days, change the medium every other day for 60, 90 and 120 days. NOTE: The SFEBs will grow to about 1,000 μm in diameter and are typically 100-150 μm thick1.
3. Determining SFEB Composition
Detach the SFEBs from the insert by gently pipetting medium using a 200 µL wide mouth pipette tip. To transfer the SFEBs, use a wide mouth pipette tip to gently suction the bodies into the pipet tip. After loading SFEB into the pipet tip, gently transfer to 12-well plates and wash with 300 μL phosphate buffered saline (PBS) per well. NOTE: SFEBs will be suspended in solution in the 12-well plates. This is important to allow full penetration of the fixative, the blocking solution, and antibodies. If using multiple SFEBs for staining, up to 10 SFEBs can be added per well of a 12 well plate. This will conserve solutions and antibodies.
Fix SFEBs with 300 μL per well 4% paraformaldehyde at room temperature for 30-45 min. Wash fixed SFEBs twice with 300 μL PBS, 3-5 min each wash. Caution: Wear appropriate personal protective equipment when handling paraformaldehyde. NOTE: Probe for immunoreactivity to markers to determine maturity, cell type etc. For marking neurons in this study chicken-Tuj1 was used at 1:500, for additional markers please see Table 2 and references1,16.
Permeabilize and block with 0.1% Triton-X100 in PBS and 10% normal donkey serum (blocking solution; 300 μL per well) for 1 h at room temperature.
Remove the blocking solution and treat SFEBs with 300 μL primary antibodies in blocking solution. Incubate at 4 °C overnight. Wash SFEBs thrice (3-5 min per wash) in 300 μL PBS containing 0.1% Triton-X.
Prepare secondary antibodies 1:1000 in blocking solution. Incubate SFEBs for 1 h at room temperature with secondary antibodies. Wash SFEBs with 300 μL PBS, 3 times for 3-5 min each. NOTE: At this stage SFEBs can be prepared for imaging.
To image, pipette SFEBs onto a glass slide using a wide-bore pipette. Remove excess solution around the SFEB using gentle suction. NOTE: For similar staining conditions, multiple SFEBs can be placed on the same glass slide.
Add a drop of mounting medium on the SFEBs, place a glass coverslip, and gently press to ensure that there are no air bubbles. Allow the mounting medium to harden and proceed to imaging and quantification (step 3.8). NOTE: After the mounting medium hardens, the SFEBs are ready for imaging.
Perform cell quantification by taking multiple regions of interest (ROI) across the SFEB and using a z-stack combined with a maximal projection image through each ROI on a standard confocal microscope as described in references1,16. NOTE: Whole SFEBs can be quantified using image-based tiling (see references1,16 for details). Since the SFEBs thin to approximately 100 μm, there is minimal scattering of light in the tissue and thus there is no need for 2-photon microscopy. Earlier uses of this protocol with fibroblast-derived iPSCs produced a SFEB fate map that revealed complex and diverse structure with subpopulations of interneurons with transcriptional identities that resembled CGE and anterior forebrain fates1,16.
4. Recording Neuronal activity in SFEBs Using MEAs
Prepare 12-well MEA plates as per manufacturer's instructions.
Wash the MEA plates 3 times for 5 min with sterile H2O under aseptic conditions to clean. Wash for 5 min with 75% ethanol and then with 100% ethanol to sterilize the plate.
Bake the plate inverted in an oven for 4-5 h at 50 °C to complete the sterilization process.
Add 500 µL 0.2% polyethyleneimine solution (PEI) to each well and incubate 1 h at room temperature. Aspirate PEI and wash the wells 4x with sterile distilled H2O. Air dry in the hood overnight.
Prepare a 20 µL/mL solution of laminin in L15 medium and add 10 µL laminin to the center of each well. NOTE: Do not coat the surrounding reference and grounding electrodes.
Add sterile dH2O to the surrounding reservoirs to prevent medium or laminin evaporation. Incubate the plate for 1 h at 37 °C.
Add SFEBs (see sections 1 and 2) to the laminin coated MEA plates by gently suctioning them into a wide mouth pipette tip and transfer them. Add 200 µL DM2 medium to each well and incubate overnight at 37 °C, 95% humidity and 5% CO2.
Add an additional 200 µL medium after 24 h and allow it to recover for 30 min at 37 °C, 95% humidity, 5% CO2 before reading the plate.
Place the MEA plate in the plate reader (preheated to 37 °C) to record neuronal activity. Record activity for 10 min with the associated MEA recording software. See reference19 for details.
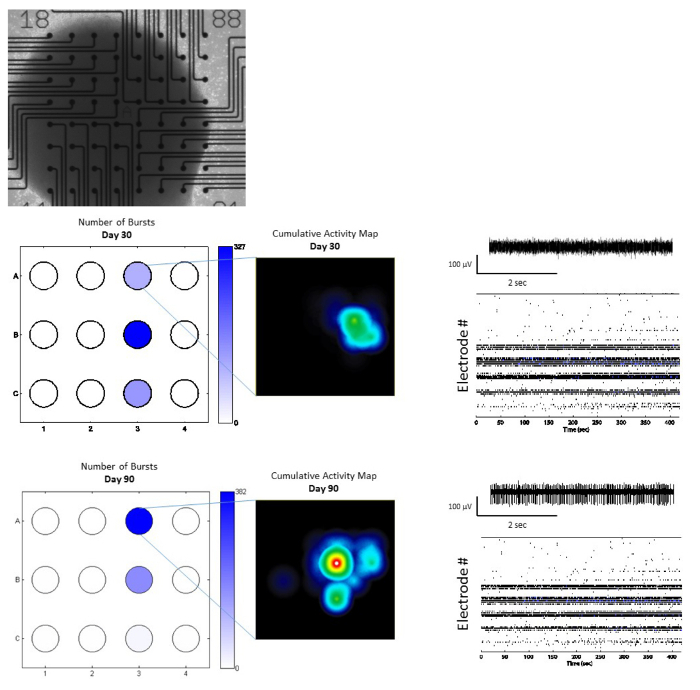
Generate raw data-continuous streams and raster plots of neuronal activity using statistical analysis software19. NOTE: MEA recordings are taken 7 days post SFEB plating. For this study, recordings were taken for 10 min to detect network burst activity, continuous trace, and raster plots. SFEBs can be maintained long-term on MEA plates and can be recorded over longer periods of time using environmentally controlled conditions (Figure 6).
Representative Results
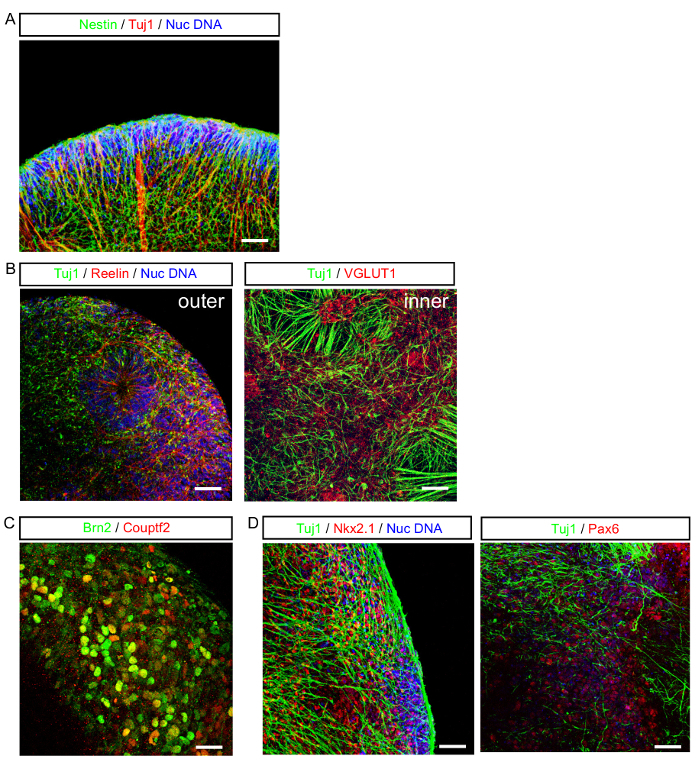
SFEBs grown using our technique yielded tissue with morphological characteristics that resemble an early developing cortical subventricular zone replete with extensive Tuj1-positive neurons, as well as neural progenitors (Figure 3A). Numerous developing cortical rosettes were observed in the outer layers and inner layers of the SFEB (Figure 3B). The outer edge of the SFEB resembles a developing cortical plate containing postmitotic neurons. This is supported by the expression of Brn2, a marker for neural progenitors in the most ventralized outer cortical layers. Reelin positive cells that may be Cajal-Retzius cells or their progenitors, which are expressed in the outer layers of the developing cortex are also observed in SFEBs (Figure 3C). SFEBs grown using this protocol express markers consistent with a mixed caudal (CGE) and medial ganglionic eminence (MGE) origin. Cells that express the CGE marker Couptf2 and other cells expressing MGE marker Nkx2.1 can be observed in the cultures (Figure 3D). This may be in part due to the use of DKK-1 in the protocol, which has been shown to enhance medial fates20.
SFEBs made using this protocol yield both calretinin- and calbindin-positive interneurons (Figure 4A) as well as VGLUT positive excitatory neurons and Tbr1-positive glutamatergic neural progenitors (Figure 4B). On an average, we have observed that 61% of the total cells in SFEBs are VGLUT positive and 43% are Tbr1-positive (Figure 4C). This is consistent with others reports using similar protocols21. Additionally, SFEBs can be subject to physiological assays such as live-cell calcium imaging using markers such as Fluo-4, in order to observe neural network function in a more physiologically-relevant environment (Figure 5). SFEBs can be subjected to MEA recordings for long periods of time and show development of cortical network-level bursting (Figure 6).
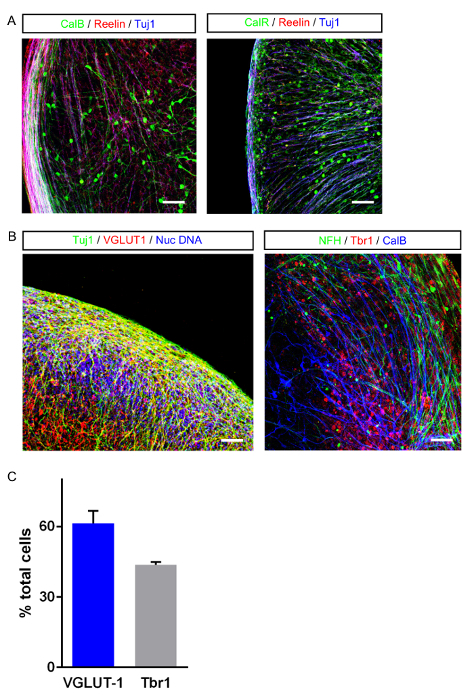
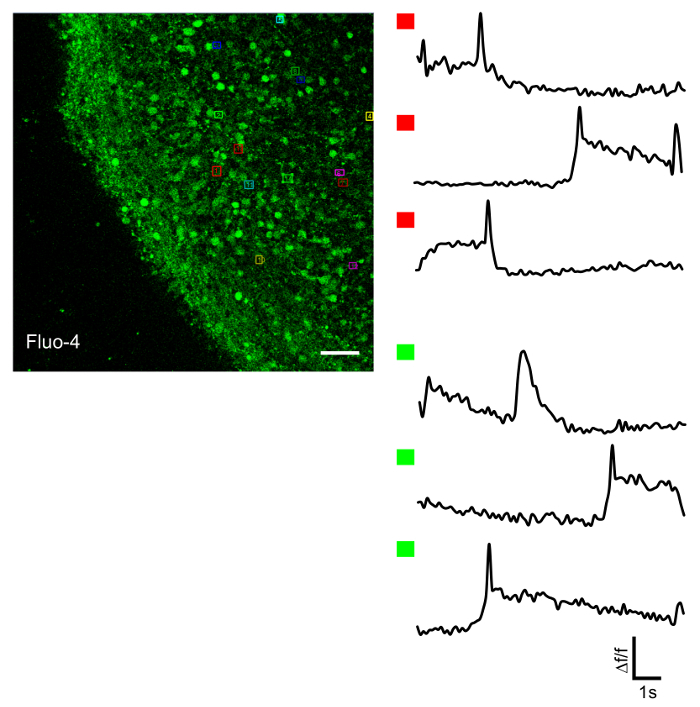
Figure 1: Schematic Outlining the Early Steps in Preparing SFEBs. After iPSCs have been harvested using an enzymatic dissociation, they are plated in 96-well plates and centrifuged at 163 x g for 3 min to induce quick aggregation. After 14 days in vitro (DIV) cell aggregates can be transferred from 96-well plates via wide-bore pipets onto cell culture insert-containing 6-well plates. Please click here to view a larger version of this figure.
Figure 2: Time-line of Medium Changes and Phases during SFEB Growth and Expansion. After SFEBs have been transferred to inserts, they under go two medium changes at 14 and 28 days in vitro (DIV). They are typically harvested for experiments at DIV 30, 60 and 90. Upper insets show different phases in this process. Scale bars = 1,000 μm (far left); 1,000 μm (DIV 20); 600 μm (DIV 30); 300 μm (single SFEB). Please click here to view a larger version of this figure.
Figure 3: General Morphological Characteristics of SFEBs Grown using this Protocol. (A) Typical outer edge of an SFEB expressing the progenitor marker nestin (green), the post-mitotic neural marker Tuj1 (red) and the nuclear stain (blue). (B) SFEBs show characteristic cortical rosettes in both the outer layers (left image) and inner layers (right). They express both progenitor and mature neuronal markers. (C) A representative outer edge of an SFEB expressing the outer layer/cortical plate marker Brn2 (green) and the developing CGE marker Couptf2 (red). (D) SFEBs made using this protocol represent ventralized neocortical structures as seen by Pax6 (red) staining and express markers consistent with some MGE origins such as Nxk2.1 (red). Scale bar = 40 μm. Please click here to view a larger version of this figure.
Figure 4: Images of Major Neuronal Cell Types in SFEBs. (A) Some neurons in SFEBs express markers consistent with cortical interneurons such as calbindin (green, left image) and calretinin (green, right image). (B) SFEBs show VGLUT-1 positive glutamatergic neurons (red, left image) and glutamatergic progenitors expressing Tbr1 (red, right image). Scale bar = 40 μm. (C) Typical yields of excitatory neurons expressing either VGLUT-1 or Tbr1 (error bar = S.E.M). Please click here to view a larger version of this figure.
Figure 5: Live-cell Calcium Recordings. (Left image) Representative outer edge SFEB treated with Fluo-4, a neuronal calcium indicator. Cells are marked for measurement of spontaneous calcium transients (assorted color boxes). (Right image) Selected cells demonstrating spontaneous calcium transients marked by red boxes (upper traces) or green boxes (lower traces). Scale bar = 40 μm. Please click here to view a larger version of this figure.
Figure 6: Multi-electrode Array Recordings of SFEBs. (Top) Representative image of SFEB attached to a MEA plate (Scale bar = 100 μm). (Middle and bottom) SFEBs can be recorded on MEAs over long time periods and show maturation. (Middle and bottom; left) A well-wide burst map of 3 SFEBs plated onto 3 wells of a 12-well MEA plate, darker colors represent higher overall spike activity that increases between day 30 and day 90. (Middle and bottom; insets) Cumulative activity map shows an increase in the spike density and the area of spikes within cortical networks in SFEBs between day 30 and day 90. (Middle and bottom, right) Raw traces (upper) and whole-well raster plots (lower) show an increase in the number of spikes and the number of bursts over time; indicative of stronger network formation in SFEBs. Please click here to view a larger version of this figure.
| Antibody | Dilution | Species |
| Nestin | 0.111111111 | Mouse |
| Brn-2 | 0.388888889 | Rabbit |
| VGLUT1 | 0.111111111 | Rabbit |
| Pax6 | 0.25 | Rabbit |
| Calretinin | 0.180555556 | Rabbit |
| Calbindin | 0.319444444 | Rabbit |
| CoupTFII | 0.180555556 | Mouse |
| Nkx 2.1 | 0.180555556 | Rabbit |
| Tuj1 | 0.388888889 | Chicken |
| Reelin | 0.388888889 | Mouse |
| Tbr1 | 0.180555556 | Chicken |
| NFH | 0.25 | Mouse |
Table 1: Antibodies Used in this Study.
Discussion
The protocol described here provides the conditions for differentiating a hiPSC source into a 3-D structure that recapitulates an early developmental stage of the frontal cortex. This procedure yields structures that can be interrogated for electrophysiology while also being amenable to microscopy. The final morphology of the SFEB resembles that of organotypic brain slice cultures and allows high quality detailed confocal imaging. This protocol can successfully generate SFEBs from both fibroblast and peripheral-blood mononuclear cell-derived hiPSCs. SFEBs made from peripheral blood mononuclear cell-derived hiPSCs exhibit similar morphological characteristics as those created from fibroblast-derived hiPSCs.
This process, like other 3-D schemes, utilizes small molecule extracellular cues to guide cell fate decisions. This is combined with the intrinsic properties of cell-to-cell contact, which create a more realistic environment for network formation and neuronal function. Other reports have shown that the appropriate combination of the small molecule extracellular signals is sufficient for such cell fate decisions such as midbrain dopaminergic8,22, and cortical interneurons8,16,23. However, 3-D systems exhibit an accelerated maturation time compared to 2-D equivalents5. When given adequate time, the 3-D cultures have shown increased maturity. Such qualities make strong arguments for the usefulness of the 3-D platforms like the SFEB. The added benefit of live and high quality microscopy, together with the flexibility of source material, make compelling arguments for this protocol.
Additionally, SFEBs made using this protocol share a number of similarities with other reported studies13,24. With respect to reference24, this protocol and the physiological validation of the neurons pre-dates it. For instance, the studies reported in references13,24, use similar versions of dual SMAD inhibition to derive cortical like neurons and obtained a similar proportion of glutamatergic neurons and progenitors (~50%). Additionally, Mariani, J. et al. (reference13) report similar Pax6 and Nestin staining as this protocol at a 25-30 day time points. Qualitatively, the staining patterns for Brn2 as well as the expression of GFAP positive astrocytes are similar to that reported in reference24. However, this protocol has a number of advantages over the two commonly used organoid methodologies. First, Mariani, J. et al.13 report the development of Dlx positive interneurons at day 50 and confirmed only by immunostaining methods. Using this protocol, Dlx positive interneurons are produce at day 30. These interneurons were confirmed as functional by single-cell electrophysiology and single cell pharmacological application of GABA16. Additionally, the authors of 13 claim functional connectivity of neurons, but it was determined only using staining. SFEBs made using this protocol have been subjected to network single-electrode stimulation and calcium imaging to show that developing cortical networks are connected and functional. Pasca, et al.24 section the aggregates using a cryostat to obtain recordings from organoid-like structures. SFEBs made using this protocol do not need sectioning and can be recorded directly while in the inserts1. Neurons recorded from non-sectioned SFEBs have been shown to have action potentials and inhibitory post-synaptic potentials after sorting1,16.
SFEBs can be made using both fibroblasts and PBMCs as starting material. It is also possible to use other tissue-types that result in hiPSCs (e.g. dental pulp, foreskin, urine)25,26,27, although some of the small molecules may need to be altered to achieve similar results. For this protocol, the use of DKK-1 is important in driving the SFEB towards a ventralized fate28. This ventralization is partially responsible for the differentiation of interneurons with CGE-like origins16. DKK-1 is an expensive small molecule and thus high concentrations of sonic hedgehog can be used to supplement DKK-1 in this protocol. However, the concentrations for Wnt inhibition via DKK-1 must be determined empirically by the end user. Additionally, XAV939, another Wnt inhibitor, can be used to help drive differentiation towards a ventralized fate, although the use of this inhibitor will yield tissue that shares transcriptional identities with the MGE23.
When developing 3D hiPSC culture systems like the SFEBs described in this protocol, it is important to keep in mind that these structures yield a moderate amount of heterogeneity from culture to culture. This is partially due to the stochastic nature of neuronal differentiation from iPSCs and due to cell-cell contact initiation in the SFEB resulting in spontaneous intrinsic self-organization29,30. Therefore, it is important to interpret the usefulness of this technique in the context of heterogeneity. Ways to minimize the impact of heterogeneity in this system include, creating large numbers of SFEBs so that they represent natural variation in the system, stringently adhering to the concentration of reagents and the number of cells seeded at the beginning of each production run. It is critical to start with clean iPSC colonies and to apply minimal trituration during the enzymatic dissociation step during iPSC dissociation to increase cell viability. Cell viability after trituration is an important factor in getting high quality, consistent SFEBs. As an alternative troubleshooting step, viability can be checked after the dissociation and before the centrifugation steps using trypan blue, if necessary. Viability and spontaneous differentiation can also be affected if ROCKi is not properly used during the early dissociation and differentiation steps. The use of ROCKi and its stepwise decrease during the 50% feeds over the first 7-10 days is critical for consistent, high-quality SFEBs.
Additionally, it is often useful as a validation step to check results in 3D SFEBs with those observed in the same cell lines created using a monolayer preparation. Understanding how the two systems cross-compare within each experimental cohort is extremely useful in understanding the complexity of a given disease model. Finally, SFEBs can be used to sort and purify cell populations using fluorescent activated cell sorting for further study in a more homogeneous 2D monolayer system16.
Nonetheless, SFEBs created using this protocol are useful for studying small developing cortical circuits. Future applications of this technique involve multiplexing electrophysiological recordings with high-content approaches. Indeed, cell chamber inserts are manufactured for use in 96-well plate format. These inserts can be used with the SFEB protocol described here in place of the 6-well inserts. In order to show scalability using this method, SFEBs will need to be created using multiple lines and clones within a given cohort and will need to be screened across a set of robust cell-based assays to look for consistency within cultures. For instance, neuronal numbers, morphology, and layer development can may be assayed using a 96-well format. Ideally, cell based assays should be combined with a high-content electrophysiological assay such as the MEA, which is also scalable to 96-well plates.
This SFEB platform has promise in deciphering the role of early cortical network development in neurological disorders, particularly in cases where there is a possible interaction between genetics and early neural development. We have demonstrated that it can be treated much like a slice culture as shown in rat and mouse studies. Useful future studies using this system should center on developmental comparative anatomy and physiology between in vivo structures of the mouse and the SFEB. This comparative data would be very powerful in developing a truly translational system for drug discovery and basic research.
Disclosures
The authors have no competing financial interests.
Acknowledgments
We thank Elizabeth Benevides for proofreading the article. We thank Drs. John Hussman and Gene Blatt for their helpful discussions and comments.
References
- Nestor MW, et al. Differentiation of serum-free embryoid bodies from human induced pluripotent stem cells into networks. Stem Cell Res. 2013;10(3):454–463. doi: 10.1016/j.scr.2013.02.001. [DOI] [PubMed] [Google Scholar]
- Eiraku M, et al. Self-organized formation of polarized cortical tissues from ESCs and its active manipulation by extrinsic signals. Cell Stem Cell. 2008;3(5):519–532. doi: 10.1016/j.stem.2008.09.002. [DOI] [PubMed] [Google Scholar]
- Sasai Y. Next-generation regenerative medicine: organogenesis from stem cells in 3D culture. Cell Stem Cell. 2013;12(5):520–530. doi: 10.1016/j.stem.2013.04.009. [DOI] [PubMed] [Google Scholar]
- Song S, Abbott LF. Cortical development and remapping through spike timing-dependent plasticity. Neuron. 2001;3(2):339–350. doi: 10.1016/s0896-6273(01)00451-2. [DOI] [PubMed] [Google Scholar]
- Pre D, et al. A time course analysis of the electrophysiological properties of neurons differentiated from human induced pluripotent stem cells (iPSCs) PLoS One. 2014;9(7):e103418. doi: 10.1371/journal.pone.0103418. [DOI] [PMC free article] [PubMed] [Google Scholar]
- Sproul AA, et al. Characterization and molecular profiling of PSEN1 familial Alzheimer's disease iPSC-derived neural progenitors. PLoS One. 2014;9(1):e84547. doi: 10.1371/journal.pone.0084547. [DOI] [PMC free article] [PubMed] [Google Scholar]
- Stoppini L, Buchs PA, Muller D. A simple method for organotypic cultures of nervous tissue. J Neurosci Methods. 1991;37(2):173–182. doi: 10.1016/0165-0270(91)90128-m. [DOI] [PubMed] [Google Scholar]
- Nicholas CR, et al. Functional maturation of hPSC-derived forebrain interneurons requires an extended timeline and mimics human neural development. Cell Stem Cell. 2013;12(5):573–586. doi: 10.1016/j.stem.2013.04.005. [DOI] [PMC free article] [PubMed] [Google Scholar]
- Cukier HN, et al. Exome sequencing of extended families with autism reveals genes shared across neurodevelopmental and neuropsychiatric disorders. Mol Autism. 2014;5(1) doi: 10.1186/2040-2392-5-1. [DOI] [PMC free article] [PubMed] [Google Scholar]
- Marchetto MC, et al. A model for neural development and treatment of Rett syndrome using human induced pluripotent stem cells. Cell. 2010;143(4):527–539. doi: 10.1016/j.cell.2010.10.016. [DOI] [PMC free article] [PubMed] [Google Scholar]
- Choi SH, Tanzi RE. iPSCs to the rescue in Alzheimer's research. Cell Stem Cell. 2012;10(3):235–236. doi: 10.1016/j.stem.2012.02.011. [DOI] [PubMed] [Google Scholar]
- Yagi T, et al. Modeling familial Alzheimer's disease with induced pluripotent stem cells. Hum Mol Genet. 2011;20(23):4530–4539. doi: 10.1093/hmg/ddr394. [DOI] [PubMed] [Google Scholar]
- Mariani J, et al. Modeling human cortical development in vitro using induced pluripotent stem cells. Proc Natl Acad Sci U S A. 2012;109(31):12770–12775. doi: 10.1073/pnas.1202944109. [DOI] [PMC free article] [PubMed] [Google Scholar]
- Quadrato G, Brown J, Arlotta P. The promises and challenges of human brain organoids as models of neuropsychiatric disease. Nat Med. 2016;22(11):1220–1228. doi: 10.1038/nm.4214. [DOI] [PubMed] [Google Scholar]
- Nestor MW, et al. Human Inducible Pluripotent Stem Cells and Autism Spectrum Disorder: Emerging Technologies. Autism Res. 2016;9(5):513–535. doi: 10.1002/aur.1570. [DOI] [PubMed] [Google Scholar]
- Nestor MW, et al. Characterization of a subpopulation of developing cortical interneurons from human iPSCs within serum-free embryoid bodies. Am J Physiol Cell Physiol. 2015;308(3):C209–C219. doi: 10.1152/ajpcell.00263.2014. [DOI] [PMC free article] [PubMed] [Google Scholar]
- Nestor MW, Hoffman DA. Differential cycling rates of Kv4.2 channels in proximal and distal dendrites of hippocampal CA1 pyramidal neurons. Hippocampus. 2012;22(5):969–980. doi: 10.1002/hipo.20899. [DOI] [PMC free article] [PubMed] [Google Scholar]
- Nestor MW, Mok LP, Tulapurkar ME, Thompson SM. Plasticity of neuron-glial interactions mediated by astrocytic EphARs. J Neurosci. 2007;27(47):12817–12828. doi: 10.1523/JNEUROSCI.2442-07.2007. [DOI] [PMC free article] [PubMed] [Google Scholar]
- Woodard CM, Campos BA, Kuo SH, Nirenberg MJ, Nestor MW, Zimmer M, Mosharov EV, Sulzer D, Zhou H, Paull D, Clark L, Schadt EE, Sardi SP, Rubin L, Eggan K, Brock M, Lipnick S, Rao M, Chang S, Li A, Noggle SA. iPSC-Derived Dopamine Neurons Reveal Differences Between Monozygotic Twins Discordant for Parkinson's Disease. Cell Rep. 2014;9(4):1173–1182. doi: 10.1016/j.celrep.2014.10.023. [DOI] [PMC free article] [PubMed] [Google Scholar]
- Huang SM, et al. Tankyrase inhibition stabilizes axin and antagonizes Wnt signalling. Nature. 2009;461(7264):614–620. doi: 10.1038/nature08356. [DOI] [PubMed] [Google Scholar]
- Chambers SM, et al. Highly efficient neural conversion of human ES and iPS cells by dual inhibition of SMAD signaling. Nat Biotechnol. 2009;27(3):275–280. doi: 10.1038/nbt.1529. [DOI] [PMC free article] [PubMed] [Google Scholar]
- Kriks S, et al. Dopamine neurons derived from human ES cells efficiently engraft in animal models of Parkinson's disease. Nature. 2011;480(7378):547–551. doi: 10.1038/nature10648. [DOI] [PMC free article] [PubMed] [Google Scholar]
- Maroof AM, et al. Directed differentiation and functional maturation of cortical interneurons from human embryonic stem cells. Cell Stem Cell. 2013;12(5):559–572. doi: 10.1016/j.stem.2013.04.008. [DOI] [PMC free article] [PubMed] [Google Scholar]
- Pasca AM, et al. Functional cortical neurons and astrocytes from human pluripotent stem cells in 3D culture. Nat Methods. 2015;12(7):671–678. doi: 10.1038/nmeth.3415. [DOI] [PMC free article] [PubMed] [Google Scholar]
- Yan X, et al. iPS cells reprogrammed from human mesenchymal-like stem/progenitor cells of dental tissue origin. Stem Cells Dev. 2010;19(4):469–480. doi: 10.1089/scd.2009.0314. [DOI] [PMC free article] [PubMed] [Google Scholar]
- Wang J, et al. Generation of clinical-grade human induced pluripotent stem cells in Xeno-free conditions. Stem Cell Res Ther. 2015;6:223. doi: 10.1186/s13287-015-0206-y. [DOI] [PMC free article] [PubMed] [Google Scholar]
- Kwon J, et al. Neuronal Differentiation of a Human Induced Pluripotent Stem Cell Line (FS-1) Derived from Newborn Foreskin Fibroblasts. Int J Stem Cells. 2012;5(2):140–145. doi: 10.15283/ijsc.2012.5.2.140. [DOI] [PMC free article] [PubMed] [Google Scholar]
- Li XJ, et al. Coordination of sonic hedgehog and Wnt signaling determines ventral and dorsal telencephalic neuron types from human embryonic stem cells. Development. 2009;136(23):4055–4063. doi: 10.1242/dev.036624. [DOI] [PMC free article] [PubMed] [Google Scholar]
- Sheridan SD, Surampudi V, Rao RR. Analysis of embryoid bodies derived from human induced pluripotent stem cells as a means to assess pluripotency. Stem Cells Int. 2012. p. 738910. [DOI] [PMC free article] [PubMed]
- Smith Q, Stukalin E, Kusuma S, Gerecht S, Sun SX. Stochasticity and Spatial Interaction Govern Stem Cell Differentiation Dynamics. Sci Rep. 2015;5:12617. doi: 10.1038/srep12617. [DOI] [PMC free article] [PubMed] [Google Scholar]


