Abstract
The purpose of this protocol is to explain how to examine the relationship between working memory processes and anxiety by combining the Sternberg Working Memory (WM) and the threat of shock paradigms. In the Sternberg WM paradigm, subjects are required to maintain a series of letters in the WM for a brief interval and respond by identifying whether the position of a given letter in the series matches a numerical prompt. In the threat of shock paradigm, subjects are exposed to alternating blocks where they are either at risk of receiving unpredictable presentations of a mild electric shock or are safe from the shock. Anxiety is probed throughout the safe and threat blocks using the acoustic startle reflex, which is potentiated under threat (Anxiety-Potentiated Startle (APS)). By conducting the Sternberg WM paradigm during the threat of shock and probing the startle response during either the WM maintenance interval or the intertrial interval, it is possible to determine the effect of WM maintenance on APS.
Keywords: Behavior, Issue 125, Working memory, Sternberg, attention control, maintenance, anxiety, anxiety-potentiated startle
Introduction
According to the Attention Control Theory (ACT), anxiety interferes with cognitive processing by competing for access to limited Working Memory (WM) resources1. However, the ACT does not address the inverse of this relationship (i.e. the effect of cognitive processing on anxiety). By manipulating anxiety during cognitive tasks using the threat of shock paradigm, it is possible to assess both the effect of anxiety on cognition and the effect of cognition on anxiety2,3,4,5. The purpose of this protocol is to demonstrate how to administer the Sternberg WM paradigm during threat of shock paradigm to probe the bi-directional relationship between anxiety and WM maintenance.
The threat of shock paradigm is widely used in the laboratory to manipulate state anxiety6,7,8,9,10,11 and can be implemented in healthy subjects2,3,4,5 and patients12,13,14,15 alike (see Bradford et al.16 for an example). The paradigm consists of alternating blocks of threat and safety17. Subjects are at risk of receiving unpredictable electrical stimulations during the threat blocks, but not during the safe blocks. Subjects' anxiety can be probed periodically using the acoustic startle reflex18,19. Subjects typically show larger startle responses during the threat blocks compared to the safe blocks, and this Anxiety-Potentiated Startle (APS) can be used as a peripheral index of change in the ongoing anxiety during the test17,18. Potentiated startle in the threat of shock paradigm is recognized by the National Institute of Mental Health (NIMH) as a physiological index of anxiety in their Research Domain Criteria matrix20. However, it is also possible to probe an individual's anxiety using a self-report Likert-type scale. Because threat of shock is a passive paradigm, other cognitive tasks can be conducted simultaneously21. By combining the threat of shock with the Sternberg WM task, it is possible to probe anxiety during WM maintenance3.
During the Sternberg WM paradigm, subjects are required to encode a series of letters in WM and respond after a brief interval3,22. Unlike more complex WM tasks (e.g., the N-back task)4,5,23, the Sternberg task does not require the manipulation of information in the WM3,22. In addition, subjects encode, maintain, and respond to items during distinct intervals. Together, these features make it possible to dissociate WM maintenance from other, more complex cognitive processes24. By probing APS during the WM maintenance interval, it is possible to determine the effect of WM maintenance on anxiety. Likewise, by comparing WM accuracy and Reaction Time (RT) between the threat and safe blocks, it is possible to determine the effect of anxiety on WM maintenance. This protocol will detail the procedural steps necessary to conduct the Sternberg WM paradigm during threat of shock, as well as the analytical steps necessary to assess APS, accuracy, and reaction time during the task.
Protocol
All participants gave written informed consent approved by the National Institute of Mental Health (NIMH) Combined Neuroscience Institutional Review Board (IRB) and were compensated for participating.
1. Set Up the Equipment
NOTE: Set up the equipment as described below (see Figure 1A)3.
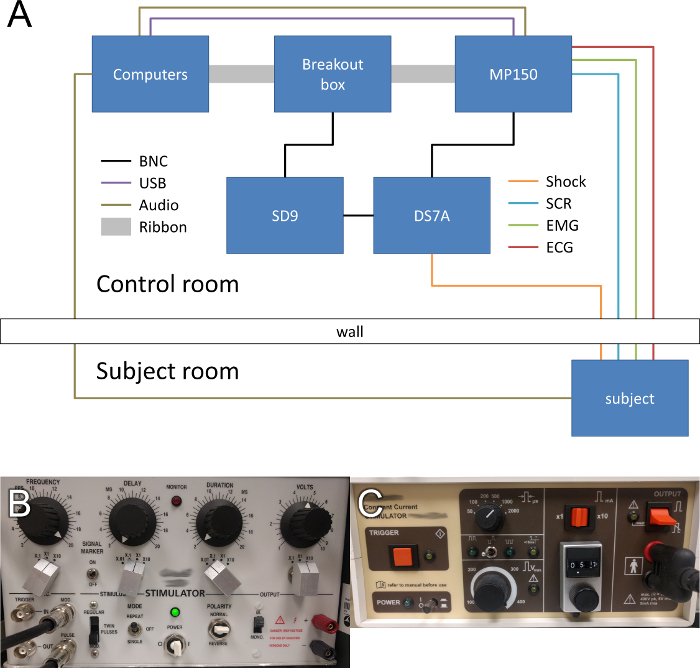
In the control room, set up two computers, one to administer the experiment, and one to record the physiological data.
In the subject room, set up a standard 19 in liquid crystal display monitor and keyboard (or button box) to display stimuli to the participant and to record participant responses, respectively.
To record the psychophysiology, connect the recording computer to the psychophysiology monitoring hardware using an Ethernet to USB adapter.
To split the Transistor-Transistor Logic (TTL) signals between the recording and stimulus delivery hardware, connect the parallel port of the experiment computer to the breakout box using a ribbon cable.
To pass the TTL signals to the psychophysiology monitoring hardware, connect the breakout box to the hardware using a ribbon cable.
To pass the TTL pulses to the stimulus delivery hardware, connect the breakout box to the signal generator using a Bayonet Neill-Concelman (BNC) cable.
To generate a control signal for the shock device, connect the signal generator to the shock device using a BNC cable.
Set the signal generator and shock device to deliver a 100 ms, 200 Hz shock. See Figure 1B and C for all settings.
2. Program the Experiment Using Available Software
NOTE: A neurobehavioral systems software (here referred to as the experimental software; see the Table of Materials) was used. Other equivalent software can be used.
- Program four testing phases using the parameters described below and the supplementary code files provided (see the supplemental code for details).
- For each phase, program 26 trials.
- Divide the trials into 4 alternating blocks of threat and safety, with 6 trials per block.
- At the beginning of each trial, present a cue indicating how many letters will be presented for 2,000 ms each.
- After the cue, present the encoding letter sequence for 2,500 ±1,000 ms.
- On low-load trials, present 5 letters sequentially, one after the other.
- On high-load trials, present 8 letters sequentially, one after the other.
- Program a maintenance period following the encoding phase for 9,000 ±1,000 ms.
- At the end of the maintenance period, present a response prompt for 2,000 ms.
- Program the response prompt to display a letter on the left side and a number on the right side of the monitor, with the letter representing a letter from the encoding sequence, and the number referring to a position in the sequence.
- Underneath the letter and number, display the words "match/mismatch," referring to if the letter matched or mismatched the position number.
- Program the experiment so that half of the trials match and half mismatch.
- Use a keyboard or button box to record responses.
- Separate the trials by a variable-duration intertrial interval (ITI) that is dependent upon the timing of the within-trial events such that each trial is 23 s long.
- Vary the durations of the encoding, maintenance, and ITI periods across trials by selecting a random duration (in ms) between the ceiling and floor values for each period.
- Counterbalance the experiments to have half of the participants start in a safe block and half of the participants start in a threat block.
- In each run, present between 0 and 2 pseudorandom shocks during each of the threat blocks for a total of 3 shock presentations per run. Make sure to include an extra (dummy) trial for each shock to ensure that the same number of trials are included in the safe and threat blocks.
- At the beginning of each run, present five 40 ms bursts of 103 dB white noise (near-instantaneous rise/fall times) over headphones to habituate the startle response.
- During each run, present 3 presentations of the white noise during the following conditions to probe the startle response (see Figure 3): safe versus threat, low load versus high load, and maintenance period versus ITI.
- Space the probes so that they occur with a minimum interprobe interval of at least 17 s to avoid the short-term habituation of the startle response.
- For maintenance period trials, present probes no less than 1 s after the offset of the letter series.
- For ITI trials, present probes no less than 4 s after the offset of the response prompt.
- Set up the equipment for physiological monitoring using the associated software package, as per the manufacturer's instructions.

3. Run the Experiment
Escort the participants to the study room.
Administer informed consent.
Give the participants the State-Trait Anxiety Inventory Y-1 (STAI-Y1)25, the Beck Anxiety Inventory (BAI)26, the Beck Depression Inventory (BDI)27, and the Anxiety Sensitivity Index (ASI)28 to fill out prior to task instructions and set up.
Inform the participants that they will see 2 types of trials and will respond to those trials based on the following details.
During the low-load trials, instruct the participants to maintain a series of 5 letters in their memory in the order in which they are presented.
During the high-load trials, instruct the participants to maintain a series of 8 letters in their memory in the order in which they are presented.
Inform the participants that, after a delay, they will be prompted with a letter and a number that refers to the position in the sequence.
Instruct the participants to indicate whether the letter and position number match or mismatch the trial sequence using the left or right arrow key, respectively.
Inform the participants that trials will occur during periods of safety and periods of threat, when they are at risk of receiving unpredictable mild electrical shocks to the wrist.
Inform the participants that they will hear acoustic startle probes throughout the experiment, in both the safe and threat conditions.
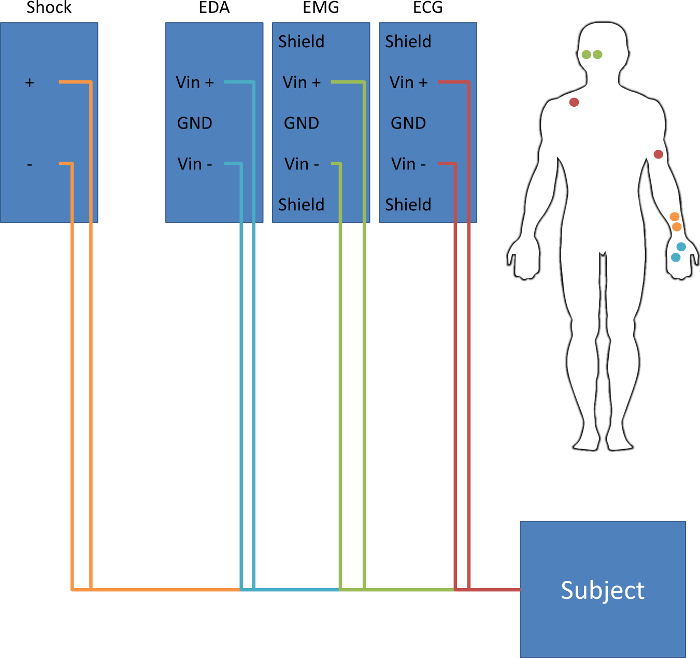
- Clean and attach electrodes to each participant, based on the diagram in Figure 2.
- Place two disposable 11 mm silver-silver chloride (Ag-AgCl) electrodes on the palm of the left hand, about 2 cm apart, to monitor skin conductance.
- Place two disposable 11 mm Ag-AgCl electrodes on the inner wrist of the left hand, about 3 cm apart, to administer the electrical stimulation.
- Place one disposable 11 mm Ag-AgCl electrode on the inside of the left arm, just above the elbow, and one disposable electrode just under the right clavicle to monitor the heart rate.
- Attach two 4 mm Ag-AgCl cup electrodes to the lower side of the left orbicularis oculi muscle to measure the startle response.
Secure all electrodes with biomedical tape.
Attach leads to the electrodes on the palm and plug them into the EDA channel of the psychophysiology monitoring hardware.
Attach leads to the electrodes on the wrist and plug them into the shock device.
Attach leads to the electrodes on the arm and clavicle and plug them into the ECG channel of the psychophysiology monitoring hardware.
Plug the cup electrodes attached to the orbicularis oculi muscle into the electromyography (EMG) channel of the psychophysiology monitoring hardware.
- Shock calibration.
- Prior to the start of the experiment, have the participants rate a series of 100-ms sample electrical stimulations to identify an intensity level that is unpleasant and uncomfortable, but not painful.
- Administer a series presentation (~5-10) of the 100 ms shock stimulus to the wrist using the experimental software package (see supplemental code files and the Table of Materials).
- After each presentation, have participants verbally rate each presentation on a scale from 1 (not uncomfortable at all) to 10 (uncomfortable but not painful).
- Using the mA scale on the shock device, gradually increase the intensity of the shock and continue the series of stimulations the until subject rates the stimulation as a "10."
- Record the intensity value on the participant detail packet. NOTE: During the study, present the shocks at the determined intensity.
To start the experiment, enter the participant ID number, counterbalance condition, and run number into the run box, as prompted by the experiment software. NOTE: Create two counterbalanced conditions. The first counterbalance will start the experiment in a threat block, and the second counterbalance will start the experiment in a safe block. See section 2.
Click "start" on the psychophysiology monitoring recording.
Press "enter" on the experimental software prompt box to start the experiment.
Allow the subject to complete 4 runs of the experiment. Have the participant select the left or right arrow key if the letter and position number match or mismatch the trial sequence, respectively (steps 3.7 and 3.8). NOTE: Program each run length to last between 6 and 7 min. Program the shocks to be delivered pseudo-randomly between 0-2 times/run. See section 2.
After each run, have the subject verbally rate their anxiety level on a scale from 0 (not anxious) - 10 (extremely anxious) during the safe and threat blocks of the run they just completed.
Have the subjects verbally rate the intensity of the shocks presented during the previous run on the same 0-10 scale used in the initial calibration procedure (section 3.17).
4. Analyze the Performance
NOTE: Analyze the performance data for a single participant using the following instructions.
- Open the output file created from the experiment software.
- To average the correct responses across the different conditions, first separate the data into safe versus threat and low load versus high load to yield 4 unique conditions of response data.
- Count the correct trials for each of the 4 conditions and divide this number by the total number of trials in each condition.
- To average the reaction time across the different conditions, separate the data as in step 4.1.1.
- Sum all the reaction times for each condition and divide this number by the number of trials in each condition. NOTE: Omit trials that include a shock presentation, as indicated in the experimental software output.
At the group level, perform a 2 (safe versus threat) x 2 (low load versus high load) ANOVA across subjects to identify differences in behavioral performance and reaction times29.
5. Analyze Startle
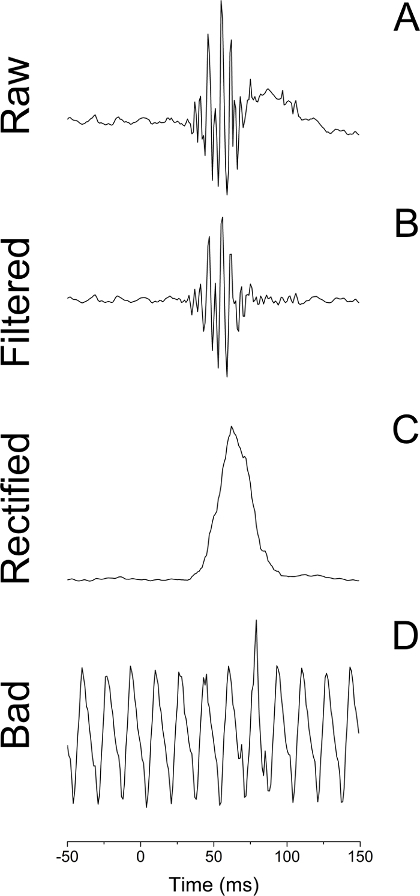
- Prepare the raw EMG data for analysis using psychophysiology analysis software30. See Figure 4A.
- Select "Transform" >> Digital Filters >> FIR >> Bandpass from the psychophysiology analysis software to apply a digital bandpass filter (30-300 Hz passband), smoothing the raw EMG channel (see Figure 4B).
Select Analysis >> Electromyography >> Derive Average Rectified EMG from the psychophysiology analysis software to rectify the smoothed EMG signal using a time-windowed mean of 20 ms (see Figure 4C).
Select Analysis >> Stim-Response >> Digital Input to Stim Events from the psychophysiology analysis software to label the stimulus events that correspond to the digital inputs for each trial type. NOTE: For example, trial types include safe versus threat, low load versus high load, and maintenance period versus ITI period.
- Extract the blink magnitude around each stimulus event30.
- Select Analysis >> Stim-Response >> Stim-Response Analysis and specify the Mean of Channel (i.e., the channel number corresponding to the processed EMG) from the psychophysiology analysis software to extract the mean baseline activity in a fixed window of -50 to 0 ms preceding the onset of the white noise.
- Select Analysis >> Stim-Response >> Stim-Response Analysis and specify the Max of Channel (i.e., the channel number corresponding to the processed EMG) from the psychophysiology analysis software to identify the blink onset and peak in a fixed window of 20 to 100 ms following the onset of the white noise.
Exclude trials with excessive noise on the EMG channel30. NOTE: The acoustic startle responses must be reliably distinguished from excessive background EMG activity or other sources of contamination (e.g., movement artifacts or voluntary and spontaneous blinks immediately preceding auditory probes; see Figure 4D).
- Analyze the trial-by-trial blink responses using a standard spreadsheet software.
- Normalize the blink magnitudes into z-scores (optional).
- Convert the z-scores to t-scores for further analysis (t = 10x + 50; optional).
- Average the t-scores and/or raw scores across trials for each trial type and calculate the APS (threat versus safe) for each condition (e.g., low load versus high load and maintenance period versus ITI period).
- At the group level, perform a 2 (safe versus threat) x 2 (maintenance period versus ITI) ANOVA across subjects to identify the effect of WM maintenance on APS.
6. Analyze the Self-report Data
Average the anxiety ratings across runs for the safe and threat conditions.
At the group level, perform a threat versus safe t-test to determine the effectiveness of the threat manipulation.
Representative Results
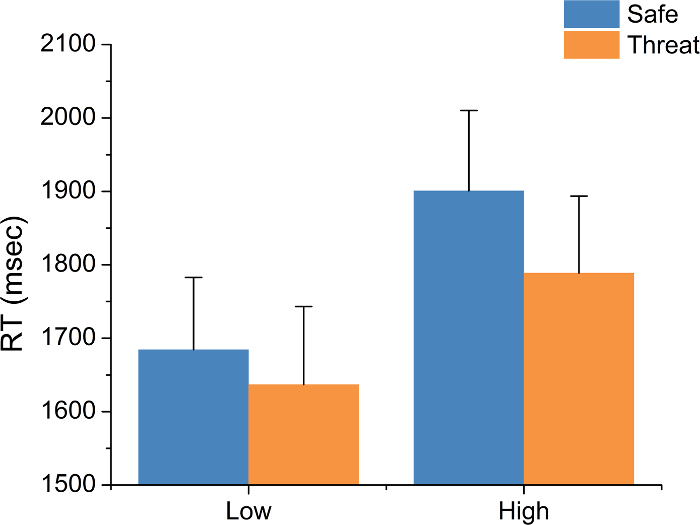
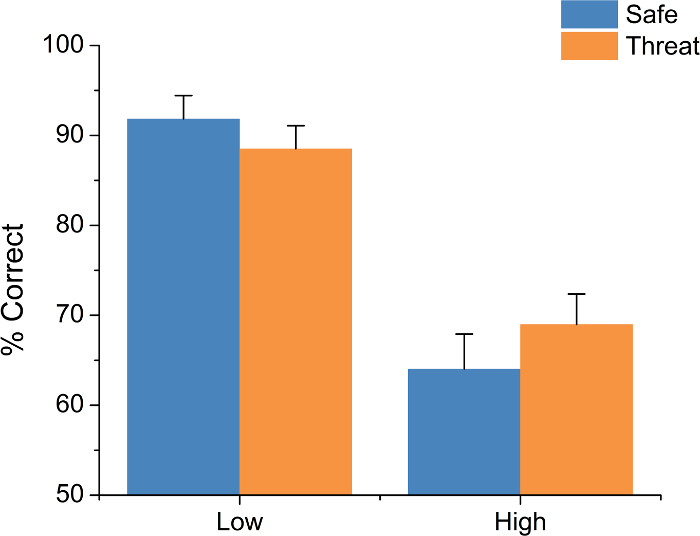
This protocol yields three primary data types: accuracy, RT, and APS. For accuracy and RT, this protocol involves two experimental manipulations, threat and load. For accuracy, typical results show a main effect of load but no main effect of threat and no load-by-threat interaction (trials (F(1,18) = 84.34; p <0.01; see Figure 5). Subjects are typically more accurate on the low-load than the high-load trials. For RT, typical results show a main effect of both load (F(1,18) = 19.49; p <0.01) and threat (F(1,18) = 8.03; p = 0.01) but no load-by-threat interaction (see Figure 6). Subjects typically show faster RTs during low-load trials than during high-load trials and faster RTs during threat blocks than during safe blocks.
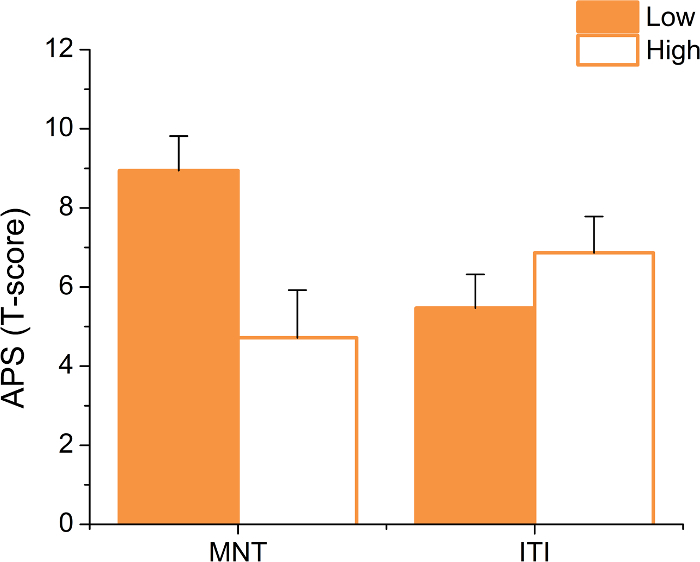
This protocol also involves two experimental manipulations for APS: load and startle timing. Typical results show a load-by-timing interaction (F(1,18) = 16.63; p <0.01; see Figure 7). Subjects typically show significantly larger APS during low load vs. high load trials, but only when the startle probe is delivered during the maintenance interval (MNT; maintenance period: t(18) = 3.92; p <0.01; ITI: p >0.05; d = 0.72). It should be noted that, because inferential statistics can vary from study to study, it is important to replicate these effects. After this experiment, a consistent decrease in APS as a function of task difficulty was found. This finding was observed in a verbal N-back task (3-back > 0-back d(25) = 2.2)4, the Sternberg WM paradigm (see above, d(18) = 0.72; for replication, see Experiment 1 in Balderston et al. 20163; high load > low load, d(18) = 0.44), and a complex picture recognition task (retrieval > encoding, d(21) = 0.47)2. However, it should be noted that the final result may be driven in part by habituation.
Although it is difficult to determine an individual's subjective affective state during each trial, self-report data can be used to determine the effectiveness of the anxiety manipulation and as an individual difference measure. Therefore, it is important to assess the subject's affective state prior to the experiment using standardized questionnaires and to probe the subject's anxiety during the experiment. Typical results show significantly higher anxiety ratings during the threat blocks than during the safe blocks; t(18) = 8.85; p <0.001.
Figure 1: Schematic of a Typical Equipment Setup. (A) Use separate computers to administer the task and record physiological signals from the subject. Synchronize events with the psychophysiology monitoring hardware and the shock device via the parallel port of the experiment computer. Relay the physiological signals from the psychophysiology monitoring hardware to the acquisition computer via the Ethernet cable. Deliver the shock to the subject using the shock device, which is controlled by a signal generator and triggered by the task computer. Deliver the white noise to the subject via the sound card of the task computer and record the trace using the psychophysiology monitoring hardware. (B) Required settings for the signal generator. (C) Required settings for the shock device. Please click here to view a larger version of this figure.
Figure 2: Schematic of a Typical Subject Setup. Attach electrodes to deliver the shock to the subject's non-dominant wrist. Attach electrodes to measure skin conductance on the subject's non-dominant palm. Attach electrodes to measure electromyography below the right eye, over the orbicularis oculi muscle. Attach electrodes to measure electrocardiography on the subject's left bicep and right clavicle. Please click here to view a larger version of this figure.
Figure 3: Schematic of Typical Experimental Design. Present the subjects with a series of letters followed by a brief maintenance period and a response prompt. During the response prompt, present the subjects with a letter (from the series) and a number. Instruct the subjects to indicate whether the number matches the position of the target letter in the previous series. Present startle probes during each trial, either during the maintenance period or the intertrial interval (ITI). Please click here to view a larger version of this figure.
Figure 4: Example EMG Traces Following a White Noise Probe. (A) Raw EMG trace. (B) EMG trace bandpass filtered at 30 to 500 Hz. (C) EMG trace that has been both filtered and rectified using a 20 ms constant. (D) Raw EMG trace from a trial contaminated by baseline noise. Please click here to view a larger version of this figure.
Figure 5: Typical Reaction Time (RT) Results. Subjects are typically faster during low-load trials than during high-load trials. Subjects are also typically faster under threat of shock. Bars represent the mean ± SEM. Please click here to view a larger version of this figure.
Figure 6: Typical Anxiety-potentiated Startle (APS) Results. When startle is probed during the maintenance period (MNT), subjects typically show larger startle potentiation on low-load compared to high-load trials. However, this effect does not hold when startle is probed during the ITI. Bars represent the mean ±SEM. Please click here to view a larger version of this figure.
Figure 7: Typical Accuracy (percent (%) correct) Results. Subjects are typically more accurate during low load trials than high load trials; however, performance does not tend to vary as a function of threat of shock. Bars represent the mean ± SEM. Please click here to view a larger version of this figure.
Supplemental Code Files: Wav file for white noise presentation (40ms_wn.wav.) Please click here to download this file. Code necessary to setup hardware parameters for experimental software (Sternberg_threat_v5.exp.) Please click here to download this file. Code necessary to run experiment (Sternberg_threat_v5.sce.). Please click here to download this file.
Discussion
This paper demonstrates how to administer the Sternberg WM task during threat of shock. Using this protocol, it was possible to show that WM maintenance is sufficient to reduce anxiety, as measured by the potentiation of the acoustic startle reflex3. These results suggest that the relationship between cognition and anxiety is bidirectional3-5 and that models of anxiety (e.g., the attentional control theory)1 must explain the effect of cognition on anxiety in addition to the effect of anxiety on cognition. Although the current protocol describes the integration of the Sternberg WM task and the threat of shock paradigm, it can also serve as a framework for studying the relationship between cognition and anxiety more generally21.
By redesigning existing cognitive tasks to take place during alternating periods of safety and threat, it is possible to study the effect of anxiety on specific cognitive processes, like WM and sustained attention2,31,32. For instance, in previous work, the N-back working memory task was integrated with the threat of shock paradigm, demonstrating that anxiety interferes with WM at a low load but not a high load4,5. These results suggest that anxiety interferes with WM, but also that healthy individuals are capable of overcoming anxiety when task demands are high. The Sustained Attention to Response Task (SART) was also integrated with the threat of shock paradigm; subjects had to inhibit their responses to infrequent target stimuli. This demonstrated that the threat of shock increases the accuracy on NoGo trials during the task31,32. Together with the N-back studies, these results suggest that anxiety can both impair and facilitate performance, and that the direction of the effect depends on the specific cognitive processes engaged by the task.
Likewise, by adding precisely timed startle probes to an existing cognitive task that has been adapted to the threat of shock paradigm, it is possible to study the effect of specific cognitive tasks on anxiety. The relationship between the WM load and anxiety was initially observed during the N-back WM tasks, where increasing the number of to-be-maintained items reduced APS4,5. However, because this task requires both maintenance and manipulation, it was difficult to determine which WM components were necessary for the observed reduction in anxiety23,33. By following up these studies with the simpler Sternberg WM paradigm, it was possible to show that central executive processing was not necessary for anxiety reduction3.
This technique can be used to study both the effect of anxiety on cognition, as well as the effect of cognition on anxiety. Accordingly, it is important to manipulate both anxiety and cognitive load in this paradigm and to take reliable measures of each. When applying this method to novel cognitive paradigms, it is important to ensure that the cognitive paradigm has distinguishable levels of difficulty based on performance. If pilot testing does not show differences in performance across experimental conditions, check for ceiling/floor effects and adjust the difficulty of the task accordingly. Likewise, it is important to design the threat of shock manipulation such that it is possible to observe APS during conditions of low cognitive load. If pilot testing does not show differences in startle during conditions of low cognitive load, try checking the signal-to-noise ratio in the EMG channel.
There are 3 critical steps to ensuring the effectiveness of this protocol. First, it is important to ensure that the subject understands the cognitive task being implemented. If necessary, design a practice version of the task to ensure that the subjects understand the instructions. Second, it is important to ensure that the electrical stimulation used is of a sufficient intensity to induce anxiety in the subject. If necessary, recalibrate the intensity of the electrical stimulation after each run. Third, it is important to ensure that the signal-to-noise ratio of the EMG channel is sufficient to recover the acoustic startle response. If the channel is noisy or the impedance is too high, thoroughly clean the skin under the eye and reapply the EMG electrodes.
Although there are a number of strengths to this paradigm, there are also limitations that should be addressed. For instance, the use of aversive electrical shock can raise concern among some IRBs, especially when dealing with vulnerable populations. It should be noted that there are alternative approaches to induce anxiety besides using electric shock. These include breathing elevated levels of CO2 (7.5%) for extended periods (8-20 min)34, using the threat of an aversive thermal stimulus35, presenting negatively valenced pictures36, etc. However, it should be noted that electrical stimuli are safe (when used properly), widely used, and effective. Although this protocol recommends a standardization approach to analyze potentiated startle, raw scores may be more reliable in some cases9,10. If standardized scores are used, it is recommended to examine the raw scores as well.
The strength of this protocol is that it allows the researcher to flexibly manipulate state anxiety within-subject in a single session and to test the relationship between anxiety and specific cognitive processes. There are three potential future applications of this protocol. First, it is important to understand how cognitive and emotional systems interact at the level of neural processes. Future studies should examine the relationship between anxiety and WM maintenance-related neural activity, using this paradigm while recording BOLD activity. Second, it is important to generalize these findings to other cognitive processes, such as sustained attention and reward processing. Future studies using this protocol should manipulate these processes during periods of threat and safety. Third, it is important to understand the relationship between cognition and anxiety, in both healthy individuals and in patient populations. Future studies using this protocol should include individuals from these special populations.
In conclusion, this work presents a protocol for studying the relationship between WM load and induced anxiety. Studies using this paradigm have shown that WM maintenance is sufficient to reduce anxiety but that anxiety does not interfere with the WM load itself. Although the findings presented here are specific to the Sternberg WM paradigm, this protocol can be adapted to study the bidirectional relationship between cognition and anxiety in general.
Disclosures
The authors report no conflicts of interest.
Acknowledgments
Financial support for this study was provided by the Intramural Research Program of the National Institute of Mental Health, ZIAMH002798 (ClinicalTrial.gov Identifier: NCT00026559: Protocol ID 01-M-0185).
References
- Eysenck MW, Derakshan N, Santos R, Calvo MG. Anxiety and cognitive performance: attentional control theory. Emotion. 2007;7(2):336–353. doi: 10.1037/1528-3542.7.2.336. [DOI] [PubMed] [Google Scholar]
- Balderston NL, Mathur A, Adu-Brimpong J, Hale EA, Ernst M, Grillon C. Effect of anxiety on behavioural pattern separation in humans. Cogn. Emot. 2015;9931(10):1–11. doi: 10.1080/02699931.2015.1096235. [DOI] [PMC free article] [PubMed] [Google Scholar]
- Balderston NL, et al. Working memory maintenance is sufficient to reduce state anxiety. Psychophysiology. 2016;53(11):1660–1668. doi: 10.1111/psyp.12726. [DOI] [PMC free article] [PubMed] [Google Scholar]
- Vytal KE, Cornwell BR, Arkin N, Grillon C. Describing the interplay between anxiety and cognition: From impaired performance under low cognitive load to reduced anxiety under high load. Psychophysiology. 2012;49(6):842–852. doi: 10.1111/j.1469-8986.2012.01358.x. [DOI] [PMC free article] [PubMed] [Google Scholar]
- Vytal KE, Cornwell BR, Letkiewicz AM, Arkin NE, Grillon C. The complex interaction between anxiety and cognition: insight from spatial and verbal working memory. Front. Hum. Neurosci. 2013;7:93. doi: 10.3389/fnhum.2013.00093. [DOI] [PMC free article] [PubMed] [Google Scholar]
- Nelson BD, Hodges A, Hajcak G, Shankman SA. Anxiety sensitivity and the anticipation of predictable and unpredictable threat: Evidence from the startle response and event-related potentials. J. Anxiety Disord. 2015;33:62–71. doi: 10.1016/j.janxdis.2015.05.003. [DOI] [PMC free article] [PubMed] [Google Scholar]
- Shankman Sa, et al. A psychophysiological investigation of threat and reward sensitivity in individuals with panic disorder and/or major depressive disorder. J. Abnorm. Psychol. 2013;122(2):322–338. doi: 10.1037/a0030747. [DOI] [PMC free article] [PubMed] [Google Scholar]
- Dunning JP, Deldonno S, Hajcak G. The effects of contextual threat and anxiety on affective startle modulation. Biol. Psychol. 2013;94(1):130–135. doi: 10.1016/j.biopsycho.2013.05.013. [DOI] [PubMed] [Google Scholar]
- Bradford DE, Starr MJ, Shackman AJ, Curtin JJ. Empirically based comparisons of the reliability and validity of common quantification approaches for eyeblink startle potentiation in humans. Psychophysiology. 2015;52(12):1669–1681. doi: 10.1111/psyp.12545. [DOI] [PMC free article] [PubMed] [Google Scholar]
- Kaye JT, Bradford DE, Curtin JJ. Psychometric properties of startle and corrugator response in NPU, affective picture viewing, and resting state tasks. Psychophysiology. 2016;53(8):1241–1255. doi: 10.1111/psyp.12663. [DOI] [PMC free article] [PubMed] [Google Scholar]
- Bradford DE, Kaye JT, Curtin JJ. Not just noise: Individual differences in general startle reactivity predict startle response to uncertain and certain. Psychophysiology. 2014;51(5):407–411. doi: 10.1111/psyp.12193. [DOI] [PMC free article] [PubMed] [Google Scholar]
- Grillon C. Models and mechanisms of anxiety: Evidence from startle studies. Psychopharmacology (Berl) 2008;199:421–437. doi: 10.1007/s00213-007-1019-1. [DOI] [PMC free article] [PubMed] [Google Scholar]
- Grillon C, Ameli R, Goddard A, Woods SW, Davis M. Baseline and fear-potentiated startle in panic disorder patients. Biol. Psychiatry. 1994;35(7):431–439. doi: 10.1016/0006-3223(94)90040-x. [DOI] [PubMed] [Google Scholar]
- Morgan Ca, Grillon C, Southwick SM, Davis M, Charney DS. Fear-potentiated startle in posttraumatic stress disorder. Biol. Psychiatry. 1995;38(6):378–385. doi: 10.1016/0006-3223(94)00321-S. [DOI] [PubMed] [Google Scholar]
- Robinson OJ, Overstreet C, Allen PS, Pine DS, Grillon C. Acute tryptophan depletion increases translational indices of anxiety but not fear: serotonergic modulation of the bed nucleus of the stria terminalis? Neuropsychopharmacology. 2012;37(8):1963–1971. doi: 10.1038/npp.2012.43. [DOI] [PMC free article] [PubMed] [Google Scholar]
- Bradford DE, Magruder KP, Korhumel RA, Curtin JJ. Using the Threat Probability Task to Assess Anxiety and Fear During Uncertain and Certain Threat. J Vis Exp. 2014. p. e51905. [DOI] [PMC free article] [PubMed]
- Schmitz A, Grillon C. Assessing fear and anxiety in humans using the threat of predictable and unpredictable aversive events (the NPU-threat test) Nat. Protoc. 2012;7(3):527–532. doi: 10.1038/nprot.2012.001. [DOI] [PMC free article] [PubMed] [Google Scholar]
- Grillon C, Ameli R. Effects of threat of shock, shock electrode placement and darkness on startle. Int. J. Psychophysiol. 1998;28(3):223–231. doi: 10.1016/s0167-8760(97)00072-x. [DOI] [PubMed] [Google Scholar]
- Grillon C, Pellowski M, Merikangas KR, Davis M. Darkness facilitates the acoustic startle reflex in humans. Biol. Psychiatry. 1997;42(6):453–460. doi: 10.1016/S0006-3223(96)00466-0. [DOI] [PubMed] [Google Scholar]
- Insel T, Cuthbert BN, et al. Research Domain Criteria (RDoC): Toward a new classification framework for research on mental disorders. Am. J. Psychiatry. 2010;167(7):748–751. doi: 10.1176/appi.ajp.2010.09091379. [DOI] [PubMed] [Google Scholar]
- Robinson OJ, Vytal KE, Cornwell BR, Grillon C. The impact of anxiety upon cognition: perspectives from human threat of shock studies. Front. Hum. Neurosci. 2013;7:203. doi: 10.3389/fnhum.2013.00203. [DOI] [PMC free article] [PubMed] [Google Scholar]
- Sternberg S. High-speed scanning in human memory. Science. 1966;153(736):652–654. doi: 10.1126/science.153.3736.652. [DOI] [PubMed] [Google Scholar]
- Jaeggi SM, Buschkuehl M, Perrig WJ, Meier B. The concurrent validity of the N-back task as a working memory measure. Memory. 2010;18(4):394–412. doi: 10.1080/09658211003702171. [DOI] [PubMed] [Google Scholar]
- Altamura M, Elvevåg B, et al. Dissociating the effects of Sternberg working memory demands in prefrontal cortex. Psychiatry Res. - Neuroimaging. 2007;154(2):103–114. doi: 10.1016/j.pscychresns.2006.08.002. [DOI] [PubMed] [Google Scholar]
- Spielberger CD. State-Trait Anxiety Inventory. Anxiety. 1987;19(650):2009. [Google Scholar]
- Beck AT, Epstein N, Brown G, Steer Ra. An inventory for measuring clinical anxiety: psychometric properties. J. Consult. Clin. Psychol. 1988;56(6):893–897. doi: 10.1037//0022-006x.56.6.893. [DOI] [PubMed] [Google Scholar]
- Beck A, Brown G, Steer R. BDI-II Manual. J. Health Psychol. 1996;17(6) [Google Scholar]
- Peterson RA, Heilbronner RL. The anxiety sensitivity index:. Construct validity and factor analytic structure. J. Anxiety Disord. 1987;1(2):117–121. [Google Scholar]
- Sthle L, Wold S. Analysis of variance (ANOVA) Chemom. Intell. Lab. Syst. 1989;6(4):259–272. [Google Scholar]
- Blumenthal TD, Cuthbert BN, Filion DL, Hackley S, Lipp OV, Van Boxtel A. Committee report: Guidelines for human startle eyeblink electromyographic studies. Psychophysiology. 2005;42(1):1–15. doi: 10.1111/j.1469-8986.2005.00271.x. [DOI] [PubMed] [Google Scholar]
- Torrisi S, et al. The Neural Basis of Improved Cognitive Performance by Threat of Shock. Soc. Cogn. Affect. Neurosci. 2016;11(11):1677–1686. doi: 10.1093/scan/nsw088. [DOI] [PMC free article] [PubMed] [Google Scholar]
- Robinson OJ, Krimsky M, Grillon C. The impact of induced anxiety on response inhibition. Front. Hum. Neurosci. 2013;7:69. doi: 10.3389/fnhum.2013.00069. [DOI] [PMC free article] [PubMed] [Google Scholar]
- Owen AM, McMillan KM, Laird AR, Bullmore E. N-back working memory paradigm: A meta-analysis of normative functional neuroimaging studies. Hum. Brain Mapp. 2005;25(1):46–59. doi: 10.1002/hbm.20131. [DOI] [PMC free article] [PubMed] [Google Scholar]
- Bailey JE, Argyropoulos SV, Kendrick AH, Nutt DJ. Behavioral and cardiovascular effects of 7.5% CO2 in human volunteers. Depress. Anxiety. 2005;21(1):18–25. doi: 10.1002/da.20048. [DOI] [PubMed] [Google Scholar]
- Thibodeau MA, Welch PG, Katz J, Asmundson GJG. Pain-related anxiety influences pain perception differently in men and women: A quantitative sensory test across thermal pain modalities. Pain. 2013;154(3):419–426. doi: 10.1016/j.pain.2012.12.001. [DOI] [PubMed] [Google Scholar]
- Lamm C, Pine DS, Fox NA. Impact of negative affectively charged stimuli and response style on cognitive-control-related neural activation: An ERP study. Brain Cogn. 2013;83(2):234–243. doi: 10.1016/j.bandc.2013.07.012. [DOI] [PMC free article] [PubMed] [Google Scholar]


