

Abstract
Schizophrenia is a common disease managed by a range of interventions, with the primary treatment being antipsychotic medications (APS). Inadequate response, lack of adherence, and/or adverse events often prevent optimal therapeutic effects or therapeutic efficiency. Monitoring APS plasma concentrations can be used together with a full clinical evaluation to help improve patient care or offer better treatment options for the patient. To enable interpretation of individual risperidone and paliperidone plasma concentrations, we developed “reference ranges,” which consider the expected variability in plasma concentrations between subjects across the population, rather than representing a “therapeutic range” that relates to efficacy and/or safety outcomes. The reference ranges were derived from population pharmacokinetic models, which varied based upon administration route, dose, and time after dose. Good agreement between the proposed reference ranges and external data was obtained through graphical and numerical evaluations, indicating they could be reliably used in clinical practice.
Study Highlights.
WHAT IS THE CURRENT KNOWLEDGE ON THE TOPIC?
☑ Schizophrenia is a common disease managed by a range of interventions with the primary treatment being antipsychotic medications (APS). Inadequate response, lack of adherence, and/or adverse events often prevent optimal therapeutic effects or therapeutic efficiency, while drug monitoring is an option to manage antipsychotic treatment outcomes.
WHAT QUESTION DID THIS STUDY ADDRESS?
☑ This study aimed to establish reference ranges, i.e., the expected range of plasma concentrations, for risperidone and paliperidone in a fully adherent patient population, taking formulation, dose, time after dose, and expected variability between the subjects into account.
WHAT THIS STUDY ADDS TO OUR KNOWLEDGE
☑ Reference ranges for risperidone and paliperidone plasma concentrations were derived based on simulations from population pharmacokinetic models and evaluated based on external data.
HOW MIGHT THIS CHANGE DRUG DISCOVERY, DEVELOPMENT, AND/OR THERAPEUTICS?
☑ Comparing individual patients' APS levels to reference ranges along with a full clinical assessment could provide important insights to help a clinician differentiate a lack of efficacy from a lack of adherence and make appropriate treatment decisions.
Schizophrenia is a common disease affecting more than 21 million people worldwide,1 and is managed by a range of interventions with the primary treatment being antipsychotic medication (APS). Inadequate response, lack of adherence, and/or adverse events often prevent optimal therapeutic effects, and it has been recommended by some to initiate therapeutic drug monitoring (TDM) as an option to manage treatment outcomes for a range of APS.2 Typically, TDM has been used to help optimize individual treatment for compounds that have a narrow therapeutic range. However, for APS, there is a wide range of therapeutic plasma concentrations with no clear minimal therapeutic level (except for clozapine) and no clear toxic level. Monitoring APS plasma concentrations aims to determine if an absence of clinical response is due to disease worsening, drug ineffectiveness, or a lack of adherence.
To enable interpretation of individual APS concentrations, a range of methods have previously been employed, with concentrations commonly compared to a predeveloped nomogram.3 In this situation, the treating clinician makes a clinical decision when comparing an individual's concentration to the nomogram. This approach is, however, challenging, as plasma concentrations change over time, and vary greatly by dose and individual.4 To overcome these limitations when monitoring APS, an alternative approach is proposed here: the use of so‐called “reference ranges,” which are derived from population pharmacokinetic (PK) models and account for the expected variability in APS plasma concentrations between subjects in a fully adherent population given dose and time after dose. These reference ranges allow clinicians to interpret individual values more easily given adherence of the patient. In this sense, the reference range concept differs from standard TDM, where individual plasma concentrations are compared with a “therapeutic range” derived based on desired efficacy and/or safety outcomes. However, the proposed reference range will implicitly cover the therapeutic range, albeit not for all patients at any given dose.
In this article we present the development and evaluation of reference ranges for the plasma concentrations of risperidone and paliperidone, which were generated from population PK models that described both oral and intramuscular (i.m.) administration of long‐acting injectables (LAIs).
METHODS
Population PK models
Population PK model for oral extended release paliperidone
A previously developed population PK model for paliperidone administered as an oral extended release (ER) formulation (Invega, employing the OROS PushPull technology)5 was used to develop the reference ranges for oral ER paliperidone. The model was developed in 327 individuals across five clinical studies (Table S1.1 in Online Supplement 1),6 with the structure and final parameter estimates shown in Online Supplement 2 in Figure S2.1 and Table S2.1, respectively. To assess the model's predictive performance, a visual predictive check (VPC) was performed using an external evaluation dataset that comprised of 4,433 paliperidone concentrations from 920 subjects collected in four clinical studies (Table S1.1).
Population PK model for i.m. LAI paliperidone
A previously developed population PK model for paliperidone palmitate administered as i.m. LAI (Paliperidone palmitate 1‐month nanosuspension, PP1M, Invega Sustenna/Xeplion)7 was used to develop the reference ranges for i.m. LAI paliperidone. The model was developed in a population of 1,795 individuals from 11 clinical studies (Table S1.1).7 The model structure and final parameter estimates are provided in Figure S2.3 and Table S2.2, respectively. This population PK model has undergone a number of external evaluations during its development, at the time additional data from other studies and regions of the world became available. To assess the model's predictive performance, a VPC was run using an external evaluation dataset that comprised 26,192 paliperidone concentrations from 3,078 subjects collected in 12 external clinical studies (Table S1.1).
Population PK model for oral risperidone
A previously developed population PK model for risperidone (Risperdal) and its active metabolite paliperidone8 (in Figure S2.5) following oral administration was updated using both the original data, plus richly sampled data from additional studies, as shown in Table S1.1. As with the original model development, models were fitted to log transformed data using the first order (FO) estimation method in NONMEM v. 7.2,9 as more precise methods such as first order conditional estimation (FOCE) were impractical due to model run times. Following the update, the model was evaluated on all data available, i.e., sparse sampling from the additional studies was now included, by assessing goodness‐of‐fit plots and VPCs.
Population PK model for the active moiety (AM) of i.m. LAI risperidone
A PK model for the AM, i.e., risperidone plus paliperidone, following biweekly i.m. administration of risperidone as LAI (Risperdal Consta) was previously developed based on data from five clinical studies using a sequential two‐stage approach.10 Here, this model was updated using a population approach based on 3,051 plasma concentration–time observations for the AM from 133 subjects in two clinical studies (Table S1.1) included in the original data. Model building was performed using the FOCE method in NONMEM v. 7.2.9 The final model was evaluated by assessing goodness‐of‐fit plots and a VPC using an evaluation dataset that comprised 6,566 AM concentrations from 1,060 subjects across the remaining three clinical studies (Table S1.1) from the original analysis.
Demographics database for antipsychotic patients
To derive the reference ranges, a demographics database was developed that was representative of patients administered risperidone or paliperidone. To construct this database, sex, age, weight, height, cytochrome P450 (CYP) 2D6 metabolizing status, and creatinine clearance were extracted from subjects previously recruited in 50 clinical studies (Table S1.1). Data from healthy volunteers were excluded.
Derivation of reference ranges
Steady‐state plasma concentrations for risperidone and paliperidone assuming full adherence to treatment were simulated in NONMEM v. 7.29 from the population PK models using the demographics database. To complete the simulations, dummy PK datasets were created that contained >6,000 subjects from the demographics database where subjects were 12–70 years old and had known values of covariates in the final PK models. For the reference range determination of oral risperidone, concomitant administration of carbamazepine was assigned as unknown in the simulation datasets.
Reference ranges were determined for a range of dosing scenarios within the currently approved drug labels. For oral administration, the SS and II data items in NONMEM were applied to achieve steady‐state, and sampling timepoints were inserted into the dummy datasets every 15 minutes, from time 0 to 24 h postdose at steady‐state. For monthly i.m. LAI paliperidone, two loading doses during the first month of treatment were included in the dummy dataset, followed by 23 monthly maintenance doses according to the drug label. Doses were administered in the deltoid muscle for the loading period, while deltoid and gluteal injections sites were alternated for the following maintenance dosing. Sampling timepoints were added to the dummy dataset every 6 h following the 23rd maintenance dose for 28 days postdose. For i.m. LAI risperidone, 13 biweekly doses were included in the dummy dataset, and sampling timepoints were added every 3 h following the 13th dose, from time 0 to 336 h (14 days) postdose.
The reference ranges were calculated by computing the 80% prediction intervals from the simulated plasma concentrations, averaged for each subject over binned postdose time intervals. The binned time intervals considered were as follows: For once‐daily (q.d.) oral dosing regimens, 0–4, 4–9, 9–14, 14–20, and 20–24 h postdose; for twice‐daily (b.i.d.) oral risperidone dosing regimens, 0–4, 4–9, and 9–12 h postdose; for monthly maintenance dosing of i.m. LAI paliperidone, 0–1, 1–2, 2–3, and 3–4 weeks postdose; and for bi‐weekly dosing of i.m. LAI risperidone, 0–1, and 1–2 weeks postdose.
Due to the crossreactivity between risperidone and its active metabolite paliperidone in antibody‐based bioassays used for measuring plasma concentrations, risperidone reference ranges were derived for the AM, i.e., risperidone and paliperidone combined. As the population PK model for oral risperidone described the kinetics of the parent as well as the metabolite, reference ranges were computed for the AM based on the summed plasma concentrations of risperidone + paliperidone, while for i.m. LAI risperidone the reference ranges for the AM were directly derived from the corresponding PK model.
Evaluation of reference ranges
The reference ranges were evaluated using external evaluation datasets (Table S1.1). The reference ranges were graphically evaluated by stratifying them by dose, then overlaying steady‐state plasma concentrations from the external evaluation datasets. Dose‐normalized graphical evaluations were also performed. A numerical evaluation of the reference ranges was also conducted, by calculating the fraction of observed plasma concentrations in the evaluation dataset falling above, below, or inside the 80% population reference ranges. Due to the small number of observations available per dose level for each time bin in the evaluation datasets, these calculations were stratified by dose over the entire dosing interval, as well as by time bin across all dose levels.
RESULTS
Population PK models
Evaluation of the oral ER and i.m. LAI paliperidone population PK models
VPCs of the prior oral ER and i.m. LAI paliperidone models on the evaluation dataset are provided in Figures S2.2 and S2.4, respectively. The models described the data well, with similar median concentrations across the dosing interval, and similar variability.
The updated oral risperidone population PK model
The updated oral risperidone model remained structurally identical to the prior model, as shown in Figure S2.5,8 with some modifications to covariate effects describing concomitant administration of carbamazepine, CYP2D6 metabolizer status, and age (Online Supplement 2). Parameter estimates for the updated model are provided in Table S2.3. Goodness‐of‐fit plots and VPCs suggested that the updated model possessed adequate estimation and simulation characteristics (Figures S2.6–S2.8). The observed vs. predicted concentration plots did not show any obvious bias, with VPCs indicating that the variability terms in the model were well estimated for both risperidone and paliperidone.
The population PK model for the AM of risperidone administered as i.m. LAI
The final population PK model for the AM of risperidone administered as i.m. LAI was a one‐compartment disposition model with first‐order elimination and absorption occurring via three routes to account for multiple peaks seen in the raw data (not shown). The first route represented an instant bolus, while the second and third routes occurred via transit compartments. Lean body weight was included as a covariate on the apparent clearance. A schematic of the model structure is provided in Figure S2.9, while the final parameter estimates are provided in Table S2.7. Goodness‐of‐fit plots and a VPC on the evaluation dataset suggested that the final model possessed adequate simulation characteristics (Figures S2.10, S2.11). The plots of observed vs. predicted concentrations demonstrated minimal bias, with the VPC indicating that the observed variability in the external data was well described by the final model.
Demographics database for antipsychotic patients
Demographics data from a total of 10,123 subjects were included in the database for antipsychotic patients as summarized in Table 1 . A subset of only 7,635 subjects with known ages between 12–70 years, and either known or imputed CYP2D6 metabolizing status, could be used to determine oral risperidone reference ranges.
Table 1.
Subject demographics included in the database for antipsychotic patients.
| Age (years) | Height (cm) | Weight (kg) | BSA (m2) | CrCL (mL/min) | Sex | Race | CYP2D6 | |
|---|---|---|---|---|---|---|---|---|
| N | 10123 | 10123 | 10123 | 10123 | 10123 | 6373 Males | 6319 White | 708 Poor |
| Missing | 1643 | 255 | 263 | 274 | 2931 | 3380 Female | 1595 Black | 1207 Intermediate |
| Mean | 38.2 | 168 | 73.4 | 1082 | 115 | 370 Unknown | Z Asian | Z Extensive |
| SD | 16.8 | 12.7 | 2.6 | 0.288 | 38.8 | ‐ | 271 Hispanic | 188 Ultra‐rapid |
| CV% | 44 | 7.54 | 28.1 | 15.8 | 33.9 | ‐ | 243 Other | ‐ |
| Median | 38 | 170 | 72 | 1.83 | 112 | ‐ | 929 Unknown | ‐ |
| Min | 3 | 85.3 | 15.3 | 0.648 | 14.4 | ‐ | ‐ | ‐ |
| Max | 105 | 205 | 237 | 3.23 | 502 | ‐ | ‐ | ‐ |
BSA, body surface area; CrCL, creatimine clearance; CV, coefficient of variation; CYP2D6, cytochrome P450 2D6 metabolisher status; N, number of subjects; SD, standard deviation.
Concomitant administration of carbamazepine was assigned as unknown. A subset of only 6,327 subjects with known ages between 12–70 years and complete covariate information (sex, weight, height, and creatinine clearance) could be used to determine reference ranges for oral ER and i.m. LAI paliperidone. A subset of 6,186 subjects with known ages between 12–70 years and complete covariate information (sex, weight, height, and either known or imputed CYP2D6 metabolizing status) were used to determine reference ranges for i.m. LAI risperidone.
Reference ranges
Reference ranges for oral ER and i.m. LAI paliperidone
A numerical summary of the dose‐ and time‐binned reference ranges (i.e., 80% prediction intervals) for oral ER paliperidone is provided in the Online Supplement 3 in Table S3.1, while Table S3.2 shows the summary of the reference ranges for monthly i.m. LAI paliperidone. Figure 1 illustrates the reference ranges graphically, overlaid with the respective external evaluation datasets. The evaluation datasets included 5,739 observations from 1,105 subjects across eight external studies for oral ER paliperidone, and 1,588 observations from 253 subjects across six external studies for monthly i.m. LAI paliperidone, respectively. Results of the numerical evaluation of these reference ranges are provided in Tables 2 and 3, while graphical evaluations normalized by dose are presented in Figures S3.1 and S3.2. It can be seen that the observations for oral ER paliperidone were mostly contained within the reference ranges, while slightly more observations fell above the 90th percentile (17.1%) and below the 10th percentile (16.2%) than expected (10%). For monthly i.m. LAI paliperidone, the observations were also mostly contained within the reference ranges, while slightly fewer observations fell below the 10th percentile (7.6%), and above the 90th percentile (7.5%) than expected.
Figure 1.
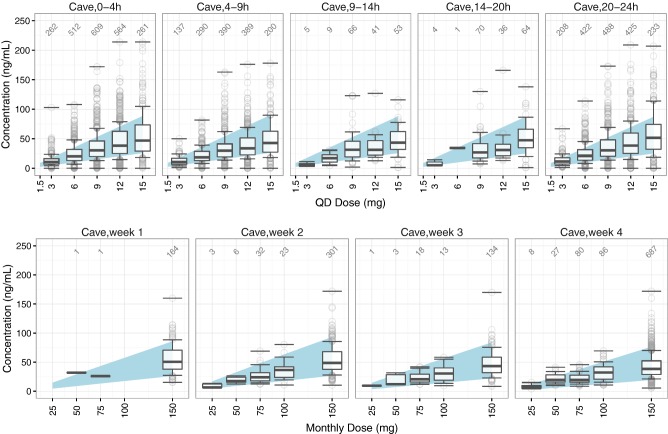
Graphical evaluation of the reference ranges for oral ER (top) and i.m. LAI paliperidone (bottom) by time and dose. The shaded areas represent the simulated 80% reference ranges. The boxplots represent the 10th, 25th, 50th, 75th, and 90th percentiles of the observed plasma concentrations in the external evaluation dataset, while the circles represent the remaining observed plasma concentrations within each time bin. Horizontal lines marking maximum and minimum observed concentrations are included for each boxplot. Annotations show the number of valid concentrations in each boxplot.
Table 2.
Numeric Evaluation of the Oral ER Paliperidone Reference Ranges Based on the External Evaluation Dataset.
| Paliperidone Oral ER | Evaluation Data (%) | n | |||
|---|---|---|---|---|---|
| <10th | 10th‐90th | >90th | |||
| Dose (mg) | 3 | 14.8 | 61.9 | 23.4 | 616 |
| 6 | 15.4 | 65.8 | 18.8 | 1234 | |
| 9 | 14.2 | 67.7 | 18.2 | 1623 | |
| 12 | 17.9 | 68.6 | 13.5 | 1455 | |
| 15 | 19.2 | 66.7 | 14.1 | 811 | |
| Time Period (hours) | 0–4 | 16.3 | 65.1 | 18.6 | 2208 |
| 4–9 | 17.6 | 69.3 | 13.0 | 1406 | |
| 9–14 | 17.2 | 75.3 | 7.5 | 174 | |
| 14–20 | 17.1 | 72.0 | 1.9 | 175 | |
| 20–24 | 14.6 | 65.3 | 20.1 | 1776 | |
| Overall | 16.2 | 66.7 | 17.1 | 5739 | |
n, number of observations within a bin.
Table 3.
Numeric Evaluation of the i.m. LAI Paliperidone Reference Ranges Based on the External Evaluation Dataset.
| Paliperidone i.m. LAI | Evaluation Data (%) | n | |||
|---|---|---|---|---|---|
| <10th | 10th‐90th | >90th | |||
| Dose (mg) | 25 | 0.0 | 91.7 | 8.3 | 12 |
| 50 | 0.0 | 73.0 | 27.0 | 37 | |
| 75 | 3.1 | 92.4 | 4.6 | 131 | |
| 100 | 5.7 | 85.2 | 9.0 | 122 | |
| 150 | 8.6 | 84.4 | 7.1 | 1286 | |
| Time Period (weeks) | 1 | 8.4 | 78.9 | 12.7 | 166 |
| 2 | 8.8 | 83.8 | 7.4 | 365 | |
| 3 | 8.3 | 85.8 | 5.9 | 169 | |
| 4 | 6.9 | 86.3 | 6.9 | 188 | |
| Overall | 7.6 | 84.9 | 7.5 | 1588 | |
n, number of observations within a bin.
Reference ranges for oral risperidone
Numerical summaries of the reference ranges for the AM of oral risperidone by dose and time bin following q.d. and b.i.d. dosing are provided in Tables S3.3–S.3.5. Figure 2 illustrates the q.d. reference ranges graphically, overlaid with 3,011 oral risperidone plasma concentration–time observations from 934 subjects across four external studies. Results of the numerical evaluation of these reference ranges are provided in Table 4 , while a graphical evaluation normalized by dose is presented in Figure S3.3. It can be seen that the observations were mostly contained within the reference ranges. The percentage of observations falling below the 10th percentile (11.8%) was in agreement with expectations (10%), while slightly less observations than expected fell above the 90th percentile (7.3%) No external data were available for evaluating the risperidone b.i.d. reference ranges.
Figure 2.
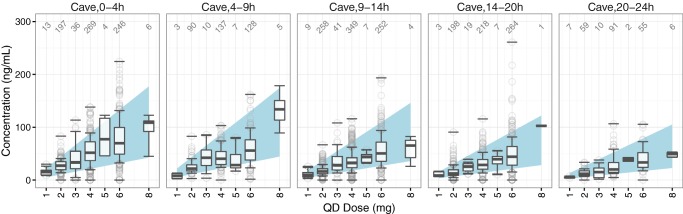
Graphical evaluation of the reference ranges for the active moiety of risperidone by time and dose following q.d. oral dosing. The shaded areas represent the simulated 80% reference ranges. The boxplots represent the 10th, 25th, 50th, 75th, and 90th percentiles of the observed plasma concentrations in the external evaluation dataset, while the circles represent the remaining observed plasma concentrations within each time bin. Horizontal lines marking maximum and minimum observed concentrations are included for each boxplot. Annotations show the number of valid concentrations in each boxplot.
Table 4.
Numeric Evaluation of the QD Risperidone Reference Ranges for the Active Moiety (Risperidone + Paliperidone) Based on the External Evaluation Dataset.
| Risperidone Oral QD | Evaluation Data (%) | n | |||
|---|---|---|---|---|---|
| <10th | 10th‐90th | >90th | |||
| Dose (mg) | 1 | 8.6 | 80.0 | 11.4 | 35 |
| 2 | 9.5 | 84.3 | 6.2 | 802 | |
| 3 | 12.9 | 72.4 | 14.7 | 116 | |
| 4 | 10.9 | 81.5 | 7.6 | 1064 | |
| 5 | 14.8 | 81.5 | 3.7 | 27 | |
| 6 | 14.9 | 78.1 | 7.0 | 945 | |
| 8 | 4.5 | 90.9 | 4.5 | 22 | |
| Time Period (hours) | 0–4 | 9.5 | 80.9 | 9.6 | 771 |
| 4–9 | 11.1 | 83.7 | 5.3 | 380 | |
| 9–14 | 13.7 | 79.9 | 6.4 | 920 | |
| 14–20 | 13.7 | 79.4 | 6.9 | 710 | |
| 20–24 | 7.8 | 84.3 | 7.8 | 230 | |
| Overall | 11.8 | 80.9 | 7.3 | 3011 | |
n, number of observations within a bin; no external data were available for evaluating the BID reference ranges for oral risperidone.
Reference ranges for the AM of i.m. LAI risperidone
A numerical summary of the reference ranges for the AM of risperidone by dose and time bin following bi‐weekly dosing as i.m. LAI is provided in Table S3.6, while Figure 3 illustrates the reference ranges graphically. External steady‐state data not in the original analysis were not available for evaluation of these reference ranges.
Figure 3.
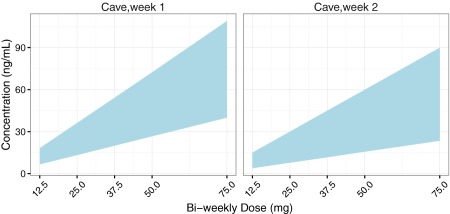
Graphical representation of the simulated 80% reference ranges for the active moiety of risperidone following bi‐weekly i.m. dosing as LAI.
DISCUSSION
Treatment of psychiatric disorders is complex, as effective management plans need to consider the patient's presentation together with a myriad of other pertinent information. Monitoring APS plasma concentrations is one aspect to consider, which can be used as an indicator that a subject is being exposed to the drug at a level consistent with an expected range of plasma concentrations given formulation, dose and time after dose, i.e., a “reference range.”
Here we developed plasma concentration reference ranges for risperidone and paliperidone following oral and i.m. administration as LAIs using established in‐house population PK models to account for expected variability in the plasma concentrations between subjects. The models were developed using a significant amount of data, with reference ranges dependent on available models/data for their construct. We have chosen the 80% prediction interval as reference ranges to capture most of the expected variability in the population without giving too much weight to the extrema.
Evaluation of these reference ranges using external data overall showed good agreement. While perfect adherence was assumed in the reference range simulations, it is almost certain that not all subjects in the evaluation datasets were fully adherent. Therefore, slight deviations of the percentage of external observations falling outside of the 80% reference ranges from the expected value (10% above and below, respectively) were anticipated. Furthermore, we note that erratic adherence patterns cannot easily be identified using methods proposed here, although it should help the clinician determine if a nonresponsive subject is a result of sustained concentrations below the reference range. We refer readers back to the leading article accompanying this article for further discussion of the relationship between responsiveness/nonresponsiveness and concentration.
It should be noted that while the “reference range” concept proposed herein refers to the plausible plasma concentration range in 80% of subjects within a fully compliant population, taking into account random variation as well as variation related to clinically nonrelevant covariates over the range of marketed doses that are efficacious in at least certain patients, it differs from a “therapeutic range,” as commonly applied in standard TDM, which is defined as an expected range of plasma concentration related to desired efficacy and/or safety outcomes. As the proposed reference ranges were derived based on common dosing regimens according to the product labels, the reference ranges naturally encompass the respective therapeutic ranges. Comparing individual plasma concentration levels with these reference ranges therefore provides a more generalized approach to monitoring APS levels than standard TDM, mainly by providing an indication of a patient's adherence to treatment. If, for example, a patient regularly presents with APS levels within the respective reference range but does not respond to treatment, nonadherence is unlikely and the clinician could consider an increase in dose or change to an alternate medication. However, if a patient is nonresponsive while their APS levels fall below the respective reference range or are highly variable, the clinician should seek to establish if the patient is truly adherent to its prescribed medication before considering a change in medication due to lack of efficacy. Continuous assessment of a patient's APS concentration over multiple follow‐up visits can further facilitate this process.
In conclusion, comparing individual patients' APS levels with the reference ranges presented in this work along with a full clinical assessment could provide important insights to help a clinician differentiate a lack of efficacy from a lack of adherence and make appropriate treatment decisions.
Supporting information
Supporting Information.
Supporting Information.
Supporting Information.
Supporting Information.
Supporting Information.
Supporting Information.
Supporting Information.
Supporting Information.
Acknowledgments
The authors acknowledge the help of Drs. Kris Jamssen, Sarah McLeay, Allan Rae, and Mr. Simon Leung for their contributions to materials presented in this article.
Conflict of Interest/Disclosure
B.G. and J.K. (at the time the work was conducted) are employees of Model Answers Pty Ltd, which received financial reimbursement from Janssen R&D. A.V. and B.R. are employees of Janssen R&D, which sponsored this research.
Author Contributions
B.G., J.K., B.R., and A.M.V. wrote the article; B.R. designed the research; B.G., J.K., and A.M.V. performed the research; B.G., J.K., and A.M.V. analyzed the data.
References
- 1. World Health Organization . Schizophrenia — Fact Sheet No. 397. <http://www.who.int/mediacentre/factsheets/fs397/en/> Revised April 2016.
- 2. Hiemke, C. et al AGNP consensus guidelines for therapeutic drug monitoring in psychiatry: Update 2011. Pharmacopsychiatry 44, 195–235 (2011). [DOI] [PubMed] [Google Scholar]
- 3. Rostami‐Hodjegan, A. et al Influence of dose, cigarette smoking, age, sex, and metabolic activity on plasma clozapine concentrations: A predictive model and nomograms to aid clozapine dose adjustment and to assess compliance in individual patients. J. Clin. Psychopharmacol. 24, 70–78 (2004). [DOI] [PubMed] [Google Scholar]
- 4. Patteet, L. et al Therapeutic drug monitoring of common antipsychotics. Ther. Drug Monit. 34, 629–51 (2012). [DOI] [PubMed] [Google Scholar]
- 5. U.S. Food and Drug Administration . Invega — Pediatric Supplement (NDA 21999). Clinical Pharmacology Review (2010). [Google Scholar]
- 6. Johnson & Johnson Pharmaceutical Research & Development — Clinical Pharmacology . Population Pharmacokinetics of Paliperidone ER (INVEGA®) in Children and Adolescents (age 12 to ≤17 years). Advanced Modeling and Simulation Analysis Report (2010).
- 7. Samtani, M. N. , Vermeulen, A. & Stuyckens, K. Population pharmacokinetics of intramuscular paliperidone palmitate in patients with schizophrenia: a novel once‐monthly, long‐acting formulation of an atypical antipsychotic. Clin. Pharmacokinet. 48, 585–600 (2009). [DOI] [PubMed] [Google Scholar]
- 8. Vermeulen, A. , Piotrovsky, V. & Ludwig, E. Population pharmacokinetics of risperidone and 9‐hydroxyrisperidone in patients with acute episodes associated with bipolar I disorder. J. Pharmacokinet. Pharmacodyn. 34, 183–206 (2007). [DOI] [PubMed] [Google Scholar]
- 9. Bauer, R.J. NONMEM Users Guide — Introduction to NONMEM 7.2.0 (ICON Development Solutions, Ellicott City, MD, 2011). [Google Scholar]
- 10. Piotrovskij, V. , Mannaert, E. & Vermeulen, A. EDMS‐BEBE‐2873506 — Population analysis of risperidone depot microspheres pharmacokinetics in patients with schizophrenic or schizoaffective disorder. Janssen Research & Development (2001). [Google Scholar]
Associated Data
This section collects any data citations, data availability statements, or supplementary materials included in this article.
Supplementary Materials
Supporting Information.
Supporting Information.
Supporting Information.
Supporting Information.
Supporting Information.
Supporting Information.
Supporting Information.
Supporting Information.