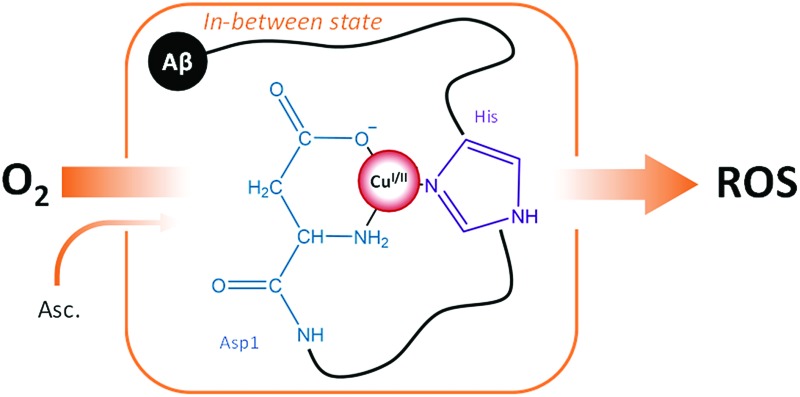
 ROS production proceeds through a Cu–Aβ state in which Cu(i/ii) binds to the NH2 and COO– groups of Asp1 and a histidine.
Abstract
Oxidative stress is linked to the etiology of Alzheimer’s disease (AD), the most common cause of dementia in the elderly. Redox active metal ions such as copper catalyze the production of Reactive Oxygen Species (ROS) when bound to the amyloid-β (Aβ) peptide encountered in AD. We propose that this reaction proceeds through a low-populated Cu–Aβ state, denoted the “catalytic in-between state” (CIBS), which is in equilibrium with the resting state (RS) of both Cu(i)–Aβ and Cu(ii)–Aβ. The nature of this CIBS is investigated in the present work. We report the use of complementary spectroscopic methods (X-ray absorption spectroscopy, EPR and NMR) to characterize the binding of Cu to a wide series of modified peptides in the RS. ROS production by the resulting Cu–peptide complexes was evaluated using fluorescence and UV-vis based methods and led to the identification of the amino acid residues involved in the Cu–Aβ CIBS species. In addition, a possible mechanism by which the ROS are produced is also proposed. These two main results are expected to affect the current vision of the ROS production mechanism by Cu–Aβ but also in other diseases involving amyloidogenic peptides with weakly structured copper binding sites.
Introduction
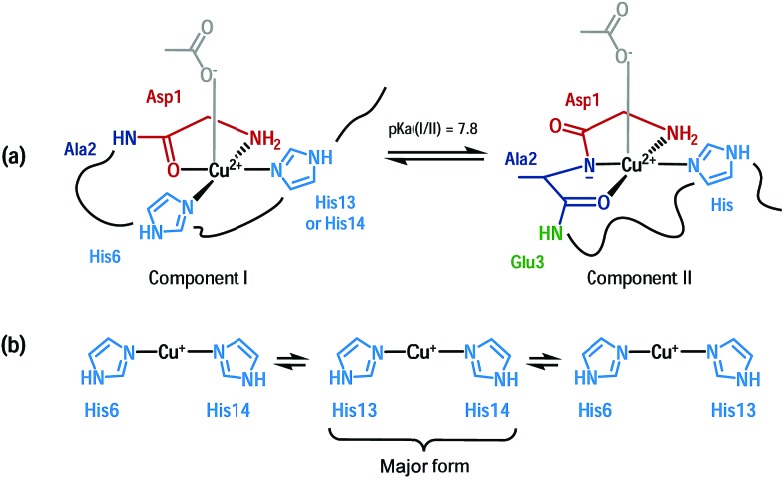
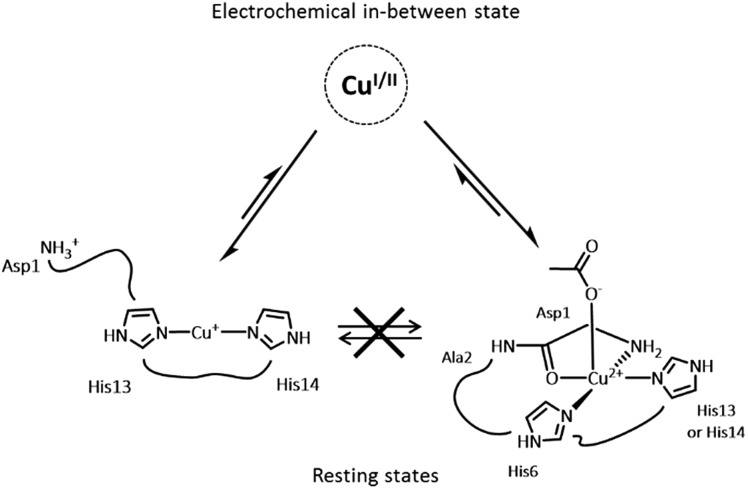
An important feature in Alzheimer’s disease (AD) is the presence of oxidative damage on neuronal lipids and proteins, which clearly links oxidative stress to AD. 1–6 Oxidative stress can have different origins, but the overproduction of Reactive Oxygen Species (ROS) is considered a major contribution. Loosely bound metal ions like copper and iron are very efficient catalysts for the production of ROS.7 Metal ions are involved in AD and other neurodegenerative pathologies. 8–14 In AD, high concentrations of metal ions have been found in amyloid plaques, a hallmark of AD, where they are bound to the amyloid-β (Aβ) peptide. 15,16 In particular, copper ions bound to Aβ are redox-competent and are able to catalytically cycle between Cu(i) and Cu(ii) in the presence of a reductant (e.g. ascorbate) to generate ROS such as O2˙–, H2O2 and HO˙. 17–20 Thus, the coordination mode of Aβ with copper ions plays a crucial role since ROS production is metal-catalyzed. Cu(i) and Cu(ii) coordination spheres are quite different. Near physiological pH, two Cu(ii)–Aβ binding modes (called components I and II) coexist, both with distorted square-planar geometry (Fig. 1a) 21–23 while Cu(i) is bound in a linear fashion by two of the three His residues present in the Aβ sequence in a dynamic exchange (Fig. 1b). 24,25 An electrochemistry study has previously shown that the redox process between Cu(i)–Aβ/Cu(ii)–Aβ (in component I) is governed by a so-called “POET” (Pre-Organization Electron Transfer) mechanism.26 This electron transfer proceeds through a small fraction of the Cu–peptide in equilibrium with the resting states (RS) of Cu(i)–Aβ and Cu(ii)–Aβ, whose coordination modes are described (Fig. 1). In this weakly populated state called the “electrochemical in-between state” (EIBS), the Aβ peptide surrounds the Cu centre in such a way as to speed up the electron transfer (Fig. 2).
Fig. 1. Cu(ii) coordination (a) and Cu(i) coordination (b) to the Aβ peptide in the resting states. 21,24,25 .
Fig. 2. Schematic view of the equilibrium between the RS and EIBS of the Cu–Aβ complex.
Accordingly, in the EIBS, the reorganization energy is minimal,26 and thus it is anticipated that neither ligand exchange nor strong geometric modification occurs between the Cu(i) and Cu(ii) states. It is worth nothing that the EIBS is reachable due to the very flexible nature of the peptides 22,27 and since it is low-populated, the structure of the Cu site cannot be directly determined using classical spectroscopic methods. A more recent electrochemical study has focused on the electrochemistry of component II.28 It has been proposed that reduction of component II at pH 8.5 is more difficult than that of component I and that it goes through a Cu(i) intermediate species consisting of a Cu(i) ion linearly bound to an imidazole ring and the deprotonated amide from the Asp1-Ala2 peptide bond.28
A catalytic in-between state, denoted CIBS, reminiscent of the EIBS, has been postulated to be engaged in catalytic ROS production (and some structural features have been obtained from the oxidative damages undergone by the peptide itself).29 According to a mass spectrometry study,29 Asp1, His13 and His14 are involved in the coordination sphere of copper as they are the main amino acid residues specifically targeted by HO˙ during ROS production. In addition, few computational studies have been aimed at elucidating the Cu environment in the redox competent state of Cu–Aβ. 30–33 Thus, the CIBS is poorly described, although it is responsible for metal-catalyzed ROS production which contributes to oxidative stress in AD.
In the present study, we propose a single binding mode for both Cu(i)–Aβ and Cu(ii)–Aβ in the CIBS. This proposed coordination model was deduced from studies on the impact of different modifications of the Aβ peptide sequence on Cu induced ROS production in the presence of ascorbate and dioxygen. We used fluorescence and UV-visible spectroscopy to monitor HO˙ trapping and ascorbate consumption respectively, as well as X-ray Absorption Near Edge Spectroscopy (XANES), Electron Paramagnetic Resonance (EPR) and Nuclear Magnetic Resonance (NMR) to describe the RS of the Cu-complexes.
Results
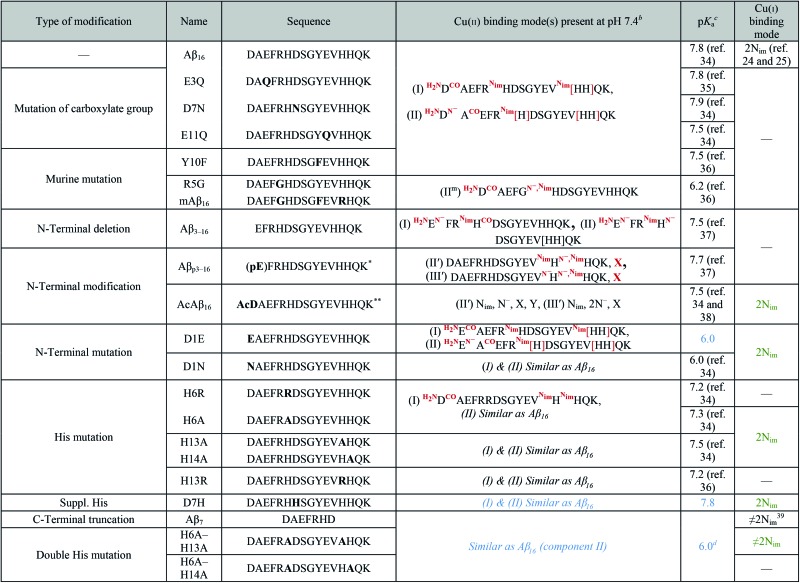
The present study deals with the identification of key structural features of the CIBS. To reach such an objective, a series of modified peptides has been used. Firstly, we have determined the Cu(i) and Cu(ii) coordination to those peptides in the RS when not available in the literature, and gathered the information together with the already published data in Table 1. This will be detailed in the first paragraph of the results part while the other two focus on the characterizations of the CIBS.
Table 1. The peptide sequences of the mutated, modified and truncated Aβ peptides used for the study along with their binding modes to Cu(ii) and Cu(i) at pH 7.4 and pK a of the transition between the two Cu(ii) components present at pH 7.4 a , e .
|
aColored data have been obtained in the present study by EPR (blue) and XANES (green) experiments (spectra are given in Fig. S1 to S4 of the ESI†).
bThe square brackets depict the dynamic exchange existing between histidine residues;
cpK a of the transition between the two Cu(ii) components present at pH 7.4.
dMinimum pH where component II is in the majority.
e*pE refers to pyroglutamate. **AcD refers to N-terminally acetylated aspartate. Nim = nitrogen atom from imidazole ring; CO and N– = carbonyl and amidyl nitrogen of the peptide bond; H2N = N-terminal amine.
Coordination of Cu(i) and Cu(ii) to modified Aβ peptides in the RS
The C-terminally truncated Aβ16 peptide was used instead of the full-length Aβ40 peptide because the first 16 amino acid residues encompass the metal ion binding sites, 21,25,40,41 thus representing a valuable model of metal coordination to the full-length peptide.
In order to determine the amino acid residues of Aβ involved in copper coordination during ROS production, a series of mutated and N-terminally protected and truncated Aβ peptides was studied. A complete list of these peptides, along with their sequences and residues involved in Cu(i) and Cu(ii) coordination in the RS, is given in Table 1. One part of the data was collected from the literature, while the other part was obtained by XANES and EPR experiments (spectra are given in the ESI in Fig. S1 to S4†).
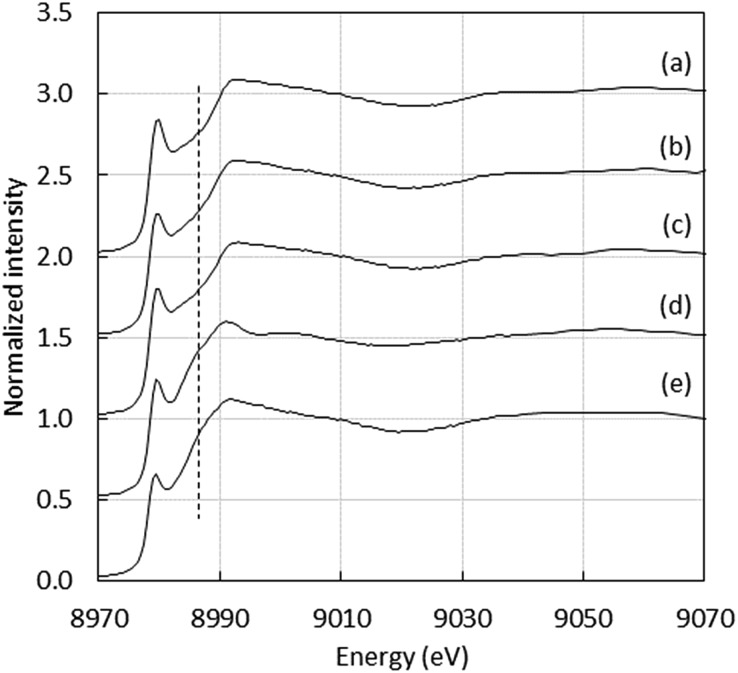
Regarding Cu(i), the linear coordination by two His residues from the Aβ16 was also detected with peptides containing at least two His residues, as illustrated by the XANES study of Cu(i)–AcAβ16, Cu(i)–D1N, Cu(i)–D1E, Cu(i)–H6A, Cu(i)–H13A, Cu(i)–H14A and Cu(i)–D7H, (Fig. S1 and S2†), showing the characteristic intensity of the 1s → 4p transition (around 0.7–0.8). 24,25,42 As an example, XANES signatures of Cu(i)–Aβ16, Cu(i)–D7H and Cu(i)–H6A are shown in Fig. 3. Peptides containing only one His show a different XANES signature than Cu(i)–Aβ16 and Cu(i) in buffer, as illustrated by Cu(i)–(H6A–H13A) (dotted line in Fig. 3d) and Cu(i)–Aβ7 (Fig. S3†). This underlines the importance of having two His for native Cu(i) binding. When only one His is present, the signature is in accordance with an increase in the ligand number on Cu(i),42 and cannot be reproduced by a linear combination of signatures of Cu(i)–Aβ and Cu(i) in buffer only.
Fig. 3. Cu XANES K-edge X-ray absorption spectra of (a) Cu(i)–Aβ16, (b) Cu(i)–D7H, (c) Cu(i)–H6A, (d) Cu(i)–(H6A–H13A) and (e) Cu(i) in buffer at pH 7.1.
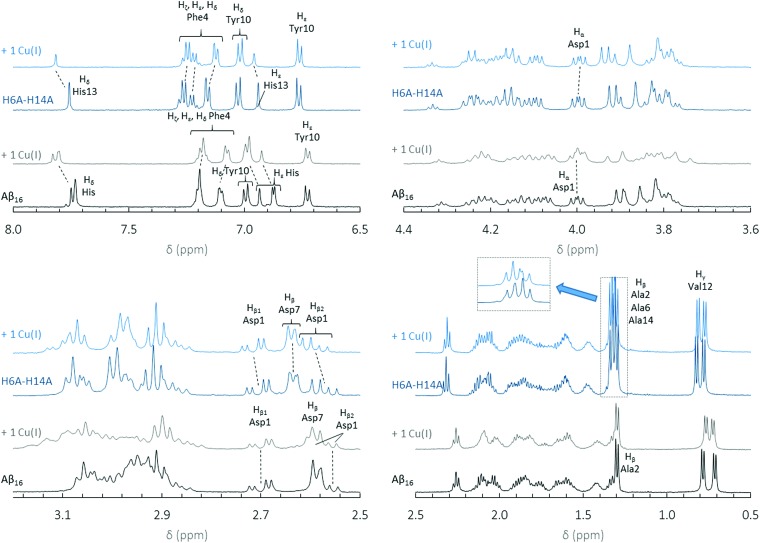
To gain more insight into Cu(i) binding to the 1-His containing peptides, NMR experiments were performed for H6A–H14A, H6A–H13A and Aβ7 peptides (see Fig. 4 for the H6A–H14A peptide, and Fig. S5 and S6 for the other peptides†) according to reported protocols for the parent Aβ16. 24,43,44 For comparison, 1H NMR spectra of Aβ16 in the absence and the presence of 1 equivalent of Cu(i) are shown in Fig. 4. With the Aβ16 peptide, Cu(i) is bound by two of the three His residues in dynamic exchange. 24,25 The binding of Cu(i) to the peptide modifies the electron density of the protons in its vicinity and results in a chemical shift.24 For instance, the Hδ and Hε protons of His13, present at about 7.75 and 6.93 ppm, are strongly shifted indicating that the His13 residue is involved in Cu(i) binding.
Fig. 4. 1H NMR spectra of Aβ16 (black curve) with 1 equivalent of Cu(i) (grey curve) and 1H NMR spectra of H6A–H14A (dark blue curve) with 1 equivalent of Cu(i) (light blue curve) at pH 7.3. The chemical shifts of protons observed with the addition of Cu(i) are indicated with dotted lines. All chemical shifts were calculated relative to the internal TSP reference at 0.00 ppm.
In the case of H6A–H14A (Fig. 4) and H6A–H13A (Fig. S5†), the chemical shifts of Hα, Hβ1 and Hβ2 in Asp1 (4.00, 2.70 and 2.57 ppm) are affected by Cu(i) addition, indicating that Asp1 is bound to Cu(i) by both the N-terminal amine and the carboxylate side chain (for Aβ7, see ESI, Fig. S6†). This is different to what is observed for the Asp1 protons in Aβ16 (4.00, 2.70 and 2.57 ppm), which are not affected by Cu(i) addition. This is in line with a change in Cu(i) coordination with the 1-His peptides. The peaks for the Hε, Hζ and Hδ protons (around 7.2 ppm) in Phe4 shift and broaden upon addition of Cu(i). However, the same is observed with Aβ16 (Fig. 4). This effect is probably linked to the spatial reorganization of the peptide due to Cu(i) binding to Aβ. Based on NMR and XANES data, we propose that the Cu(i) sphere in 1-His containing peptides involves the N-terminal amine, the side chain of one His residue and the Asp1 carboxylate group.
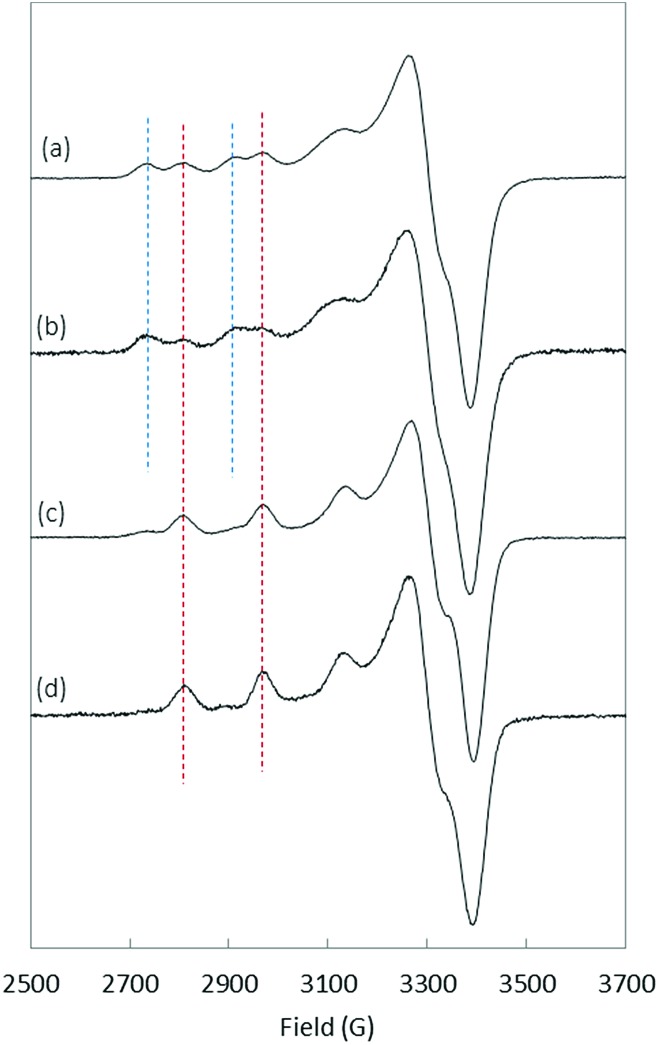
Regarding Cu(ii), several data were extracted from the literature (Table 1). In particular, Cu(ii) coordination to Aβ was previously studied and was found to involve the NH2 of Asp1, C O of the Asp1–Ala2 peptide bond and N atoms from the imidazole ring of His6 and His13/14, in equilibrium, in the main component present at physiological pH (component I). 21–23,45–47 It is worth noting that coordination of the Asp1 carboxylate side-chain instead of the C O group has also been proposed. 48,49 The minor species at physiological pH (component II) is characterized by a Cu(ii) centre bound to the NH2 from Asp1, N– from the Asp1–Ala2 peptide bond, C O from the Ala2–Glu3 peptide bond and one N atom from the imidazole ring of His6/13/14 in equilibrium. The pH of interconversion between components I and II (denoted pK a(I/II) value) equals 7.8 (Table 1).34 Several modifications were found to have significant impact on the pK a(I/II) values but not on the coordination modes: E3Q, D7N, E11Q, Y10F, D1N, H6R, H6A, H13A, H13R and H14A. 34–36 In contrast, N-terminal truncation or blockage (in Aβ3–16, Aβp3–16 and AcAβ16) strongly affects the coordination sphere. 34,37,38 Finally, although Arg5 is not directly involved in the coordination sphere, the R5G mutation, one of the three amino acid changes from the murine peptide (R5G, Y10F and H13R), was previously found to affect the Cu(ii) binding modes and to decrease the pK a(I/II) value by 1.5 pH unit.36 To complement the data collected from the literature, EPR experiments were carried out to gain insight into Cu(ii) coordination to D1E, D7H, Aβ7, H6A–H13A and H6A–H14A (the complete set of EPR spectra as a function of pH and the corresponding EPR parameters are given in the ESI in Fig. S4 and Table S1,† respectively). As a matter of illustration, the EPR signatures of Cu(ii)–Aβ16, Cu(ii)–D7H, Cu(ii)–D1E and Cu(ii)–(H6A–H13A) at pH 7.5 are shown in Fig. 5.
Fig. 5. EPR spectra of 65Cu(ii) coordinated to (a) Aβ16, (b) D7H, (c) D1E and (d) H6A–H13A at pH 7.5. Blue and red dashed lines indicate the signatures related to component I and component II, respectively. Aqueous solution of 65Cu(ii) (0.45 mM), peptide (0.5 mM) with 10% of glycerol.
The removal of one His in the sequence (H6A, H6R, H13A, etc.) had only a slight impact on both the pK a(I/II) value and Cu(ii) coordination. 34,36 Similarly, the addition of one His (D7H) does not modify either the Cu(ii) binding modes or the pK a(I/II) value. D1E mutation leads to a strong decrease in the pK a(I/II) value while keeping similar copper coordination modes to Aβ16, (Fig. S4†) as previously shown for the D1N mutation.34 Finally, the double removal of His (Aβ7 truncation or H6A–H13A or H6A–H14A double mutation) has a strong impact on Cu(ii) speciation with component II largely predominant above pH 7.0 (Fig. 5d and S4†).
Thus, the Cu(i) binding mode is mainly affected when only one His residue is left on the peptide. With respect to Cu(ii), N-terminal modification, R5G mutation and double His mutation strongly modify its main coordination spheres at physiological pH. Furthermore, His modifications only have an impact on the components’ pK a(I/II) value. These changes are observed for Cu–Aβ peptides in the RS, but could also have an impact on the coordination mode of both Cu(i) and Cu(ii) in the CIBS, and consequently modulate ROS production by the corresponding peptides.
In this part, we have summarized the main Cu(i) and Cu(ii) coordination of the native Aβ16 and several modified counterparts in the RS. The next part aims at investigating the Cu environment in the CIBS.
Probing the His and N-terminal amine involvement in the CIBS
In order to identify the amino acid residues involved in the copper coordination in the CIBS, we studied ROS production catalyzed by Cu–Aβ in the presence of ascorbate, with the different peptides listed in Table 1. The HO˙ production was followed by the fluorescence of 7-hydroxycoumarin-3-carboxylic acid (7-OH-CCA), an oxidation product resulting from HO˙ trapping by coumarin-3-carboxylic acid (CCA). The 7-OH-CCA fluorescence is proportional to the quantity of HO˙ trapped by CCA and thus to the amount of HO˙ released by the Cu–Aβ system. 50,51
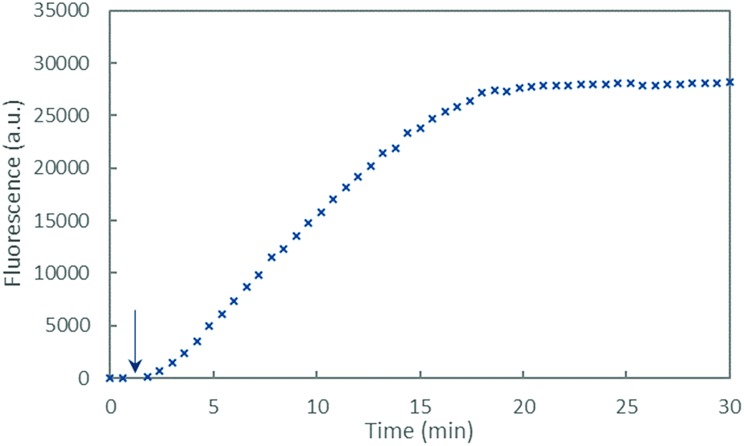
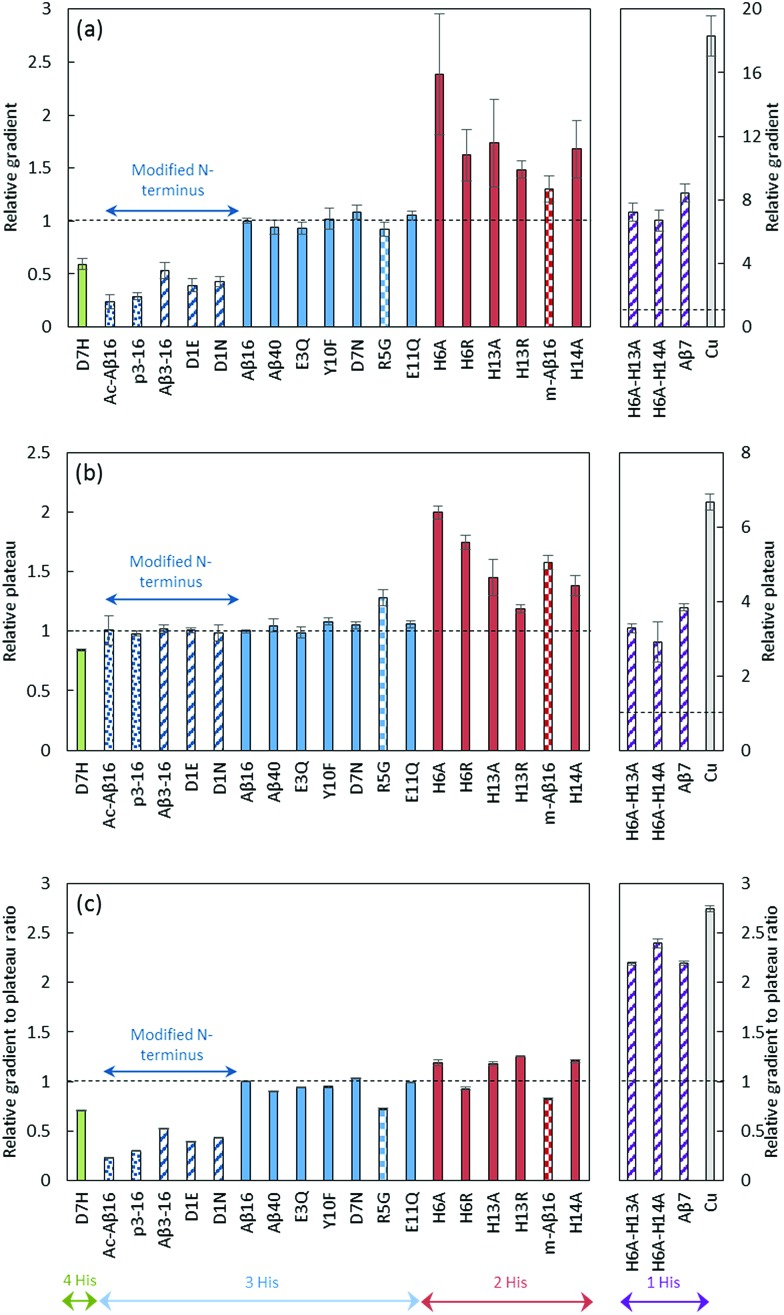
The fluorescence curve obtained with Cu–Aβ16 in the presence of ascorbate is shown in Fig. 6. The fluorescence starts to increase when ascorbate is added in solution, then grows quite linearly with time, and finally reaches a plateau that corresponds to the complete consumption of ascorbate (approximately 20 minutes). From this curve, two values were measured: the gradient of the initial slope in the linear part and the total fluorescence at the plateau. These two values are linked to the amount of HO˙ released by the Cu–Aβ system. From the fluorescence curves (ESI, Fig. S7†), the gradient of 7-OH-CCA formation (Fig. 7a) and the total fluorescence at the plateau (Fig. 7b) were measured for each peptide listed in Table 1 and for the full-length Aβ40 peptide, and expressed as relative values compared to those obtained for the Aβ16 peptide. Peptides are sorted by the number of His on the Aβ sequence: 4 His (green bar), 3 His (blue bars), 2 His (red bars) and 1 His (purple bars).
Fig. 6. Fluorescence of 7-OH-CCA as a function of time resulting from CCA oxidation by HO˙ produced by Cu–Aβ16 in the presence of ascorbate. The arrow shows the beginning of the reaction which started with the addition of ascorbate (0.5 mM) in a phosphate buffer solution (pH 7.4, 50 mM) containing Aβ16 (60 μM), Cu(ii) (50 μM) and CCA (0.5 mM).
Fig. 7. HO˙ scavenging by CCA. Initial gradient (a), plateau of fluorescence (b) and gradient to plateau ratio (c) of 7-OH-CCA fluorescence resulting from the oxidation of CCA (500 μM) in the presence of the native or modified Aβ16 peptide (60 μM), Cu(ii) (50 μM) and ascorbate (500 μM) in phosphate-buffer (50 mM) solutions at pH 7.4. Copper in buffer (grey bar) or in the presence of a peptide with 4 His (green bar), 3 His (blue bar), 2 His (red bar), 1 His (purple bar), or 3 His and a modified N-terminus (dark blue bar), coordinated predominantly in component I (plain bar), component II (striped bar) or other components (II′ and III′ (spotted bar) or IIm ((murine peptide) checkered bar), see Table 1 for details). Fluorescence curves are given in the ESI (Fig. S7).† The gradient and fluorescence at the plateau are given as relative values (n = 9, uncertainties given at the 95% confidence level) calculated as a ratio with those obtained for Cu–Aβ16. ANOVA is included in the ESI.† .
The gradient and fluorescence at the plateau values give information on the rate of 7-OH-CCA formation and on the quantity of 7-OH-CCA formed, respectively. In order to deduce the rate of HO˙ production, we used the ratio of gradient to plateau for the 7-OH-CCA formation. As such, the inherent capacities of the various peptides to scavenge HO˙, which is responsible for the different plateau intensities, were taken into account and corrected for (see Fig. 7c, and the ESI† for more details). His residues have such an ability, as demonstrated by High-Resolution Mass Spectrometry (LC-HRMS) experiments, which show that the ratio of N-terminal oxidation to the other oxidations decreases when increasing the number of His residues in the peptide sequence (see ESI, Fig. S8, Tables S2 and S3†).
Analysis of the obtained data led to several conclusions: (i) the mutations leading to the predominance of component II in the Cu(ii) binding mode in the RS (striped bars) over component (I) (plain bars) did not have a systematic impact on the HO˙ production rate (Fig. 7c). While some of these mutants induce a strong decrease in the production rate (D1E, D1N), other ones induce a weak decrease (R5G and mAβ16). H6A–H13A, H6A–H14A and Aβ7 generate HO˙ much faster but they also induce a strong modification of the Cu(i) site. In contrast to what could be anticipated, based on the reduction properties of component I and II in the RS,28 it is likely that the predominance of either component is not a key event in the HO˙ production.
(ii) The number of His residues in the Aβ sequence affects the HO˙ production rate: the fewer His residues in the Aβ sequence, the faster the hydroxyl radical production. While a clear difference appears between 1-His containing and 2- to 4-His containing peptides, less obvious changes are observed between 2-, 3- and 4-His containing peptides. Decreasing the number of His residues affects Cu(i) (and to a lesser extent Cu(ii)) affinities. 43,52–54 Hence, the contribution of loosely bound Cu in the whole process was studied: the clear difference observed here is not due to the contribution of a larger amount of Cu bound to the buffer39 or to the second site of Aβ55 in the 1-His peptides (Aβ7, H6A-H13A, H6A-H14A) compared to Aβ16 (see Fig. S9 and details in the ESI†). Thus, His mutation appears as a key event in the intrinsic production of HO˙ and the transition from 2 His residues to 1 His residue on the Aβ sequence strongly affects the reaction. The mutation of the 2 His residues affects the coordination in both the Cu(i) and Cu(ii) RS: it leads to the presence of mainly the Cu(ii) complex in component II (Table 1) and to a modification of the Cu(i) sphere (see above and in Fig. S3†). Having Cu(ii) in component I or II does not seem to be a determining factor in the HO˙ production rate (see point (i)). Hence, it is anticipated that the change in the Cu(i) RS when bound to the 1-His peptide might contribute to the increase in the observed HO˙ production rate.
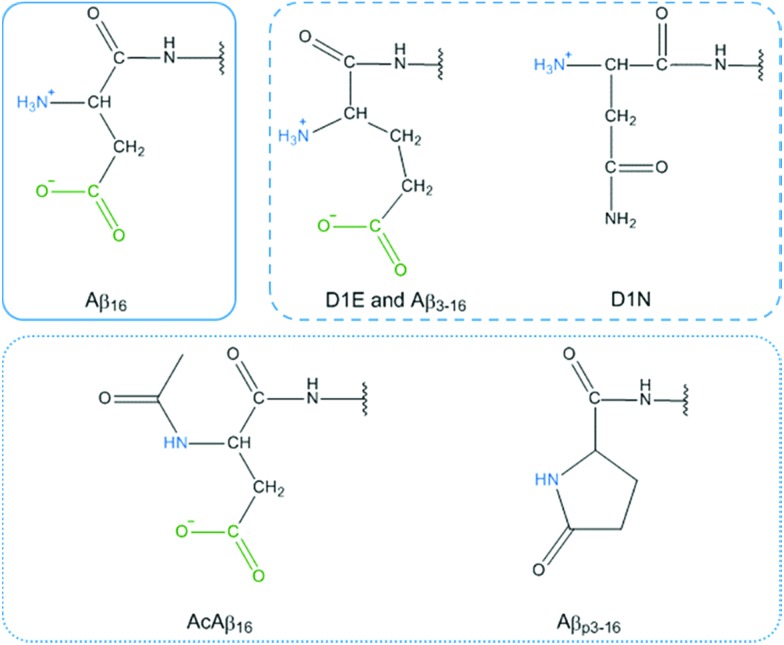
(iii) Modification of the N-terminal moiety of Aβ (dark blue bars) strongly slows down the HO˙ production rate. Several modifications were studied and can be sorted into two sub-classes: (1) modification of the side chain of the first residue (D1E, D1N, Aβ3–16) and (2) blockage of the N-terminal amine (AcAβ16 and Aβp3–16). The chemical structures of the N-terminal moieties are shown in Fig. 8.
Fig. 8. Chemical representation of the N-terminal moiety of Aβ16 (plain frame), D1E, Aβ3–16 and D1N (dashed frame) and AcAβ16 and Aβp3–16 (dotted frame). The N-terminal amine and carboxylate group are colored in blue and green respectively.
For the first sub-class, the carboxylate group present on Asp is either removed (in D1N) or still present on a side chain that is one carbon longer (in D1E and Aβ3–16) and the N-terminal amine is still available for binding. For the second sub-class, the N-terminal amine is not available for Cu(ii) binding and the carboxylate group is available only in AcAβ16. As all of the modifications (the side chain modification of the N-terminal moiety or the blockage of the N-terminal amine) resulted in a strong decrease in the HO˙ production rate, it can be assumed that both the terminal NH2 and the carboxylate group from the Asp side chain have a link with the CIBS. However, the N-terminal amine unavailability (in AcAβ16 and Aβp3–16) has a stronger effect than the changes to the side chain (in D1E, Aβ3–16 and D1N).
The results also indicate that the truncated Aβ16 peptide is a suitable model for ROS production studies as similar trends are obtained for the full-length Aβ40 peptide.
Probing the involvement of the Asp1 carboxylate group in the CIBS
The unavailability of the N-terminal amine is a key event in ROS production, as peptides with a blocked amine have the lowest HO˙ production rate. Hence, the N-terminal amine likely binds to Cu in the CIBS. Modification of the side chain (carboxylate group) of the first residue of Aβ also has a strong effect on the HO˙ production rate (Fig. 7c, dark blue striped bars), although to a lesser extent. It is worth noting that in contrast to Cu(ii), Cu(i) is not bound by the N-terminal amine in the RS. Indeed, while the Lewis acidity of Cu(ii) induces the deprotonation of the amine, Cu(i) is less able to do so, and the amine remains protonated at physiological pH. Hence, to enter the coordination sphere of Cu in the CIBS starting from Cu(i), the N-terminal amine has to be concomitantly deprotonated. With this in mind, two hypotheses may be proposed to connect the carboxylate group of the N-terminal side chain with the CIBS, either in a direct or an indirect way.
First, the carboxylate group of Asp1 can directly bind to Cu in the CIBS. This is in line with the fact that: (i) the carboxylate group of Asp1 is one of the Cu(ii) ligands at an apical position in the RS, in equilibrium with the one of Asp7 and Glu residues, 45,46,56 (ii) the HO˙ production rate of D1N and D1E is lower, because D1N no longer contains a carboxylate group and D1E forms a (NH2, COO–) 7 atom metallacycle which is less stable than the (NH2, COO–) 6 atom metallacycle formed by Asp (in Aβ16).
Second, the carboxylate group of Asp1 is not a ligand bound to copper in the CIBS, but would rather assist in the protonation/deprotonation process of the N-terminal amine (pK a = 7.8 in the presence of Cu(i), see ESI Fig. S11†) associated with the Cu–Aβ redox cycling. In this case, one expects that the effect of the carboxylate group would decrease progressively with increasing pH due to the intrinsic deprotonation of the N-terminal amine.
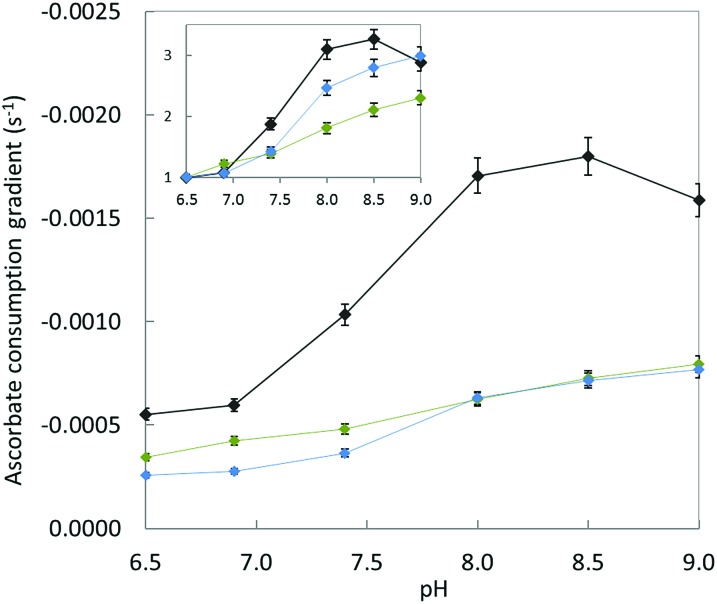
In order to discriminate between these two possibilities (i.e. COO– (Asp) directly bound to Cu or in H-interaction with the N-terminal amine), the ascorbate consumption rate was followed as a function of pH for Cu–Aβ16, Cu–D1E and Cu–D1N. The ascorbate consumption was monitored by UV spectroscopy at the wavelength of maximum ascorbate absorption (265 nm). This technique was chosen instead of the 7-OH-CCA fluorescence monitoring used in the above study as 7-OH-CCA fluorescence is very sensitive to pH50 and, as previously described, the ascorbate consumption rate mirrors the ROS production rate by Cu–Aβ. 44,50,53,56–59
Fig. 9 shows the gradient of the initial slopes of ascorbate consumption as a function of pH for each Cu–peptide system. Regardless of the peptide under focus, increasing the pH from 6.5 to 9.0 induces a two to three-fold increase in the ascorbate consumption rate which is in line with the requirement to deprotonate the N-terminal amine (inset in Fig. 9). This indicates that the presence of the Asp1 carboxylate group in Cu–Aβ16 does not help the deprotonation process. In addition, the Cu–Aβ16 ascorbate consumption rate (black curve) is much higher than the rate of the other two complexes at any measured pH, including when the N-terminal amine is deprotonated (Fig. 9). These results are strongly in favour of direct coordination of the COO– (Asp1) side chain to Cu in the CIBS.
Fig. 9. Gradient of ascorbate consumption by Cu–peptide as a function of pH. Aβ16 (black curve), D1E (blue curve) or D1N (green curve) (20 μM), Cu (10 μM) and ascorbate (100 μM) in HEPES buffer solution (pH 6.5, 7.0, or 7.4, 50 mM) or POPSO buffer solution (pH 8.0, 8.5 or 9.0, 50 mM). Inset: relative gradient calculated by dividing the gradient value at the given pH by the gradient value at pH 6.5 for each peptide, as a function of pH. Ascorbate consumption was followed by UV-visible spectroscopy at λ max = 265 nm. The UV-vis curves are shown in Fig. S10.† .
As a side note, but one that contains crucial information, this pH dependent experiment also indicates that the reduction of Cu(ii) is not the rate-limiting step in the whole ROS production mechanism. Indeed, if it were only based on the reduction potential of Cu(ii),28 one would expect slower ROS production at higher pH. This is in line with deprotonation of the N-terminal amine being a most important event in ROS production, more important than the difference between the reduction potential of Cu(ii) in components I and II.
Discussion
Model of CIBS
Previously reported electrochemical data showed that the reorganization energy between the two redox states in the EIBS is minimal (λ = 0.3 eV), indicating that the coordinating groups of both Cu(i) and Cu(ii) are likely to be the same.26 Here, we assume that this is also true for the CIBS. As a consequence, the redox state of the Cu ions will not be specified in the next paragraphs.
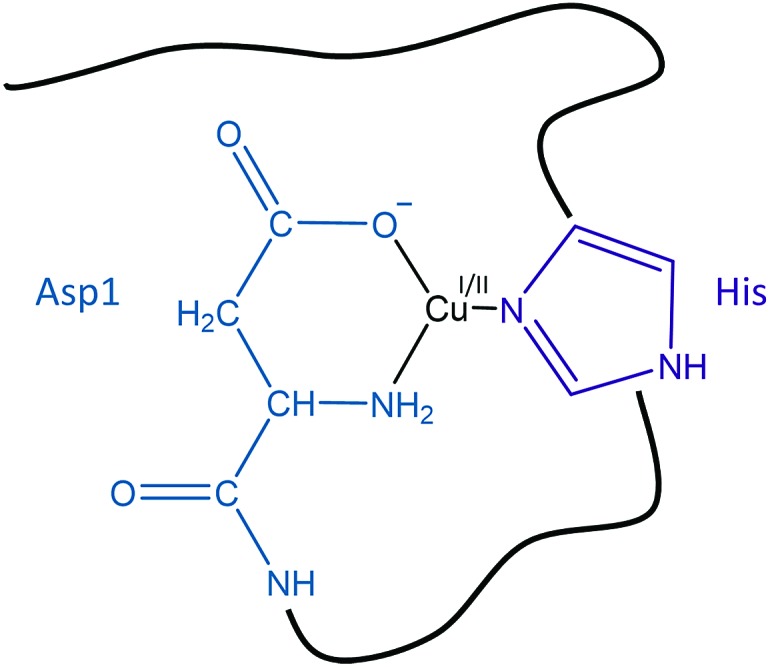
The global rate of ROS production by Cu–Aβ mainly depends (i) on the population of the CIBS, which is correlated to the coordination sphere proximity between the RS and the CIBS and (ii) on the intrinsic reactivity of the CIBS. Both points have been taken into account to identify the Cu ligands in the CIBS. In the deduced model shown in Fig. 10, the Cu ion is bound by three ligands of the Aβ peptide, namely the N-terminal amine, the carboxylate group of Asp1 and the imidazole ring of one His residue (mainly His13 or His14, based on ref. 29).
Fig. 10. Schematic view of a proposed redox competent binding mode of Aβ–Cu(i/ii) in the CIBS during ROS production.
Involvement of the N-terminal amine
The N-terminal amine is proposed to be the main anchor to the Cu centre in the CIBS. This is deduced from three main observations. First, Cu–AcAβ16 and Cu–Aβp3–16 complexes display a much lower HO˙ production rate compared to the Cu–Aβ16 species. Second, the pH dependent study of ascorbate consumption by the Cu(Aβ16) species shows that the higher the pH, the faster the ascorbate consumption, which indicates that the deprotonation of the N-terminal amine (and consequent binding to the Cu centre) favours the reaction. Last, it has been previously reported that a strong oxidative attack of Asp1 occurs during ROS production. 29,60,61
Involvement of the side chain of Asp1
The carboxylate side chain of Asp1 is also involved in Cu binding in the CIBS, thus making a 6-membered metallacycle with the N-terminal amine. This is proposed based on the lower ROS production rate of Cu–D1E, Cu–D1N and Cu–Aβ3–16 complexes compared to the Cu–Aβ16 species, as probed by HO˙ production and ascorbate consumption. The possibility of having an indirect interaction of the COO– group with the terminal NH3 + amine was disfavoured by the pH-dependent study of ascorbate consumption with Cu–D1E, Cu–D1N and Cu–Aβ16 complexes.
Involvement of the side chain of one His residue
Using the HO˙ production study, we have shown that the rate strongly increases when only one His residue is present in the sequence. This indicates either that the RS and the CIBS have very similar Cu environments or that the nature of the CIBS is changed. The first hypothesis is supported by the binding mode of Cu(i)–(Aβ7, H6A–H14A, H6A–H14A) complexes deduced from an NMR study in which Cu(i) is bound by the N-terminal amine, the Asp1 carboxylate side-chain and one His imidazole, whereas two His residues bind to the Cu(i) in the Cu–Aβ16. Having only one His residue forces the coordination of the N-terminal amine and of the side-chain of Asp1 in the Cu(i) RS. The observed increase in the ROS production rate perfectly matches the involvement of the N-terminal amine and the COO– (Asp1) group proposed above.
The CIBS model deduced here varies from our former proposition29 by the number of His residues involved (one here against the two His13 and His14 previously) and by the identification of the Asp1 bidentate binding via the N-terminal amine and the carboxylate side chain. Indeed, the involvement of the His13–His14 couple was inferred from the oxidative damage they underwent during ROS production. Such damages are also in line with the interchangeability of the two His in the CIBS. Regarding Asp1, we have, in the present work, managed to better elucidate its binding mode while in our former study, only the amino acid residue was identified.29
ROS production mechanism: a working hypothesis
Based on the present results and on literature data, 18,26,28–33,62–65 a proposed mechanism of electron transfer involving the Cu(ii) and Cu(i) complexes in the RS, the redox competent Cu(i/ii) CIBS species (Fig. 10) and the ascorbate or O2 as a substrate is proposed in Fig. S12.†
On the reductive pathway (left hand side in Fig. S12†), we propose that ascorbate coordinates to the Cu(ii) ion, resulting in a complex with 4 ligands. Reduction of the metal centre occurs and, during the last step, the oxidized ascorbate is released and the Cu(i) CIBS is formed.
On the oxidative pathway (right hand side in Fig. S12†), three substrates can be involved: O2, O2˙– and H2O2. It has been suggested that the reduction of O2 to O2˙– is the rate determining step.66 While it has been reported that Cu–Aβ can react with O2, O2˙– and H2O2, 17–20,39 further investigations of the mechanisms involved are needed to definitely demonstrate whether the proposed CIBS here is also involved in reactivity towards hydrogen peroxide and superoxide as well. η1 end-on binding of O2 to Cu(i) in the CIBS is proposed, then oxidation of the metal centre occurs concomitantly with the formation of a η1 end-on superoxo species. The release of O2˙– leads to the initial Cu(ii) CIBS species.
As pointed out, the proposed mechanism is a working hypothesis. Indeed, there are still many important questions to be investigated regarding the detailed ROS production mechanism. In particular, the reduction of the Cu(ii) centre by ascorbate via an inner-sphere mechanism has been favoured here based on calculation studies64 and previous work on Cu(i) species in aqueous media (reviewed in ref. 67). Similarly, an inner-sphere mechanism for the reduction of dioxygen is favoured based on recent calculation studies.31 Experimental data on a peptide–Cu system reminiscent of the one under focus in the present study68 and on a Cu protein in bio-inorganic models also strengthen this proposition. 65,69,70 However, from the data obtained here, outer sphere mechanisms cannot be excluded for either process. It is worth noting that the EIBS and CIBS would be identical only if the two redox processes occur via outer-sphere mechanisms. The peptide oxidation has been proposed to occur via the release of the oxidative agents (in particular HO˙) based on the detection of O2˙–, H2O2 and HO˙ and on the absence of any evidence of the Cu-oxo species,71 but participation of metal-centred oxidation cannot be fully ruled out. Also, η1 end-on binding of an oxygenated substrate has been preferred based on a minimal reorganization of the Cu coordination sphere, but a η2 side-on binding mode may be possible as well. These issues have been recently addressed by computational methods but no clear-cut result has been obtained. 30–33
Biological relevance
In the course of the experiments, it appeared that the initial rate of ROS production might be more relevant than the total amount of ROS generated, with regards to the CIBS. This is well illustrated by the comparison between Aβ16 and AcAβ16; both Cu complexes released the same amount of ROS but with a very different rate, which links to the involvement of the N-terminal amine in the CIBS.
Furthermore, the positive feedback loop of ROS production observed previously,39 i.e. the increase of ROS production by Cu–Aβ once the peptide is itself oxidized, might be linked to the nature of the CIBS found here. Indeed, His oxidation will lead to a RS closer to the CIBS, which will contribute to an increase in the ROS production rate. But this will be counter-balanced by Asp1 oxidation that will, in contrast, induce another type of CIBS, resulting in a slower rate.
Lastly, it has been shown recently that Cu–Aβ aggregates maintain ROS production ability. 72,73 So far, it is not known if the more toxic aggregated species also proceeds through a CIBS, as the monomeric Cu–Aβ species studied here does. This is well possible and is a highly relevant question. The ROS production by high molecular weight aggregates of Cu–Aβ was reported to be slower compared to that of the monomeric Cu–Aβ species.56 Assuming that ROS are also produced via a CIBS, the lower rate of reaction might originate from either a less reactive CIBS or a similar CIBS, to which the access is hampered by the formation of the aggregates and the subsequent burying of Cu sites in too rigid an environment. In contrast, it has been proposed that the Cu–Aβ2 species might stabilize the Cu(i)–O2 adduct to a larger extent than the Cu–Aβ species under focus in the present study, with the very same COO–, NH2 groups from Asp1 and one His environment. The reason for such stabilization originates from the release of geometrical constraints when Asp1 and His come from two different peptides.31 This might also be linked to the higher toxicity of dimers.74
Conclusion
In the present paper, we have investigated the effects of Aβ sequence modifications on copper-induced HO˙ production. Two modifications strongly affect the rate of the reaction: (i) the N-terminal modification of Asp1 (either the terminal amine blockage or/and the carboxylate function deletion) and (ii) the removal of 2 His residues from the peptide sequence. The influence of these modifications on the ROS production rate is indicative of the Cu binding mode in the CIBS which is responsible for ROS production. An electron transfer mechanism has been proposed, involving the RS and CIBS of Cu–Aβ, ascorbate and O2 substrates.
Thus, we provide for the first time a coordination model of the Cu–Aβ complex in the elusive state involved in ROS production. This model, based on reactivity studies, is in line with the proposition from computational studies. 30,31,33 It has been reported in the literature that Cu–Aβ could contribute to AD development by catalysing ROS production and in vitro studies showed that Cu–Aβ can produce ROS quite efficiently indeed. However, what was not known is the structure of the Cu–Aβ state that is able to produce ROS. The first experimental based model of the ROS active Cu–Aβ state presented here is considered to be of mechanistic importance and might also be the state to combat for suppressing Cu–Aβ mediated ROS production.
Due to the high flexibility of the Aβ peptide, the redox state of the copper centre controls the environment of the complex, resulting in two very different structures for Cu(i) and Cu(ii) inside the peptide. Hence, ROS production proceeds through the CIBS. Such a mechanism of ROS production might be well generalized to other flexible peptides accommodating different coordination spheres in Cu(i) and Cu(ii) redox states. This includes α-synuclein involved in Parkinson’s disease 56,75–77 and biologically relevant Aβ peptides including familial AD mutants. 22,78 In particular, for familial mutants of AD or other peptides, our results show that one cannot predict the impact of a mutation on the ROS production rate by using the RS coordination, because the CIBS is structurally different. Hence, in order to anticipate whether a mutation can impact ROS production, the structure of the CIBS needs to be known first.
Experimental section
Chemicals
Cu(ii) used was from CuSO4·5(H2O) and purchased from Sigma. A 2 mM stock solution of Cu(ii) was prepared using ultrapure water and kept at –20 °C. Phosphate buffer was bought from Sigma-Aldrich and dissolved in ultrapure water to obtain a solution of 0.1 M concentration and pH 7.4. HEPES buffer was bought from Sigma and dissolved in ultrapure water to obtain 0.5 M solutions at pH 6.5, 7.0 and 7.4. POPSO buffer was bought from Sigma and dissolved in ultrapure water to obtain 0.5 M solutions at pH 8.0 and 8.5. Ammonium bicarbonate was purchased from Fluka. A stock solution (0.1 M, pH 8.0) was prepared in ultrapure water. Ascorbate solutions were freshly prepared a few minutes prior to each experimental set by dissolving sodium l-ascorbate (Fluka) in ultrapure water. A 1 mM stock solution of coumarin-3-carboxylic acid (CCA) (from Sigma) was prepared using the phosphate buffer solution (0.1 M, pH 7.4) at room temperature.
Peptides
All of the peptides (see Table 1 for the sequences) were bought from GeneCust (Dudelange, Luxembourg), with purity grade >95%. Stock solutions of the peptides were prepared by dissolving the powder in ultrapure water (resistivity 18.2 MΩ) (resulting pH = 2). The peptide concentration was then determined at pH 2 by UV-visible absorption of Tyr10 considered as free tyrosine (Δε (276–296 nm) = 1410 M–1 cm–1) for a tyrosine-containing peptide, by UV-visible absorption of Phe4 (Δε (258–280 nm) = 195 M–1 cm–1) for Aβ7 and by UV-visible absorption of Phe4 and Phe10 (Δε (258–280 nm) = 390 M–1 cm–1) for Y10F and m-Aβ16. A stock solution of the Aβ40 peptide was prepared by dissolving the powder in NaOH (50 mM) and passing the solution through FPLC to obtain the monomeric fraction. The peptide concentration was then determined in NaOH (50 mM) by UV-visible absorption of Tyr10, considered as free tyrosine (Δε (293–360 nm) = 2400 M–1 cm–1). All pH values are given with a ±0.2 pH unit error.
HO˙ scavenging monitoring
Coumarin-3-carboxylic acid (CCA) was used as a probe to detect HO˙, as it reacts with CCA to form the 7-hydroxycoumarin-3-carboxylic acid (7-OH-CCA), which is fluorescent at 452 nm upon excitation at 395 nm. The intensity of the fluorescence signal is proportional to the number of 7-OH-CCA molecules formed, which in turn is proportional to the HO˙ radicals released.51 As HO˙ can react with the HEPES buffer, phosphate buffer is preferred in this particular test. Fluorescence experiments were performed on a multimode microplate reader system CLARIOstar (BMG Labtech). An automatic injector was used to add ascorbate (500 μM) into the wells containing phosphate-buffer (50 mM, pH 7.4) solutions with Aβ peptide or mutant (60 μM), Cu2+ (50 μM) and CCA (0.5 mM). The fluorescence was measured every 36 s for 1 hour, and the ascorbate was injected at 72 s which started the reaction.
Ascorbate consumption experiments
UV-vis spectra were recorded on an Agilent 8453 UV-Visible spectrophotometer at 25 °C. The intensity of the ascorbate (Asc) absorption band at λ max = 265 nm (ε = 14 500 M–1 cm–1) was monitored as a function of the time in HEPES buffer solution (pH 6.5, 7.0, or 7.4) or POPSO buffer solution (pH 8.0 or 8.5) containing Aβ16, D1E–Aβ16, D1N–Aβ16, AcAβ16, Aβ3–16 or Aβp3–16 (20 μM), Cu (10 μM) and ascorbate (100 μM). The absorbance was measured every 10 s for 40 min and the gradient was calculated with the first 6 measurements (1 min) of the experiment after the addition of Cu2+ to start the reaction. Each experiment was performed 3 times in order to ensure the reliability of the measure.
1H NMR spectroscopy
Studies were performed in D2O. However, for clarity and consistency, we decided to use the notation pH even when the measurements were made in D2O. The pD was measured using a classical glass electrode according to pD = pH* + 0.4, and the apparent pH value was adjusted according to the equation pH = (pD – 0.32)/1.044,79 or according to pH = 0.929pH* + 0.41,80 to be in ionization conditions equivalent to those in H2O.
Stock solutions of H6A–H14A and Aβ16 were prepared by dissolving the powders in D2O and titrating as described above. Cu(i) addition to H6A–H14A and Aβ16 was carried out as follows: 1 equivalent of Cu(ii) was added to a 0.5 mM solution of peptide in 0.2 M phosphate buffer in D2O. The buffer pH was adjusted to 7.3 using NaOD and D2SO4. 2 equivalents of 0.1 M freshly prepared dithionite solution in D2O per Cu ion were added under an Ar atmosphere to the Cu(ii)–Aβ solution in a sealed NMR tube.
The 1H NMR experiments were recorded on a Bruker Avance 500 spectrometer equipped with a 5 mm triple resonance inverse Z-gradient probe (TBI 1H, 31P, BB). The presaturation of the water signal was achieved with a zqpr sequence (Bruker). 1H NMR experiments are performed at 298 K.
Acknowledgments
The authors acknowledge the European Synchrotron Radiation Facility for the provision of beamtime and the BM30B (FAME) beamline staff for their support, Prof. E. Guillon, Dr S. Sayen and A. Conte-Daban for their help in the recording of the XANES data, L. Debrauwer and E. Jamin for providing the Orbitrap mass spectrometer (MetaToul-AXIOM (INRA, UMR1331 Toxalim, Toulouse, France), MetaboHUB-ANR-11-INBS-0010), Christian Bijani for recording the 1H NMR data and L. Rechignat for recording the EPR data. CH thanks the ERC aLzINK – Contract no. 638712 for financial support. This work was supported by the French agency for research ANR (grant ANR-13-BSV5-0016).
Footnotes
References
- Butterfield D. A., Lauderback C. M. Free Radical Biol. Med. 2002;32:1050–1060. doi: 10.1016/s0891-5849(02)00794-3. [DOI] [PubMed] [Google Scholar]
- Butterfield D. A., Reed T., Newman S. F., Sultana R. Free Radical Biol. Med. 2007;43:658–677. doi: 10.1016/j.freeradbiomed.2007.05.037. [DOI] [PMC free article] [PubMed] [Google Scholar]
- Markesbery W. R. Free Radical Biol. Med. 1997;23:134–147. doi: 10.1016/s0891-5849(96)00629-6. [DOI] [PubMed] [Google Scholar]
- Yatin S. M., Varadarajan S., Link C. D., Butterfield D. A. Neurobiol. Aging. 1999;20:325–330. doi: 10.1016/s0197-4580(99)00056-1. [DOI] [PubMed] [Google Scholar]
- Zhao Y., Zhao B. Oxid. Med. Cell. Longevity. 2013;2013:316523. doi: 10.1155/2013/316523. [DOI] [PMC free article] [PubMed] [Google Scholar]
- Tönnies E., Trushina E. J. Alzheimer’s Dis. 2017:1–17. doi: 10.3233/JAD-161088. [DOI] [PMC free article] [PubMed] [Google Scholar]
- Kalinowski D. S., Stefani C., Toyokuni S., Ganz T., Anderson G. J., Subramaniam N. V., Trinder D., Olynyk J. K., Chua A., Jansson P. J. Biochim. Biophys. Acta, Mol. Cell Res. 2016;1863:727–748. doi: 10.1016/j.bbamcr.2016.01.026. [DOI] [PubMed] [Google Scholar]
- Ayton S., Lei P., Bush A. I. Free Radical Biol. Med. 2013;62:76–89. doi: 10.1016/j.freeradbiomed.2012.10.558. [DOI] [PubMed] [Google Scholar]
- Kozlowski H., Luczkowski M., Remelli M., Valensin D. Coord. Chem. Rev. 2012;256:2129–2141. [Google Scholar]
- Eskici G., Axelsen P. H. Biochemistry. 2012;51:6289–6311. doi: 10.1021/bi3006169. [DOI] [PubMed] [Google Scholar]
- Li K., Reichmann H. J. Neural Transm. 2016;123:389–399. doi: 10.1007/s00702-016-1508-7. [DOI] [PubMed] [Google Scholar]
- Ayton S., Lei P., Bush A. I. Neurotherapeutics. 2015;12:109–120. doi: 10.1007/s13311-014-0312-z. [DOI] [PMC free article] [PubMed] [Google Scholar]
- Jellinger K. A. Int. Rev. Neurobiol. 2013;110:1–47. doi: 10.1016/B978-0-12-410502-7.00002-8. [DOI] [PubMed] [Google Scholar]
- Jomova K., Vondrakova D., Lawson M., Valko M. Mol. Cell. Biochem. 2010;345:91–104. doi: 10.1007/s11010-010-0563-x. [DOI] [PubMed] [Google Scholar]
- Lovell M. A., Robertson J. D., Teesdale W. J., Campbell J. L., Markesbery W. R. J. Neurol. Sci. 1998;158:47–52. doi: 10.1016/s0022-510x(98)00092-6. [DOI] [PubMed] [Google Scholar]
- Miller L. M., Wang Q., Telivala T. P., Smith R. J., Lanzirotti A., Miklossy J. J. Struct. Biol. 2006;155:30–37. doi: 10.1016/j.jsb.2005.09.004. [DOI] [PubMed] [Google Scholar]
- Hureau C., Faller P. Biochimie. 2009;91:1212–1217. doi: 10.1016/j.biochi.2009.03.013. [DOI] [PubMed] [Google Scholar]
- Reybier K., Ayala S., Alies B., Rodrigues J. V., Bustos Rodriguez S., La Penna G., Collin F., Gomes C. M., Hureau C., Faller P. Angew. Chem., Int. Ed. Engl. 2016;55:1085–1089. doi: 10.1002/anie.201508597. [DOI] [PubMed] [Google Scholar]
- Chassaing S., Collin F., Dorlet P., Gout J., Hureau C., Faller P. Curr. Top. Med. Chem. 2012;12:2573–2595. doi: 10.2174/1568026611212220011. [DOI] [PubMed] [Google Scholar]
- Smith D. G., Cappai R., Barnham K. J. Biochim. Biophys. Acta, Biomembr. 2007;1768:1976–1990. doi: 10.1016/j.bbamem.2007.02.002. [DOI] [PubMed] [Google Scholar]
- Hureau C. Coord. Chem. Rev. 2012;256:2164–2174. [Google Scholar]
- Hureau C., Dorlet P. Coord. Chem. Rev. 2012;256:2175–2187. [Google Scholar]
- Drew S. C., Barnham K. J. Acc. Chem. Res. 2011;44:1146–1155. doi: 10.1021/ar200014u. [DOI] [PubMed] [Google Scholar]
- Hureau C., Balland V., Coppel Y., Solari P. L., Fonda E., Faller P. J. Biol. Inorg Chem. 2009;14:995–1000. doi: 10.1007/s00775-009-0570-0. [DOI] [PubMed] [Google Scholar]
- Shearer J., Szalai V. A. J. Am. Chem. Soc. 2008;130:17826–17835. doi: 10.1021/ja805940m. [DOI] [PMC free article] [PubMed] [Google Scholar]
- Balland V., Hureau C., Saveant J.-M. Proc. Natl. Acad. Sci. U. S. A. 2010;107:17113–17118. doi: 10.1073/pnas.1011315107. [DOI] [PMC free article] [PubMed] [Google Scholar]
- Faller P., Hureau C., La Penna G. Acc. Chem. Res. 2014;47:2252–2259. doi: 10.1021/ar400293h. [DOI] [PubMed] [Google Scholar]
- Trujano-Ortiz L. G., González F. J., Quintanar L. Inorg. Chem. 2015;54:4–6. doi: 10.1021/ic501941a. [DOI] [PubMed] [Google Scholar]
- Cassagnes L.-E., Hervé V., Nepveu F., Hureau C., Faller P., Collin F. Angew. Chem.,Int. Ed. 2013;52:11110–11113. doi: 10.1002/anie.201305372. [DOI] [PubMed] [Google Scholar]
- La Penna G., Hureau C., Andreussi O., Faller P. J. Phys. Chem. B. 2013;117:16455–16467. doi: 10.1021/jp410046w. [DOI] [PubMed] [Google Scholar]
- Mirats A., Alí-Torres J., Rodríguez-Santiago L., Sodupe M., La Penna G. Phys. Chem. Chem. Phys. 2015;17:27270–27274. doi: 10.1039/c5cp04025f. [DOI] [PubMed] [Google Scholar]
- Furlan S., Hureau C., Faller P., La Penna G. J. Phys. Chem. B. 2012;116:11899–11910. doi: 10.1021/jp308977s. [DOI] [PubMed] [Google Scholar]
- Prosdocimi T., De Gioia L., Zampella G., Bertini L. J. Biol. Inorg Chem. 2016;21:197–212. doi: 10.1007/s00775-015-1322-y. [DOI] [PubMed] [Google Scholar]
- Alies B., Eury H., Bijani C., Rechignat L., Faller P., Hureau C. Inorg. Chem. 2011;50:11192–11201. doi: 10.1021/ic201739n. [DOI] [PubMed] [Google Scholar]
- Karr J. W., Szalai V. A. J. Am. Chem. Soc. 2007;129:3796–3797. doi: 10.1021/ja068952d. [DOI] [PubMed] [Google Scholar]
- Eury H., Bijani C., Faller P., Hureau C. Angew. Chem., Int. Ed. 2011;50:901–905. doi: 10.1002/anie.201005838. [DOI] [PubMed] [Google Scholar]
- Alies B., Bijani C., Sayen S., Guillon E., Faller P., Hureau C. Inorg. Chem. 2012;51:12988–13000. doi: 10.1021/ic302097d. [DOI] [PubMed] [Google Scholar]
- Kowalik-Jankowska T., Ruta M., Wiśniewska K., Łankiewicz L. J. Inorg. Biochem. 2003;95:270–282. doi: 10.1016/s0162-0134(03)00128-4. [DOI] [PubMed] [Google Scholar]
- Cheignon C., Faller P., Testemale D., Hureau C., Collin F. Metallomics. 2016;8:1081–1089. doi: 10.1039/c6mt00150e. [DOI] [PMC free article] [PubMed] [Google Scholar]
- Minicozzi V., Stellato F., Comai M., Serra M. D., Potrich C., Meyer-Klaucke W., Morante S. J. Biol. Chem. 2008;283:10784–10792. doi: 10.1074/jbc.M707109200. [DOI] [PubMed] [Google Scholar]
- Syme C. D., Nadal R. C., Rigby S. E. J., Viles J. H. J. Biol. Chem. 2004;279:18169–18177. doi: 10.1074/jbc.M313572200. [DOI] [PubMed] [Google Scholar]
- Kau L. S., Spira-Solomon D. J., Penner-Hahn J. E., Hodgson K. O., Solomon E. I. J. Am. Chem. Soc. 1987;109:6433–6442. [Google Scholar]
- Alies B., Badei B., Faller P., Hureau C. Chem.–Eur. J. 2012;18:1161–1167. doi: 10.1002/chem.201102746. [DOI] [PubMed] [Google Scholar]
- Alies B., Sasaki I., Proux O., Sayen S., Guillon E., Faller P., Hureau C. Chem. Commun. 2013;49:1214–1216. doi: 10.1039/c2cc38236a. [DOI] [PubMed] [Google Scholar]
- Hureau C., Coppel Y., Dorlet P., Solari P. L., Sayen S., Guillon E., Sabater L., Faller P. Angew. Chem., Int. Ed. 2009;48:9522–9525. doi: 10.1002/anie.200904512. [DOI] [PubMed] [Google Scholar]
- Dorlet P., Gambarelli S., Faller P., Hureau C. Angew. Chem., Int. Ed. 2009;48:9273–9276. doi: 10.1002/anie.200904567. [DOI] [PubMed] [Google Scholar]
- El Khoury Y., Dorlet P., Faller P., Hellwig P. J. Phys. Chem. B. 2011;115:14812–14821. doi: 10.1021/jp207328y. [DOI] [PubMed] [Google Scholar]
- Drew S. C., Noble C. J., Masters C. L., Hanson G. R., Barnham K. J. J. Am. Chem. Soc. 2009;131:1195–1207. doi: 10.1021/ja808073b. [DOI] [PubMed] [Google Scholar]
- Gomez-Castro C. Z., Vela A., Quintanar L., Grande-Aztatzi R., Mineva T., Goursot A. J. Phys. Chem. B. 2014;118:10052–10064. doi: 10.1021/jp5047529. [DOI] [PubMed] [Google Scholar]
- Cheignon C., Collin F., Faller P., Hureau C. Dalton Trans. 2016;45:12627–12631. doi: 10.1039/c6dt01979j. [DOI] [PMC free article] [PubMed] [Google Scholar]
- Manevich Y., Held K. D., Biaglow J. E. Radiat. Res. 1997;148:580–591. [PubMed] [Google Scholar]
- Alies B., Renaglia E., Rózga M., Bal W., Faller P., Hureau C. Anal. Chem. 2013;85:1501–1508. doi: 10.1021/ac302629u. [DOI] [PubMed] [Google Scholar]
- Young T. R., Kirchner A., Wedd A. G., Xiao Z. Metallomics. 2014;6:505–517. doi: 10.1039/c4mt00001c. [DOI] [PubMed] [Google Scholar]
- Conte-Daban A., Borghesani V., Sayen S., Guillon E., Journaux Y., Gontard G., Lisnard L., Hureau C. Anal. Chem. 2017;89:2155–2162. doi: 10.1021/acs.analchem.6b04979. [DOI] [PMC free article] [PubMed] [Google Scholar]
- Ginotra Y. P., Ramteke S. N., Walke G. R., Rapole S., Kulkarni P. P. Free Radical Res. 2015:1–29. doi: 10.3109/10715762.2013.848430. [DOI] [PubMed] [Google Scholar]
- Pedersen J. T., Chen S. W., Borg C. B., Ness S., Bahl J. M., Heegard N. H., Dobson C. M., Hemmingsen L., Cremades N., Teilum K. J. Am. Chem. Soc. 2016;138:3966–3969. doi: 10.1021/jacs.5b13577. [DOI] [PMC free article] [PubMed] [Google Scholar]
- Atrián-Blasco E., Cerrada E., Conte-Daban A., Testemale D., Faller P., Laguna M., Hureau C. Metallomics. 2015;7:1229–1232. doi: 10.1039/c5mt00077g. [DOI] [PubMed] [Google Scholar]
- Noël S., Perez F., Pedersen J. T., Alies B., Ladeira S., Sayen S., Guillon E., Gras E., Hureau C. J. Inorg. Biochem. 2012;117:322–325. doi: 10.1016/j.jinorgbio.2012.05.016. [DOI] [PubMed] [Google Scholar]
- Jiang D., Li X., Liu L., Yagnik G. B., Zhou F. J. Phys. Chem. B. 2010;114:4896–4903. doi: 10.1021/jp9095375. [DOI] [PMC free article] [PubMed] [Google Scholar]
- Inoue K., Nakagawa A., Hino T., Oka H. Anal. Chem. 2009;81:1819–1825. doi: 10.1021/ac802162n. [DOI] [PubMed] [Google Scholar]
- Kowalik-Jankowska T., Ruta M., Wiśniewska K., Łankiewicz L., Dyba M. J. Inorg. Biochem. 2004;98:940–950. doi: 10.1016/j.jinorgbio.2004.03.001. [DOI] [PubMed] [Google Scholar]
- Hewitt N., Rauk A. J. Phys. Chem. B. 2009;113:1202–1209. doi: 10.1021/jp807327a. [DOI] [PubMed] [Google Scholar]
- Giacovazzi R., Ciofini I., Rao L., Amatore C., Adamo C. Phys. Chem. Chem. Phys. 2014;16:10169–10174. doi: 10.1039/c3cp54839b. [DOI] [PubMed] [Google Scholar]
- Que L., Tolman W. B. Nature. 2008;455:333–340. doi: 10.1038/nature07371. [DOI] [PubMed] [Google Scholar]
- Solomon E. I., Heppner D. E., Johnston E. M., Ginsbach J. W., Cirera J., Qayyum M., Kieber-Emmons M. T., Kjaergaard C. H., Hadt R. G., Tian L. Chem. Rev. 2014;114:3659–3853. doi: 10.1021/cr400327t. [DOI] [PMC free article] [PubMed] [Google Scholar]
- Strizhak P. Theor. Exp. Chem. 1994;30:239–244. [Google Scholar]
- Burg A., Meyerstein D. Adv. Inorg. Chem. 2012;64:219–261. [Google Scholar]
- Arcos-López T., Qayyum M., Rivillas-Acevedo L., Miotto M. C., Grande-Aztatzi R., Fernández C. O., Hedman B., Hodgson K. O., Vela A., Solomon E. I. Inorg. Chem. 2016;55:2909–2922. doi: 10.1021/acs.inorgchem.5b02794. [DOI] [PMC free article] [PubMed] [Google Scholar]
- Cowley R. E., Cirera J., Qayyum M. F., Rokhsana D., Hedman B., Hodgson K. O., Dooley D. M., Solomon E. I. J. Am. Chem. Soc. 2016;138:13219. doi: 10.1021/jacs.6b05792. [DOI] [PMC free article] [PubMed] [Google Scholar]
- Peterson R. L., Ginsbach J. W., Cowley R. E., Qayyum M. F., Himes R. A., Siegler M. A., Moore C. D., Hedman B., Hodgson K. O., Fukuzumi S. J. Am. Chem. Soc. 2013;135:16454–16467. doi: 10.1021/ja4065377. [DOI] [PMC free article] [PubMed] [Google Scholar]
- Engelmann X., Monte-Pérez I., Ray K. Angew. Chem., Int. Ed. 2016;55:7632–7649. doi: 10.1002/anie.201600507. [DOI] [PubMed] [Google Scholar]
- Parthasarathy S., Yoo B., McElheny D., Tay W., Ishii Y. J. Biol. Chem. 2014;289:9998–10010. doi: 10.1074/jbc.M113.511345. [DOI] [PMC free article] [PubMed] [Google Scholar]
- Mayes J., Tinker-Mill C., Kolosov O., Zhang H., Tabner B. J., Allsop D. J. Biol. Chem. 2014;289:12052–12062. doi: 10.1074/jbc.M113.525212. [DOI] [PMC free article] [PubMed] [Google Scholar]
- Roberts B. R., Ryan T. M., Bush A. I., Masters C. L., Duce J. A. J. Neurochem. 2012;120:149–166. doi: 10.1111/j.1471-4159.2011.07500.x. [DOI] [PubMed] [Google Scholar]
- Valensin D., Dell’Acqua S., Kozlowski H., Casella L. J. Inorg. Biochem. 2016;163:292–300. doi: 10.1016/j.jinorgbio.2016.04.012. [DOI] [PubMed] [Google Scholar]
- Rodríguez E. E., Arcos-López T., Trujano-Ortiz L. G., Fernández C. O., González F. J., Vela A., Quintanar L. J. Biol. Inorg Chem. 2016;21:691–702. doi: 10.1007/s00775-016-1376-5. [DOI] [PubMed] [Google Scholar]
- Miotto M. C., Rodriguez E. E., Valiente-Gabioud A. A., Torres-Monserrat V., Binolfi A., Quintanar L., Zweckstetter M., Griesinger C., Fernandez C. O. Inorg. Chem. 2014;53:4350–4358. doi: 10.1021/ic4031377. [DOI] [PubMed] [Google Scholar]
- Holtzman D. M., Morris J. C., Goate A. M. Sci. Transl. Med. 2011;3:77sr71. doi: 10.1126/scitranslmed.3002369. [DOI] [PMC free article] [PubMed] [Google Scholar]
- Delgado R., Da Silva J. F., Amorim M., Cabral M., Chaves S., Costa J. Anal. Chim. Acta. 1991;245:271–282. [Google Scholar]
- Krȩżel A., Bal W. J. Inorg. Biochem. 2004;98:161–166. doi: 10.1016/j.jinorgbio.2003.10.001. [DOI] [PubMed] [Google Scholar]
Associated Data
This section collects any data citations, data availability statements, or supplementary materials included in this article.


