Abstract
Purpose
Repeated computed tomography (CT) scans are prescribed for some clinical applications such as lung nodule surveillance. Several studies have demonstrated that incorporating a high‐quality prior image into the reconstruction of subsequent low‐dose CT (LDCT) acquisitions can either improve image quality or reduce data fidelity requirements. Our proposed previous normal‐dose image induced nonlocal means (ndiNLM) regularization method for LDCT is an example of such a method. However, one major concern with prior image based methods is that they might produce false information when the prior image and the current LDCT image show different structures (for example, if a lung nodule emerges, grows, shrinks, or disappears over time). This study aims to assess the performance of the ndiNLM regularization method in situations with change in anatomy.
Method
We incorporated the ndiNLM regularization into the statistical image reconstruction (SIR) framework for reconstruction of subsequent LDCT images. Because of its patch‐based search mechanism, a rough registration between the prior image and the current LDCT image is adequate for the SIR‐ndiNLM method. We assessed the performance of the SIR‐ndiNLM method in lung nodule surveillance for two different scenarios: (a) the nodule was not found in a baseline exam but appears in a follow‐up LDCT scan; (b) the nodule was present in a baseline exam but disappears in a follow‐up LDCT scan. We further investigated the effect of nodule size on the performance of the SIR‐ndiNLM method.
Results
We found that a relatively large search‐window (e.g., 33 × 33) should be used for the SIR‐ndiNLM method to account for misalignment between the prior image and the current LDCT image, and to ensure that enough similar patches can be found in the prior image. With proper selection of other parameters, experimental results with two patient datasets demonstrated that the SIR‐ndiNLM method did not miss true nodules nor introduce false nodules in the lung nodule surveillance scenarios described above. We also found that the SIR‐ndiNLM reconstruction shows improved image quality when the prior image is similar to the current LDCT image in anatomy. These gains in image quality might appear small upon visual inspection, but they can be detected using quantitative measures. Finally, the SIR‐ndiNLM method also performed well in ultra‐low‐dose conditions and with different nodule sizes.
Conclusions
This study assessed the performance of the SIR‐ndiNLM method in situations in which the prior image and the current LDCT image show substantial anatomical differences, specifically, changes in lung nodules. The experimental results demonstrate that the SIR‐ndiNLM method does not introduce false lung nodules nor miss true nodules, which relieves the concern that this method might produce false information. However, there is insufficient evidence that these findings will hold true for all kinds of anatomical changes.
Keywords: anatomical change, low‐dose CT, nonlocal means, prior image
1. Introduction
Repeated computed tomography (CT) scans are conducted in many clinical applications including disease monitoring,1, 2 perfusion imaging,3, 4 image‐guided radiotherapy,5, 6 and image‐guided surgery.7, 8 For instance, during lung nodule surveillance, nodules are assessed and monitored for changes via repeated CT scans over a period of time.9, 10, 11 In image‐guided radiotherapy, lung tumors are tracked during therapy and evaluated for treatment follow‐up through sequential CT scans.6, 12 The accumulated radiation dose from these multiple acquisitions can be substantial.13 To minimize patient exposure while optimizing the utility of the radiation dose, a normal‐dose/high‐quality scan can be performed first to establish a reference, followed by a series of low‐dose CT (LDCT) scans. The LDCT scans can be reconstructed independently by statistical image reconstruction (SIR) methods14, 15, 16, 17, 18, 19, 20, 21, 22, 23 to suppress noise and streak artifacts, using information from current acquisition only. Nevertheless, the previously acquired normal‐dose image can be exploited as prior information due to similarities between the normal‐dose image and the series of reconstructed images from these scans. While some misalignment and deformation may occur within the image series, these may be mitigated through the registration of the image series. Using a high‐quality prior image to improve the follow‐up low‐dose scans reconstruction has recently become a subject of interest to researchers,24, 25, 26, 27, 28, 29, 30, 31, 32, 33, 34, 35 and it has demonstrated great potential for improving image quality or further reducing data fidelity requirements. For instance, Nett et al.24 incorporated a preregistered fully sampled prior image into the prior image constrained compressed sensing (PICCS) framework36 for iterative reconstruction of subsequent under‐sampled CT scans. Lee et al.29 developed an adaptive PICCS method that constructs a relaxation map that detects mismatched regions between the high‐quality prior image and the current LDCT image for improved reconstruction. Stayman et al.30, 32 proposed a prior image registration penalized likelihood estimation (PIRPLE) framework, in which the high‐quality prior image was formulated into a joint estimation framework for both image registration and image reconstruction to better capture the anatomical motion among different scans. Zhang et al.33, 34 predicted Markov random field (MRF) coefficients from previous normal‐dose CT image and exploited the texture information to improve current LDCT reconstruction. Moreover, Ma et al.26, 28, 31 proposed previous normal‐dose image induced nonlocal means (ndiNLM) methods to improve the follow‐up LDCT image reconstruction in interventional and perfusion imaging, wherein the prior normal‐dose image was also pre‐registered with the low‐dose scans. Because of its patch‐based search mechanism, the ndiNLM approach does not depend heavily on registration accuracy, therefore a rough registration is adequate in practice.26, 28, 31 This is an advantage compared to the pixel‐based approaches, which typically require more accurate registration that can be difficult to achieve because of noise and artifacts in the LDCT image.
While the prior image based reconstruction methods have certain advantages, one major concern with them is that they might introduce false structures or miss true structures, when the high‐quality prior image and the current LDCT image have different structures – for example, if a lung nodule emerges, grows, shrinks, or disappears over time. In this work, we assessed the performance of the SIR‐ndiNLM method in two mock lung nodule surveillance scenarios9, 10, 11 where the prior image and the current LDCT image show anatomical changes, including nodules, airways, and other structures. Specifically, the prior image has no lung nodule but the current LDCT image has a nodule, and vice versa. Furthermore, we examined the impact of parameter selection and prior image selection, which are also important characteristics of the method affecting the SIR‐ndiNLM reconstruction. Finally, we investigated whether reduced data fidelity or different nodule sizes affect the performance of SIR‐ndiNLM.
The remainder of this paper will proceed as follows. In Section Method, we describe the SIR framework and the formulation of the ndiNLM regularization. Section Results assess the performance of the SIR‐ndiNLM method with patient studies. After discussing existing issues and future research directions, we draw conclusions in Section Conclusions.
2. Methods and materials
2.A. Statistical image reconstruction
Assuming monochromatic x‐ray generation, the acquired CT transmission data (pre‐log) after system calibrations can be described as:37, 38, 39
| (1) |
where denotes the expected value of the number of x‐ray photons collected by detector bin i, and is the variance of the electronic noise.
Based on above statistical model and the use of the Lambert–Beer's law, the relationship between the mean and variance of line integral measurements (post‐log) can be written as:37, 38
| (2) |
where and denote the mean and the variance, respectively, of line integral ; denotes the number of x‐ray photons just before entering the patient and moving toward the detector, and can be measured by air scan.
After obtaining the line integral measurements, x‐ray CT image reconstruction can be formulated to optimize a penalized weighted least‐squares (PWLS) objective function in the image domain, which is written as:14, 15, 40
| (3) |
where y denotes the vector of line integral measurements; A is the projection matrix whose element is calculated as the intersection length of projection ray with pixel; μ is the vector of attenuation coefficients to be reconstructed; is the covariance matrix, which is diagonal when assuming that the measurement among different detector bins are statistically independent, and . The symbols T and −1 indicate transpose and inverse operators respectively. Finally, denotes a penalty term (or regularization), and is a scalar control parameter that allows one to tune the PWLS estimation for a specific noise‐resolution trade‐off.
2.B. Overview of the ndiNLM regularization
The nonlocal means (NLM) algorithm41 was proposed to suppress image noise while preserving edge information for natural images. This algorithm exploits the high degree of information redundancy that typically exists in images, and reduces image noise by replacing each pixel intensity with a weighted average of its neighbors [called a search‐window (SW)] according to patch similarity, where the patch of a pixel can be defined as a squared region centered at that pixel. The NLM algorithm can be directly applied to the filtered back‐projection (FBP) reconstructed LDCT images,42, 43, 44 which are typically degraded with noise and streak artifacts. Mathematically, the NLM algorithm can be described as:41
| (4) |
where the vector (the superscript LD denotes “low‐dose”) represents the FBP reconstructed LDCT image, denotes the intensity of pixel j after the NLM filtering, denotes the SW of pixel j, k denotes the pixel index within the SW of pixel j, and is the weighting coefficient. This coefficient is given as:41
| (5) |
where is the normalizing constant
| (6) |
and PW denotes a patch‐window, and the weighted Euclidean distance between two patches, , is computed as the distance between two intensity vectors in high dimensional space with a Gaussian kernel ( is the standard deviation of the Gaussian kernel) to weigh the contribution to each dimension. h is the filtering parameter that controls the decay of the exponential function as well as the weighting coefficient. When h is small, the image tends to be weakly smoothed; when h is large, the image tends to be strongly smoothed.
While the NLM algorithm can suppress noise to a great extent, it is less effective in removing streak artifacts from LDCT images.43 Moreover, the NLM filtering can blur subtle structures and low contrast objects when the noise level is relatively high in LDCT images.
Studies where a previous normal‐dose CT image is available have shown that this image can be used as prior information and formulated into the NLM framework for denoizing of subsequent LDCT images. Our previous work called this the previous normal‐dose scan induced nonlocal means (ndiNLM) algorithm and described it as:26
| (7) |
where (the superscript ND denotes “normal‐dose”) represents the previous normal‐dose CT image registered to the current LDCT image, and denotes the intensity of pixel j after ndiNLM filtering. Specifically, the weighting coefficient is given as:
| (8) |
While ndiNLM filtering has demonstrated substantial improvements over the traditional NLM algorithm for LDCT denoising,26 it can also be formulated as a regularization term in Eq. (3) for statistical image reconstruction, which can further improve image quality or reduce data fidelity requirements. The ndiNLM regularization is given as:28, 44
| (9) |
where
| (10) |
Using the regularization in Eq. (9), the objective function in Eq. (3) is referred to as the SIR‐ndiNLM reconstruction method.
2.C. Implementation of the SIR‐ndiNLM method
With the regularization in Eq. (9), the objective function in Eq. (3) is in quadratic form. However, the weighting coefficients in the regularization are computed on unknown image , so it is difficult to solve Eq. (3) directly. In this study, an empirical one‐step‐late (OSL) implementation was employed for the optimization task, based on the Gauss–Seidel updating strategy.40 That is, the weighting coefficients are always computed on a current image estimate and then assumed to be constants when updating the image. This OSL strategy was demonstrated to be feasible and effective in previous studies.18, 20, 31 Although there is no proof of global convergence for such an OSL iteration scheme, we observed that the image estimation converged to a steady status after a few iterations for all the datasets presented in this study. In our implementations, we set the iteration number at 20 for all cases. The pseudo‐code for implementing of the SIR‐ndiNLM method is as follows:
Initialization:
For each iteration:
begin
For each pixel j:
begin
end
end
where denotes the jth column of the projection matrix.
2.D. Patient data acquisitions
Two patients with lung nodules were scheduled for CT scan for medical reasons at Stony Brook University Hospital, and were recruited to this study under informed consent after Institutional Review Board (IRB) approval. The patients were scanned using a Siemens Somatom Sensation 16 CT scanner (Siemens Healthcare, Germany). The source‐to‐detector distance was 1040 mm, the source‐to‐axis distance was 570 mm, and 1160 projection views were evenly spanned on a 360° circular orbit. The x‐ray tube voltage was 120 kVp and the mAs level was 100 mAs, which is considered as normal‐dose scan in the clinic. The filtered back‐projection (FBP) method was used to reconstruct the CT volume from the normal‐dose projection data. Patient #1 had one lung nodule (~10 mm in diameter). Three discontinuous transverse slices of its CT volume are shown in Fig. 1; the red arrow indicates the nodule's appearance on different transverse slices. Patient #2 had two lung nodules (~3 mm and ~16 mm in diameter). Two transverse slices of the volume are illustrated in Fig. 2; the red arrow indicates the location of the two nodules. The display window for all images in this work is [0, 0.034] mm−1 unless otherwise stated.
Figure 1.

Three transverse slices of patient #1, reconstructed by FBP method from the normal‐dose projection data.
Figure 2.
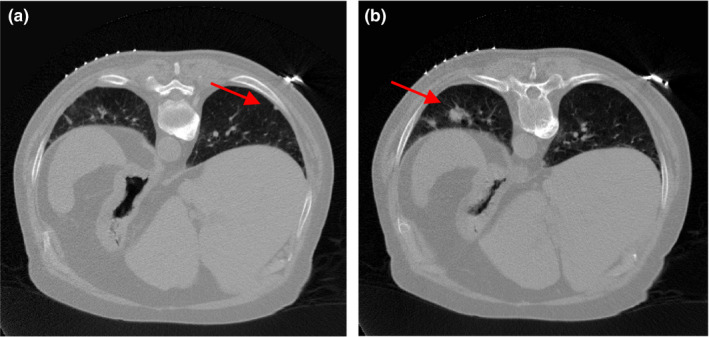
Two transverse slices of patient #2, reconstructed by FBP method from the normal‐dose projection data.
We simulated the corresponding low‐dose projection data by adding noise to the normal‐dose projection data using the simulation method described in Ref. 40, 45. The noisy measurement at detector bin i was generated according to the statistical model:
| (11) |
where was set to 3 × 10⁴ and was set to 10 for low‐dose scan simulation. The corresponding noisy line integral y i was calculated by logarithmic transform. The simulated low‐dose projection data were considered as a follow‐up LDCT scan in this study. We emulated the lung nodule surveillance scenarios by using different slices of the CT volume to “create” different anatomical changes between the prior image and the current LDCT image. The patient #1 datasets were used to assess the performance of the SIR‐ndiNLM method, and the patient #2 datasets were used to investigate whether nodule sizes affected our conclusions.
3. Experiments and results
Using patient #1 datasets, we investigated two different lung nodule surveillance scenarios. In the first scenario, a nodule was not found in the baseline exam but appeared in a follow‐up test.10 This scenario is quite common in the clinic, especially for people, such as smokers, who are at high risk for developing lung cancer. In the second scenario, a nodule was present in the baseline exam but disappeared in a subsequent test.9 This also occurs frequently in the clinic, because nodules can be caused by conditions other than cancer, such as infections; the body may naturally resolve these benign nodules.11 In this study, we presumed that the previous baseline CT exam was scanned with normal‐dose radiation for diagnostic purposes, while the follow‐up scan was acquired with low‐dose radiation to minimize patient exposure. We assessed the performance of SIR‐ndiNLM in these two scenarios and studied whether the method would induce false information when there are substantial anatomical changes (to the nodule, airways, or other structures) between the baseline exam and the follow‐up LDCT scan. Using the patient #2 datasets, we further investigated the effect of nodule sizes on our conclusions.
3.A. Scenario 1: current LDCT image has a lung nodule but the prior image does not
Figure 3(a) illustrates one transverse image of patient #1 from the simulated low‐dose projection data, which was reconstructed by the FBP method. We considered Fig. 3(a) as a current LDCT image (with lung nodule) and Fig. 1(a) as the normal‐dose prior image (without nodule). The arrows in Fig. 3(a) and the difference image in Fig. 3(b) indicate that there are substantial anatomical changes between these two images, besides noise and streak artifacts. Without any registration, we directly utilized the prior image in Fig. 1(a) to improve the reconstruction of Fig. 3(a) using the SIR‐ndiNLM method. We tried to determine whether the SIR‐ndiNLM would induce false information in the current LDCT reconstruction when using the prior image without lung nodules.
Figure 3.
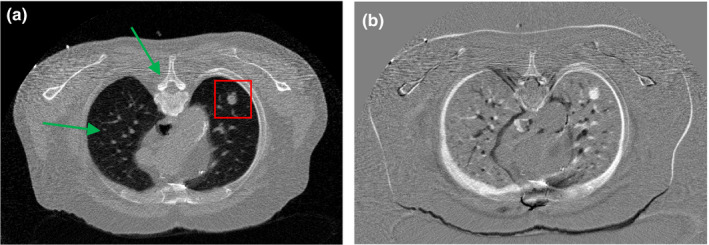
(a) One transverse slice of patient #1, reconstructed by the FBP method from simulated low‐dose projection data; (b) Difference image between Figs. 1(a) and 3(a), indicating mismatches between the prior image and current LDCT image. The display window is [0, 0.034] mm−1 for Fig. 3(a), and is [−0.02, 0.02] mm−1 for Fig. 3(b).
3.A.1. Investigation of parameter selection
It is important to determine the optimal values for several parameters related to the SIR‐ndiNLM method, including SW size, PW size, standard deviation a of the Gaussian kernel, filtering parameter h, and hyper‐parameter β. In this work, the parameters were chosen in the following manner. The PW size and the standard deviation a do not have noticeable effects on the reconstructed image, so they were set at PW = 5 × 5 and a = 5 for all cases in this study. Since the prior image and the current LDCT image were not accurately registered in this study, we employed a relatively large SW (SW = 33 × 33) to ensure that enough similar patches could be found in the prior image. We justify this SW selection at the end of this section. Finally, the filtering parameter h and hyper‐parameter β together control the smoothness of the solution. Too small an h or β cannot effectively suppress the noise and artifacts in the LDCT image, while too large an h or β can blur the edges and subtle structures. We studied trends in optimal smoothness by performing the reconstructions over an exhaustive two‐dimensional (2D) sweep35 of h and β. The parameter h was swept linearly in the exponent from 10−2.5 to 10−1.5 with a 100.5 step size, and the parameter β was swept linearly in the exponent from 101 to 109 with a 100.5 step size. We chose a small region of interest (ROI) containing the lung nodule [as indicated in Fig. 3(a)], and we considered the h and β combination that gave the lowest root‐mean‐squared‐error (RMSE) for the ROI reconstruction to be the optimal selection. The metric RMSE is defined as:
| (12) |
where denotes the vector of the reconstructed ROI, denotes the vector of the ROI in the normal‐dose image of Fig. 1(c), and Q is the number of image pixels within ROI. The sweep results from different h and β values show that when h and β are too large, the resulting reconstruction could smooth out the lung nodule, as illustrated in Fig. 4. However, this does not necessarily mean that the SIR‐ndiNLM reconstruction resembles the prior image in Fig. 1(a), which also has no nodule, because any SIR method would have the same consequence when the smoothing strength is too large.
Figure 4.
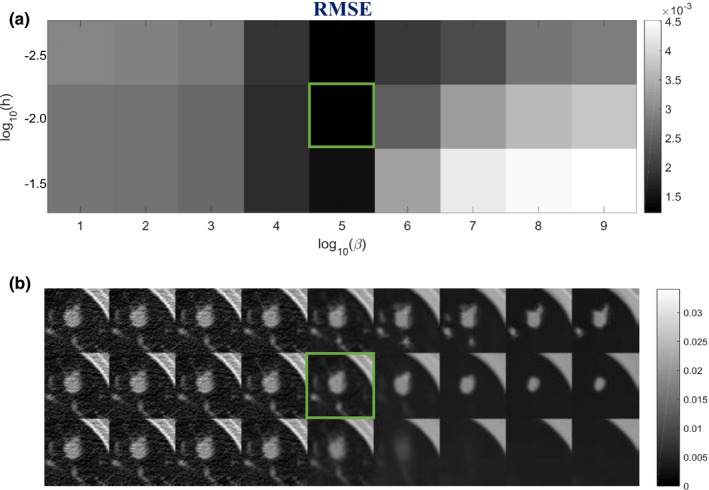
Investigation of smoothing parameters: (a) RMSE of the ROI in Fig. 3(a) using different h and β values; (b) The corresponding reconstructions of ROI using different h and β values. The box indicates the lowest RMSE and the associated SIR‐ndiNLM reconstruction.
Using the optimal h and β combination (h = 10−2, β = 105) found in Fig. 4, we revisited the selection of SW size to validate that a relatively large SW is needed for the SIR‐ndiNLM method, especially when the prior image and the current LDCT image are not adequately registered. From Fig. 3(b), we can observe obvious motion between the two images. In this study, we decreased the SW size from 33 × 33 to 9 × 9 and found that the quality of the ROI reconstruction also decreased in both a visual inspection and quantitative metric, as shown in Fig. 5. Although the lung nodule was always present in the SIR‐ndiNLM reconstruction regardless of the SW selection, a relatively large SW size is still recommended to obtain higher image quality, despite the increased computational load.
Figure 5.
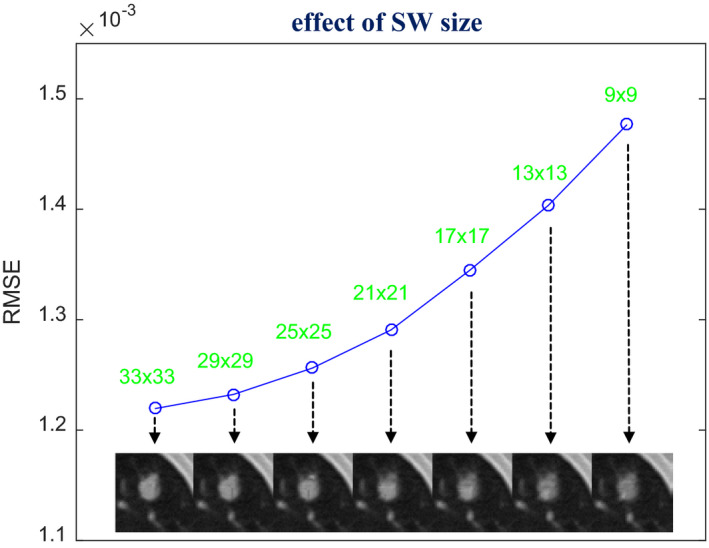
Investigation of SW size selection. The images were reconstructed by the SIR‐ndiNLM method from low‐dose projection data, using different SW sizes but the same values for other parameters (PW = 5 × 5, a = 5, h = 10−2, β = 105). The figure shows the RMSE of the ROI reconstruction using different SW sizes.
3.A.2. Effect of prior image selection
While the SIR‐ndiNLM method proved effective, we further investigated the effect of prior image selection on the method. Specifically, we chose different images in Fig. 1 as the prior image for the SIR‐ndiNLM method and compared the quality of different reconstructions resulting from the same low‐dose projection data. Figure 6 shows the reconstructed images by the SIR‐ndiNLM method using the three different normal‐dose prior images from Fig. 1. The same parameters (SW = 33 × 33, PW = 5 × 5, a = 5, h = 10−2, β = 105) were used for all three reconstructions. Although no nodule is shown in Fig. 1(a), a shrinking nodule can be observed in Fig. 1(b), and the same nodule is visible in Fig. 1(c), the SIR‐ndiNLM reconstructions in Fig. 6 always retain the lung nodule, regardless of the prior image. From visual inspection, the three SIR‐ndiNLM reconstructions are quite similar to each other. Quantitative comparison of the ROI reconstructions using RMSE and universal quality index (UQI)46 metrics still revealed a minute gain for the SIR‐ndiNLM method when the anatomy of prior image was more similar to the current LDCT image, as seen in Fig. 7. Accordingly, since the prior image in Fig. 1(c) has exactly the same anatomy as the current LDCT image, the resulting SIR‐ndiNLM reconstruction shows some improvement over the other two reconstructions. Nevertheless, this can be fully expected because a more similar prior image can provide more accurate correspondence during SIR‐ndiNLM reconstruction.
Figure 6.

The three images were reconstructed by the SIR‐ndiNLM from low‐dose projection data using different prior images: (a) using prior image P1 in Fig. 1(a); (b) using prior image P2 in Fig. 1(b); (c) using prior image P3 in Fig. 1(c).
Figure 7.

Quantitative evaluation of ROI reconstructions in Fig. 6, using RMSE and UQI metrics.
3.A.3. Effect of reduced data fidelity
The above investigation demonstrated that, with proper parameter selection, the SIR‐ndiNLM method did not miss a true nodule even with substantial anatomical changes between the prior image and the current LDCT image. We studied whether this holds true with further reduced data fidelity. Thus, we decreased the incident photon counts to 3000 in Eq. (11) to obtain the simulated ultra‐low‐dose projection data. In this case, can be nonpositive due to electronic noise. We clipped nonpositive measurements by a threshold δ = 0.01 to enforce the logarithmic transform, which is the same as that in Wang et al.40 More advanced correction methods47 for nonpositive values may be favorable, but is out of the scope of this work. The corresponding images reconstructed by FBP and SIR‐ndiNLM [using Fig. 1(a) as the prior image] are shown in Fig. 8. As expected, the quality of the SIR‐ndiNLM reconstruction decreased slightly. But the lung nodule still appeared in the reconstruction, indicating that the SIR‐ndiNLM method was not affected by the prior image, which has no nodule, even with highly reduced data fidelity. This important finding addresses the concern that the prior image might have a stronger effect on the SIR‐ndiNLM reconstruction when the data fidelity is weak. We demonstrated that the SIR‐ndiNLM method performed well even under ultra‐low‐dose conditions, and did not miss a true nodule even when the prior image had no nodule. Nevertheless, when the incident photon counts are low, the SIR‐ndiNLM reconstruction may blur or remove some subtle structures (e.g., airways), as illustrated in Fig. 8(b). But all SIR methods may have this problem for ultra‐low‐dose data.
Figure 8.
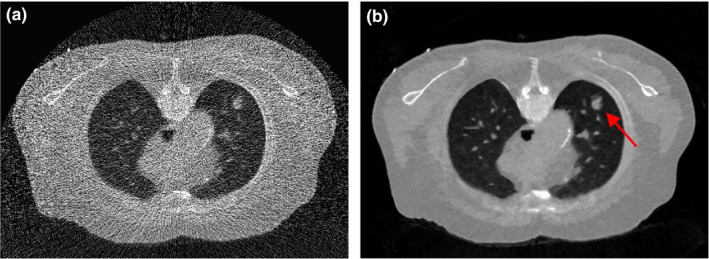
The images are reconstructed from the simulated ultra‐low‐dose projection data by: (a) FBP; (b) SIR‐ndiNLM using Fig. 1(a) as the prior image. The SIR‐ndiNLM can still retain the lung nodule even when the prior image has no nodule.
3.A.4. Convergence analysis for SIR‐ndiNLM
Using the normal‐dose image in Fig. 1(c) as the ground truth, we calculated the overall RMSE after each iteration of the proposed SIR‐ndiNLM method, from both simulated low‐dose and ultra‐low‐dose projection data. We found that the SIR‐ndiNLM method converged to a steady solution after a few iterations in both cases, as shown in Fig. 9.
Figure 9.
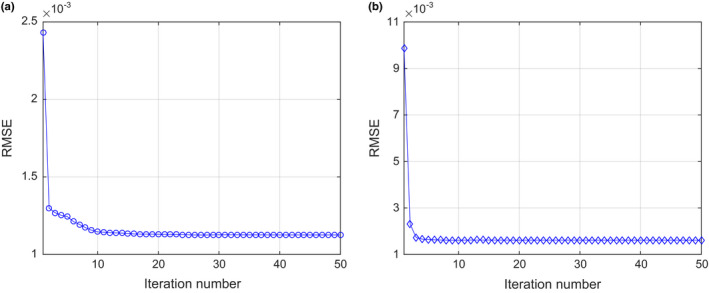
The overall RMSE versus iteration number for the SIR‐ndiNLM method: (a) from simulated low‐dose projection data; (b) from simulated ultra‐low‐dose projection data.
3.A.5. Comparison with other methods
To validate the performance of the SIR‐ndiNLM method, the FBP reconstruction followed by NLM filtering in Eq. (4), the FBP reconstruction followed by ndiNLM filtering in Eq. (7), and the total variation regularized statistical image reconstruction (referred to as SIR‐TV)48 were also implemented for comparison. To ensure a fair comparison, the parameters for each method were carefully tuned to obtain the best image quality. The resulting images from simulated low‐dose and ultra‐low‐dose projection data are shown in Figs. 10 and 11 respectively. These images show that NLM filtering is not quite effective in removing streak artifacts, ndiNLM filtering may sacrifice subtle structures, and SIR‐TV exhibits patchy artifacts, especially under ultra‐low‐dose conditions, which was also reported in Ref. 48, 49. Comparing Figs. 6(a) and 8(b) with these results, we can observe that the SIR‐ndiNLM outperforms these three methods, and the advantage is more obvious when the dose is lower.
Figure 10.

The resulting images from simulated low‐dose projection data by: (a) FBP + NLM filtering; (b) FBP + ndiNLM filtering using Fig. 1(a) as the prior image; (c) SIR‐TV method.
Figure 11.

The resulting images from simulated ultra‐low‐dose projection data by: (a) FBP + NLM filtering; (b) FBP + ndiNLM filtering using Fig. 1(a) as the prior image; (c) SIR‐TV method.
3.B. Scenario 2: current LDCT image has no nodule but the prior image does
Another transverse slice of patient #1 from the simulated low‐dose projection data, reconstructed by the FBP method, is illustrated in Fig. 12(a). This LDCT image has no lung nodule. We used Fig. 1(c) as the prior image (with lung nodule) for the SIR‐ndiNLM reconstruction of the current LDCT image and investigated whether the SIR‐ndiNLM method would introduce a false nodule into the LDCT image. The difference image between the prior image Fig. 1(c) and the current LDCT image Fig. 12(a), is illustrated in Fig. 12(b). We conducted no registration between the two images for the SIR‐ndiNLM reconstruction.
Figure 12.
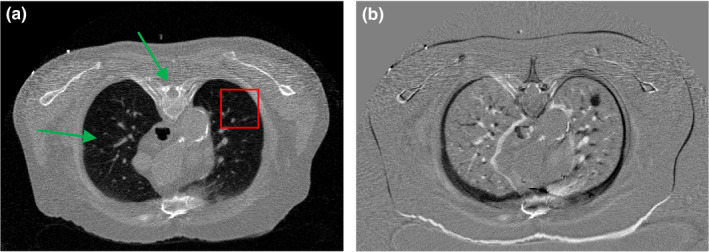
(a) Another transverse slice of patient #1 without lung nodule, reconstructed by the FBP method from simulated low‐dose projection data; (b) The difference image between Figs. 1(c) and 12(a), indicating the mismatch between the prior image and the current LDCT image. The display window is [0, 0.034] mm−1 for Fig. 12(a), and is [−0.02, 0.02] mm−1 for Fig. 12(b).
3.B.1. Investigation of parameter selection
The parameter selection approach is the same here as in Section 3.A. We set SW = 33 × 33, PW = 5 × 5, a = 5, and performed another exhaustive 2D sweep for h and β. A small ROI was chosen in Fig. 12(a), as indicated by the box. The h and β combination that gave the lowest RMSE for the ROI reconstruction was selected as the optimal parameter, as shown in Fig. 13. The sweep results show that no false lung nodule was introduced by the SIR‐ndiNLM method, no matter which parameters were selected. But when h and β are too large, the resulting reconstruction can smooth out subtle structures in the lung. Therefore, a moderate smoothness strength should be chosen.
Figure 13.
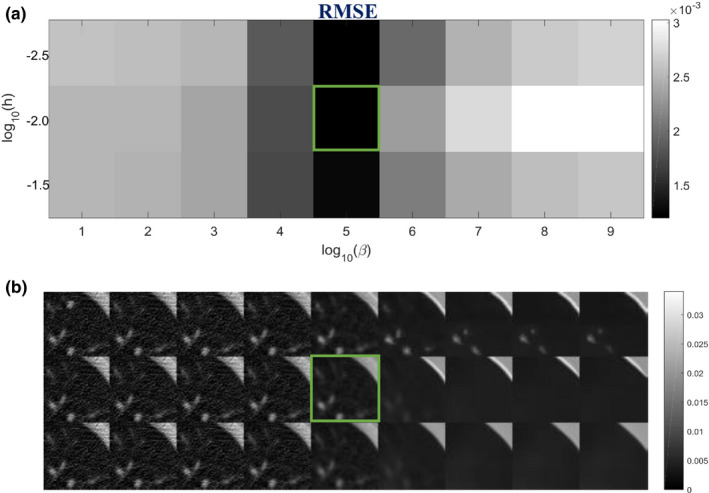
Investigation of smoothing parameters: (a) RMSE of the ROI in Fig. 12(a) using different h and β values; (b) The corresponding reconstructions of ROI using different h and β values. The box indicates the lowest RMSE and the associated SIR‐ndiNLM reconstruction.
Using the optimal h and β combination (h = 10−2, β = 105) found in Fig. 13, we also revisited the selection of SW size to study its effect on the SIR‐ndiNLM method. In this case, the prior image and the current LDCT image were also not adequately registered, as indicated by Fig. 12(b). We decreased the SW size from 33 × 33 to 9 × 9 and found that the quality of the ROI reconstruction also decreased, as indicated by both visual inspection and the RMSE metric in Fig. 14. This again demonstrates the necessity of using a large SW for the SIR‐ndiNLM method, especially when the prior image and the current LDCT image are not perfectly aligned.
Figure 14.
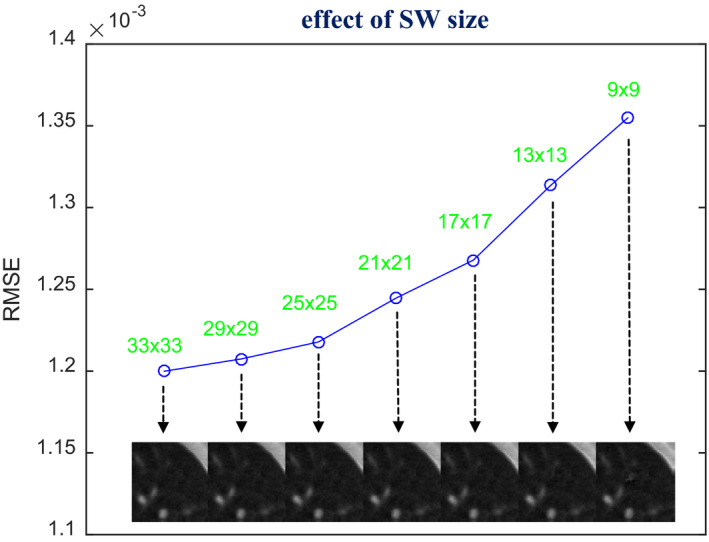
Investigation of SW size selection. The images were reconstructed by the SIR‐ndiNLM method from low‐dose projection data, using different SW sizes but the same values for other parameters (PW = 5 × 5, a = 5, h = 10−2, β = 105). The figure shows the RMSE of the ROI reconstruction using different SW sizes.
3.B.2. Effect of prior image selection
We also explored using different normal‐dose images from Fig. 1 as the prior image for the SIR‐ndiNLM method, and we compared the quality of the resulting reconstructions from the same low‐dose projection data. We used the same parameters (SW = 33 × 33, PW = 5 × 5, a = 5, h = 10−2, β = 105) for all three SIR‐ndiNLM reconstructions, which are shown in Fig. 15. All three SIR‐ndiNLM reconstructions avoid introducing a false lung nodule, even when the corresponding prior image has a lung nodule, and all three reconstructions appear similar to each other from a visual inspection. A quantitative comparison of the ROI reconstructions using RMSE and UQI metrics is shown in Fig. 16. The SIR‐ndiNLM reconstruction using Fig. 1(a) as the prior image has minute gains over the other two reconstructions, because the anatomy of Fig. 12(a) is exactly the same as the prior image in Fig. 1(a). This also suggests that, although no prior image induces a false nodule when using the SIR‐ndiNLM method, anatomical similarities between the prior image and the current LDCT image may still improve the image quality, which is consistent with the results in Section 3.A.
Figure 15.

The three images are reconstructed by the SIR‐ndiNLM method from low‐dose projection data using different prior images: (a) using prior image P3 in Fig. 1(c); (b) using prior image P2 in Fig. 1(b); (c) using prior image P1 in Fig. 1(a).
Figure 16.
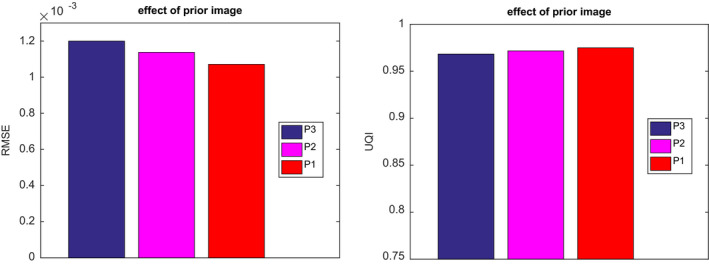
Quantitative evaluation of ROI reconstructions in Fig. 15, using the RMSE and UQI metrics.
3.B.3. Effect of reduced data fidelity
The above investigation demonstrated that, with proper parameter selection, the SIR‐ndiNLM method did not induce a false nodule even when there were substantial anatomical changes between the prior image and the current LDCT image. We studied whether this holds true with further reduced data fidelity. Using the simulated ultra‐low‐dose projection data with = 3000 in Eq. (11), we performed reconstructions by FBP and SIR‐ndiNLM [using Fig. 1(c) as the prior image]. The reconstruction results are shown in Fig. 17. These images show that the lung nodule is not present in the SIR‐ndiNLM reconstruction even though the prior image has a nodule, indicating that SIR‐ndiNLM does not introduce a false nodule from the prior image even with highly reduced data fidelity. This conclusion is also consistent with our findings in Section 3.A.
Figure 17.
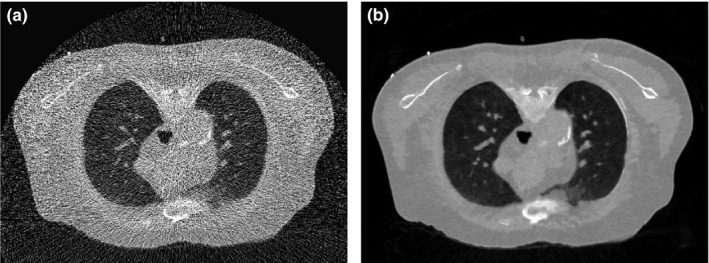
The images were reconstructed from the simulated ultra‐low‐dose projection data by: (a) FBP; (b) SIR‐ndiNLM using Fig. 1(c) as the prior image. The SIR‐ndiNLM does not introduce a false lung nodule even when the prior image has a nodule.
3.C. Investigation of nodule size effect
The above investigations show that the SIR‐ndiNLM method performed well on patient #1 datasets, as it did not miss a true lung nodule nor induce a false lung nodule when the prior image and the current LDCT image showed anatomical changes. However, those studies were only applied on a ~10 mm nodule. It is unknown whether different nodule sizes would affect the performance of SIR‐ndiNLM. To answer this question, we further applied the SIR‐ndiNLM method on patient #2 datasets with two nodules of different sizes (~3 mm and ~16 mm in diameter). We simulated two noise levels of projection data, using = 3 × 10⁴ for low‐dose and = 3000 in Eq. (11) for ultra‐low‐dose. The FBP and SIR‐ndiNLM reconstruction results for simulated low‐dose and ultra‐low‐dose projection data are shown in Figs. 18 and 19, respectively. For all SIR‐ndiNLM reconstructions, we used the other slice in Fig. 2 as the prior image for SIR‐ndiNLM reconstruction of the current LDCT slice. We observed that none of the SIR‐ndiNLM reconstructed images induce a false nodule, which is consistent with our results from the patient #1 studies. The ~3 mm nodule in Fig. 19(b) is blurred, but this may be the result of ultra‐low‐dose irradiation rather than the effect of the prior image on SIR‐ndiNLM reconstruction, because it is always challenging to preserve the subtle structures when noise level is extremely high, as also shown in Fig. 19(a). Generally, this investigation shows that nodule sizes may not affect the performance of SIR‐ndiNLM.
Figure 18.
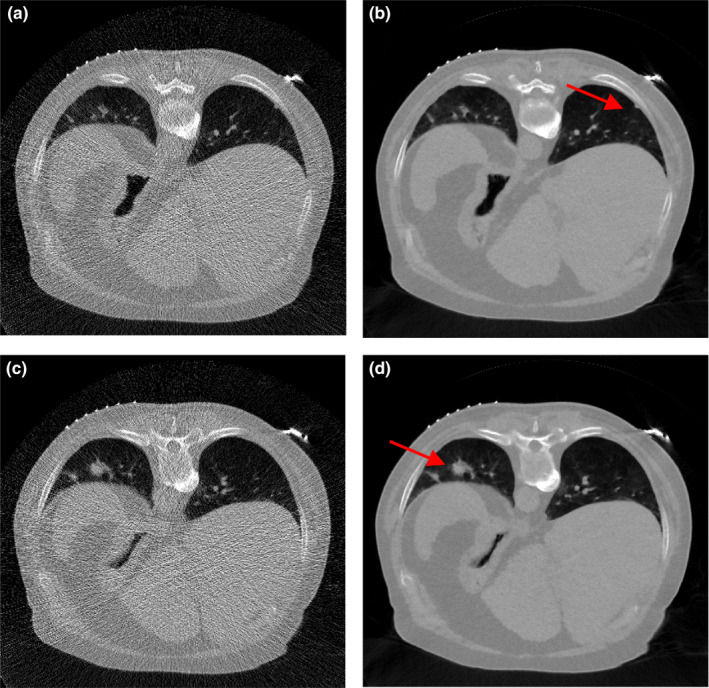
The images were reconstructed from the simulated low‐dose projection data by: (a) FBP; (b) SIR‐ndiNLM using Fig. 2(b) as the prior image; (c) FBP; (d) SIR‐ndiNLM using Fig. 2(a) as the prior image.
Figure 19.
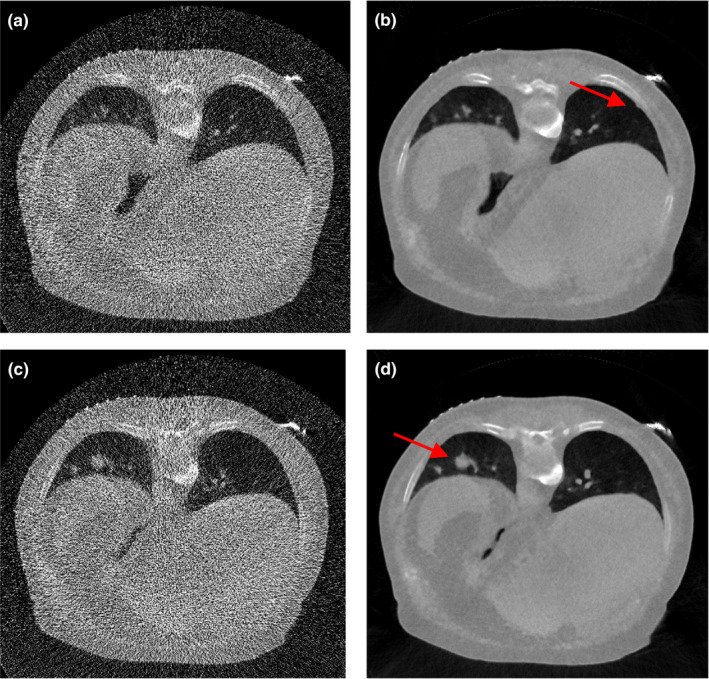
The images were reconstructed from the simulated ultra‐low‐dose projection data by: (a) FBP; (b) SIR‐ndiNLM using Fig. 2(b) as the prior image; (c) FBP; (d) SIR‐ndiNLM using Fig. 2(a) as the prior image.
4. Discussions and conclusions
In this work, we emulated two lung nodule surveillance scenarios to evaluate the performance of the SIR‐ndiNLM method in situations where there are anatomical changes between the high‐quality prior image and the current LDCT image. The experimental results demonstrate that the SIR‐ndiNLM method is resistant to anatomical changes and does not induce false nodules when the prior image and the current LDCT image have different structures. Specifically, when the prior image has no lung nodule but the current LDCT image has a nodule, the SIR‐ndiNLM method does not miss the true nodule in the reconstructed image, and vice versa. The SIR‐ndiNLM method also avoids inducing false structures in reconstructing images when other anatomical changes, such as changes in the bone and airways (indicated in Figs. 3 and 12), have occurred between the prior image and the current LDCT image. This important finding relieves the concern that prior image based SIR‐ndiNLM method might induce false information in the reconstructed image. Also, we found that when the prior image is more similar to the current LDCT image in anatomy, the resulting SIR‐ndiNLM reconstruction shows improved image quality, although the visual difference may be tiny. This is because the SIR‐ndiNLM method can find more similar patches from the prior image when reconstructing the current LDCT image. Finally, we found that lower data fidelity and different nodule sizes may not affect how well the SIR‐ndiNLM method performs. However, we caution that our investigations were only conducted on two specific patient studies, and there is insufficient evidence that these findings will hold true for all kinds of anatomical changes. Extensive patient studies may be needed to further validate these findings.
The reason for good performance of SIR‐ndiNLM could be two folds: (a) the data fidelity constraints in the SIR framework; (b) the ndiNLM regularization only searches similar patches from the prior image, so if the prior image is substantially different from the current LDCT image, few patches will be found and the difference will be penalized in the objective function. Investigating information propagation50 in the SIR‐ndiNLM method would be an interesting topic for future research, which can decompose the reconstruction into features from measurement data and features from the prior image. And by this way, we may have a better understanding of the SIR‐ndiNLM method.
Compared to generic NLM regularization18, 20 which only utilizes the current LDCT image and does not consider the prior image, the SIR‐ndiNLM method requires a larger SW to account for mismatches between the prior image and the current LDCT image and to ensure that enough similar patches can be found in the prior image. Figures 5 and 13 demonstrate the necessity of using a relatively large SW for the SIR‐ndiNLM reconstruction. Also, a large SW allows only rough alignment between the prior image and the current LDCT image. Compared with other prior image based SIR methods which require accurate registration,30, 32, 33 the SIR‐ndiNLM method may be more practically feasible, because accurate registration can be difficult to achieve considering the noise and artifacts in the current LDCT image. This advantage may be attributed to the patch‐based search mechanism of the ndiNLM regularization, while other prior image based methods typically employ a pixel‐to‐pixel correspondence mechanism. But this may also mean a higher computational load, which can be a drawback for the SIR‐ndiNLM method. Nevertheless, the presented work does not include any results demonstrating superiority of SIR‐ndiNLM over other prior image based methods,24, 29, 30, 32, 33, 34 while performance comparison between them can be an interesting research topic in the future. Meanwhile, additional studies are needed to clarify if these methods offer similar robustness as the SIR‐ndiNLM, in situations with change in anatomy.
Finally, this study was limited to 2D space. While extension to three‐dimensional (3D) space is straightforward, the implemental complexity and computational burden may increase substantially when using 3D SW and PW. We expect that our conclusions about the SIR‐ndiNLM method will be consistent across both spaces, but further experimental investigation is needed. Also, only simulated low‐dose projection data were used in this study. The major consideration of using simulated low‐dose projection data is that we can have a ground truth for quantitative evaluations, which is a common challenge for patient studies. In practice, when the ground truth is unknown, we cannot use the RMSE metric to find the optimal combination of h and β. Based on the investigations in this work, the optimal values of h and β actually vary within a small range. We can still define a reasonable range for them, and perform the 2D sweep to find the combination that gives proper smoothing for the reconstructed image via visual inspection. The conclusions of this proof‐of‐principle study shall not be changed when using real clinical low‐dose projection data, but further experimental investigation may also be needed.
Conflict of interest
The authors have no relevant conflict of interest to disclose.
Acknowledgments
This work was supported in part by the National Institutes of Health under grants #CA143111 and #CA206171. JM was partially supported by the National Natural Science Foundation of China under grant Nos. 81371544 and 61571214, and the National Science and Technology Major Project of the Ministry of Science and Technology of China under grant No. 2014BAI17B02. JW was supported in part by National Institutes of Health (No. R01 EB020366) and American Cancer Society (No. RSG‐13‐326‐01‐CCE). The authors would like to thank Drs. Jonathan Feinberg and Damiana Chiavolini for editing the paper. The authors also acknowledge editors and anonymous reviewers for their constructive suggestions.
References
- 1. Hasegawa M, Sone S, Takashima S, et al. Growth rate of small lung cancers detected on mass CT screening. Br J Radiol. 2000;73:1252–1259. [DOI] [PubMed] [Google Scholar]
- 2. Caillot D, Couaillier JF, Bernard A, et al. Increasing volume and changing characteristics of invasive pulmonary aspergillosis on sequential thoracic computed tomography scans in patients with neutropenia. J Clin Oncol. 2001;19:253–259. [DOI] [PubMed] [Google Scholar]
- 3. Hoeffner EG, Case I, Jain R, et al. Cerebral perfusion CT: technique and clinical applications. Radiology. 2004;231:632–644. [DOI] [PubMed] [Google Scholar]
- 4. Kambadakone AR, Sahani DV. Body perfusion CT: technique, clinical applications, and advances. Radiol Clin North Am. 2009;47:161–178. [DOI] [PubMed] [Google Scholar]
- 5. Jaffray DA, Siewerdsen JH, Wong JW, Martinez AA. Flat‐panel cone‐beam computed tomography for image‐guided radiation therapy. Int J Radiat Oncol. 2002;53:1337–1349. [DOI] [PubMed] [Google Scholar]
- 6. Xing L, Thorndyke B, Schreibmann E, et al. Overview of image‐guided radiation therapy. Med Dosim. 2006;31:91–112. [DOI] [PubMed] [Google Scholar]
- 7. Siewerdsen JH, Daly MJ, Chan H, et al. High‐performance intraoperative cone‐beam CT on a mobile C‐arm: an integrated system for guidance of head and neck surgery. In: Miga MI, Wong KH, eds. Proc. SPIE. Bellingham, WA: International Society for Optics and Photonics; 2009:72610J. [Google Scholar]
- 8. Cleary K, Peters TM. Image‐guided interventions: technology review and clinical applications. Annu Rev Biomed Eng. 2010;12:119–142. [DOI] [PubMed] [Google Scholar]
- 9. Brown MS, McNitt‐Gray MF, Goldin JG, Suh RD, Sayre JW, Aberle DR. Patient‐specific models for lung nodule detection and surveillance in CT images. IEEE Trans Med Imaging. 2001;20:1242–1250. [DOI] [PubMed] [Google Scholar]
- 10. van Klaveren RJ, Oudkerk M, Prokop M, et al. Management of lung nodules detected by volume CT scanning. N Engl J Med. 2009;361:2221–2229. [DOI] [PubMed] [Google Scholar]
- 11. Dang H, Siewerdsen JH, Stayman JW. Prospective regularization design in prior‐image‐based reconstruction. Phys Med Biol. 2015;60:9515–9536. [DOI] [PMC free article] [PubMed] [Google Scholar]
- 12. Werner‐Wasik M, Xiao Y, Pequignot E, Curran WJ, Hauck W. Assessment of lung cancer response after nonoperative therapy: tumor diameter, bidimensional product, and volume. A serial ct scan‐based study. Int J Radiat Oncol. 2001;51:56–61. [DOI] [PubMed] [Google Scholar]
- 13. Brenner DJ, Hall EJ. Computed tomography – an increasing source of radiation exposure. N Engl J Med. 2007;357:2277–2284. [DOI] [PubMed] [Google Scholar]
- 14. Fessler J. Statistical image reconstruction methods for transmission tomography. In: Sonka M, Fitzpatrick JM, eds. Handbook of Medical Imaging. Vol. 2. Medical Image Processing and Analysis. 1000 20th Street, Bellingham, WA 98227‐0010 USA: SPIE; 2000:1–70. [Google Scholar]
- 15. Thibault J‐B, Sauer KD, Bouman CA, Hsieh J. A three‐dimensional statistical approach to improved image quality for multislice helical CT. Med Phys. 2007;34:4526. [DOI] [PubMed] [Google Scholar]
- 16. Jia X, Lou Y, Li R, Song WY, Jiang SB. GPU‐based fast cone beam CT reconstruction from undersampled and noisy projection data via total variation. Med Phys. 2010;37:1757–1760. [DOI] [PubMed] [Google Scholar]
- 17. Xu Q, Yu H, Mou X, Zhang L, Hsieh J, Wang G. Low‐dose X‐ray CT reconstruction via dictionary learning. IEEE Trans Med Imaging. 2012;31:1682–1697. [DOI] [PMC free article] [PubMed] [Google Scholar]
- 18. Zhang H, Ma J, Wang J, Liu Y, Lu H, Liang Z. Statistical image reconstruction for low‐dose CT using nonlocal means‐based regularization. Comput Med Imaging Graph. 2014;38:423–435. [DOI] [PMC free article] [PubMed] [Google Scholar]
- 19. Xu S, Lu J, Zhou O, Chen Y. Statistical iterative reconstruction to improve image quality for digital breast tomosynthesis. Med Phys. 2015;42:5377–5390. [DOI] [PMC free article] [PubMed] [Google Scholar]
- 20. Zhang H, Ma J, Wang J, et al. Statistical image reconstruction for low‐dose CT using nonlocal means‐based regularization. Part II: an adaptive approach. Comput Med Imaging Graph. 2015;43:26–35. [DOI] [PMC free article] [PubMed] [Google Scholar]
- 21. Zhang R, Ye DH, Pal D, Thibault J‐B, Sauer KD, Bouman CA. A Gaussian mixture MRF for model‐based iterative reconstruction with applications to low‐dose x‐ray CT. IEEE Trans Comput Imaging. 2016;2:359–374. [Google Scholar]
- 22. Choi K, Wang J, Zhu L, Suh T‐S, Boyd S, Xing L. Compressed sensing based cone‐beam computed tomography reconstruction with a first‐order method. Med Phys. 2010;37:5113–5125. [DOI] [PMC free article] [PubMed] [Google Scholar]
- 23. Niu T, Zhu L. Accelerated barrier optimization compressed sensing (ABOCS) reconstruction for cone‐beam CT: phantom studies. Med Phys. 2012;39:4588. [DOI] [PMC free article] [PubMed] [Google Scholar]
- 24. Nett B, Tang J, Aagaard‐Kienitz B, Rowley H, Chen G‐H. Low radiation dose C‐arm cone‐beam CT based on prior image constrained compressed sensing (PICCS): including compensation for image volume mismatch between multiple data acquisitions. In: Samei E, Hsieh J, eds. Proc. SPIE; 2009:725803. [Google Scholar]
- 25. Yu H, Zhao S, Hoffman EA, Wang G. Ultra‐low dose lung CT perfusion regularized by a previous scan. Acad Radiol. 2009;16:363–373. [DOI] [PMC free article] [PubMed] [Google Scholar]
- 26. Ma J, Huang J, Feng Q, et al. Low‐dose computed tomography image restoration using previous normal‐dose scan. Med Phys. 2011;38:5713–5731. [DOI] [PMC free article] [PubMed] [Google Scholar]
- 27. Xu W, Mueller K. Efficient low‐dose CT artifact mitigation using an artifact‐matched prior scan. Med Phys. 2012;39:4748–4760. [DOI] [PubMed] [Google Scholar]
- 28. Ma J, Zhang H, Gao Y, et al. Iterative image reconstruction for cerebral perfusion CT using a pre‐contrast scan induced edge‐preserving prior. Phys Med Biol. 2012;57:7519–7542. [DOI] [PMC free article] [PubMed] [Google Scholar]
- 29. Lee H, Xing L, Davidi R, Li R, Qian J, Lee R. Improved compressed sensing‐based cone‐beam CT reconstruction using adaptive prior image constraints. Phys Med Biol. 2012;57:2287–2307. [DOI] [PubMed] [Google Scholar]
- 30. Stayman JW, Dang H, Ding Y, Siewerdsen JH. PIRPLE: a penalized‐likelihood framework for incorporation of prior images in CT reconstruction. Phys Med Biol. 2013;58:7563. [DOI] [PMC free article] [PubMed] [Google Scholar]
- 31. Zhang H, Huang J, Ma J, et al. Iterative reconstruction for x‐ray computed tomography using prior‐image induced nonlocal regularization. IEEE Trans Biomed Eng. 2014;61:2367–2378. [DOI] [PMC free article] [PubMed] [Google Scholar]
- 32. Dang H, Wang AS, Sussman MS, Siewerdsen JH, Stayman JW. dPIRPLE: a joint estimation framework for deformable registration and penalized‐likelihood CT image reconstruction using prior images. Phys Med Biol. 2014;59:4799–4826. [DOI] [PMC free article] [PubMed] [Google Scholar]
- 33. Zhang H, Han H, Wang J, et al. Deriving adaptive MRF coefficients from previous normal‐dose CT scan for low‐dose image reconstruction via penalized weighted least‐squares minimization. Med Phys. 2014;41:41916. [DOI] [PMC free article] [PubMed] [Google Scholar]
- 34. Zhang H, Han H, Liang Z, et al. Extracting information from previous full‐dose CT scan for knowledge‐based bayesian reconstruction of current low‐dose CT images. IEEE Trans Med Imaging. 2016;35:860–870. [DOI] [PMC free article] [PubMed] [Google Scholar]
- 35. Pourmorteza A, Dang H, Siewerdsen JH, Stayman JW. Reconstruction of difference in sequential CT studies using penalized likelihood estimation. Phys Med Biol. 2016;61:1986–2002. [DOI] [PMC free article] [PubMed] [Google Scholar]
- 36. Chen G‐H, Tang J, Leng S. Prior image constrained compressed sensing (PICCS): a method to accurately reconstruct dynamic CT images from highly undersampled projection data sets. Med Phys. 2008;35:660–663. [DOI] [PMC free article] [PubMed] [Google Scholar]
- 37. Thibault J‐B, Bouman CA, Sauer KD, Hsieh J. A recursive filter for noise reduction in statistical iterative tomographic imaging. In: Bouman CA, Miller EL, Pollak I, eds. Prof. SPIE. Bellingham, WA: International Society for Optics and Photonics; 2006:60650X–60650X‐10. [Google Scholar]
- 38. Ma J, Liang Z, Fan Y, et al. Variance analysis of x‐ray CT sinograms in the presence of electronic noise background. Med Phys. 2012;39:4051. [DOI] [PMC free article] [PubMed] [Google Scholar]
- 39. Nuyts J, De Man B, Fessler JA, Zbijewski W, Beekman FJ. Modelling the physics in the iterative reconstruction for transmission computed tomography. Phys Med Biol. 2013;58:R63–R96. [DOI] [PMC free article] [PubMed] [Google Scholar]
- 40. Wang J, Li T, Lu H, Liang Z. Penalized weighted least‐squares approach to sinogram noise reduction and image reconstruction for low‐dose X‐ray computed tomography. IEEE Trans Med Imaging. 2006;25:1272–1283. [DOI] [PMC free article] [PubMed] [Google Scholar]
- 41. Buades A, Coll B, Morel JM. A review of image denoising algorithms, with a new one. Multiscale Model Simul. 2005;4:490–530. [Google Scholar]
- 42. Chen Y, Chen W, Yin X, et al. Improving low‐dose abdominal CT images by weighted intensity averaging over large‐scale neighborhoods. Eur J Radiol. 2011;80:e42–e49. [DOI] [PubMed] [Google Scholar]
- 43. Chen Y, Yang Z, Hu Y, et al. Thoracic low‐dose CT image processing using an artifact suppressed large‐scale nonlocal means. Phys Med Biol. 2012;57:2667–2688. [DOI] [PubMed] [Google Scholar]
- 44. Zhang H, Zeng D, Zhang H, Wang J, Liang Z, Ma J. Applications of nonlocal means algorithm in low‐dose X‐ray CT image processing and reconstruction: a review. Med Phys. 2017;44:1168–1185. [DOI] [PMC free article] [PubMed] [Google Scholar]
- 45. Zeng D, Huang J, Bian Z, et al. A simple low‐dose X‐ray CT simulation from high‐dose scan. IEEE Trans Nucl Sci. 2015;62:2226–2233. [DOI] [PMC free article] [PubMed] [Google Scholar]
- 46. Wang Z, Bovik AC. A universal image quality index. IEEE Signal Process Lett. 2002;9:81–84. [Google Scholar]
- 47. Chang Z, Zhang R, Thibault J‐B, et al. Modeling and pre‐treatment of photon‐starved CT data for iterative reconstruction. IEEE Trans Med Imaging. 2017;36:277–287. [DOI] [PubMed] [Google Scholar]
- 48. Tang J, Nett BE, Chen G‐H. Performance comparison between total variation (TV)‐based compressed sensing and statistical iterative reconstruction algorithms. Phys Med Biol. 2009;54:5781–5804. [DOI] [PMC free article] [PubMed] [Google Scholar]
- 49. Liu Y, Liang Z, Ma J, et al. Total variation‐stokes strategy for sparse‐view X‐ray CT image reconstruction. IEEE Trans Med Imaging. 2014;33:749–763. [DOI] [PMC free article] [PubMed] [Google Scholar]
- 50. Stayman JW, Prince JL, Siewerdsen JH. Information propagation in prior‐image‐based reconstruction. In: International Conference on Image Formation in X‐Ray Computed Tomography. Vol. 2012. 2012:334–338. [PMC free article] [PubMed] [Google Scholar]


