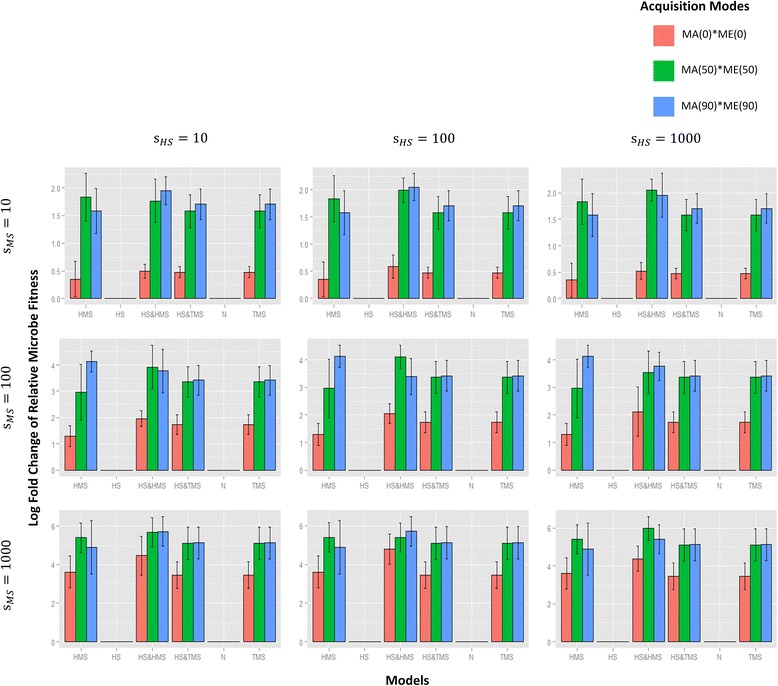
Fig. 7.

The effects of different models on microbe fitness. With similar layout, barplots are also plotted in the same way as those in Fig. 6 except that the vertical axis represents the log final fold change (after 200,000 generations and from 5 simulations) of average microbe fitnesses (from 5 replicates) with respect to the initial levels. Microbial fitness is strongly influenced by any selective model in which microbial selection operates, i.e., HMS, TMS, HS and HMS, and HS and TMS
