Abstract
Early stage detection and cancer treatment demand the identification of reliable biomarkers. Over the past decades, efforts have been devoted to assess the variation of glycosylation level as well as the glycan structures of proteins in blood or serum, associated with the development and/or progression of several cancers, including liver. Herein, an LC-MS/MS-based analysis was conducted to define the glycosylation patterns of haptoglobin glycoprotein derived from sera collected from cirrhotic and hepatocellular carcinoma (HCC) patients. The haptoglobin samples were extracted from serum using an antibody-immobilized column prior to the release of N-glycans. A comparison of non-isomeric and isomeric permethylated glycan forms was achieved using C18 and porous graphitic carbon (PGC) columns, respectively. In the case of C18-LC-MS/MS analysis, 25 glycan structures were identified of which 10 sialylated structures were found to be statistically significant between the two cohorts. Also, 8 out of 34 glycan structures identified by PGC-LC-MS/MS were found to be statistically significant, suggesting that isomeric distributions of a particular glycan composition were different in abundances between the two cohorts. The glycan isoform patterns distinguished early stage HCC from cirrhotic patients. Both retention times and tandem mass spectra were utilized to determine the specific isomeric glycan structures. All of the glycan isomers, which were statistically significant, were either branch fucosylated or composed of α-2,6 linked sialic acid moieties. The result of this study demonstrates the potential importance of isomeric separation for defining disease prompted aberrant glycan changes. The levels of several glycan isomers effectively distinguished early stage HCC from cirrhosis.
Keywords: Permethylated Glycans, Cirrhosis, Hepatocellular Carcinoma, Glycans Biomarker Discovery, Isomeric Separation, LC-MS/MS
1. Introduction
Hepatocellular carcinoma (HCC) is a common cancer type with a mortality rate that ranks third among cancer-related deaths in the world [1–3]. It is well known that a large percentage of HCC cases develop from liver cirrhosis, where physicians monitor these patients in the clinic for potential cancer development [4]. Due to its poor survival rate at advanced stages[5], the early stage detection of the transition from cirrhosis to HCC is necessary to receive effective clinical therapy. To date, several serum protein biomarkers have been reported and used clinically for HCC detection [6–8]. Serum alpha-fetoprotein (AFP), as an example, has been used as a general clinical biomarker for detection of HCC. However, AFP level can be affected by several factors, including gender, race, and the presence of onsets of other diseases such as chronic hepatitis [9]. Among patients with chronic hepatitis C, AFP concentration exhibits false positive in HCC diagnosis [10]. Although AFP can generally achieve an area under the curve (AUC) of > 0.8 for detection of HCC versus cirrhosis, effective markers for early detection of HCC are still lacking.
Glycosylation is considered as an important post-translational modification of proteins, which has a great impact on biological processes, such as cell-cell interaction, recognition, immune response and adhesion [11, 12]. Recently, the fucosylation level associated with different glycoproteins has been implicated in several cancer-related diseases, including pancreatic cancer [13], gastric cancer [14], and breast cancer [15]. Lectin-affinity electrophoresis using Lens culinaris agglutinin-A (specific for core-fucosylated glycan structures) was employed to detect HCC at early stages [16–18]. The levels of AFP in the blood serum collected from HCC patients interacted strongly with Lens culinaris agglutinin-A relative to that of patients with other liver diseases [16–18]. However, the accuracy of this method was determined to be limited [19].
Recent studies have demonstrated that either glycosylation patterns of human serum or fucosylation levels of extracted haptoglobin were different between cirrhosis and HCC [20, 21]. Although several glycans were suggested as potential biomarkers, isomeric structures of these glycans were not determined. Previously, sialic acid linkages have been shown to be relevant to several types of carcinoma cells [22, 23]. Mondal et al. used Sambucus nigra agglutinin and Maackia amurensis agglutinin lectin materials to identify the levels of α-2,6 and α-2,3 linkage of sialic acids associated with AFP [24]. Elevated levels of α-2,6 linked sialic acid expression in AFP was observed in patients with hepatitis B cirrhosis while elevated levels of α-2,3 linked sialic acids in AFP was observed in patients with hepatitis C cirrhosis, respectively [24]. Thus, it is rational to assume that the profiling of isomeric glycan structure of haptoglobin might effectively discriminate between cirrhosis and HCC.
LC-MS/MS is currently considered a great tool for biomolecule identification, enabling simultaneous glycan isomeric separation and structural assignment. Various separation techniques have been developed to resolve glycan isomers at both the glycan and glycopeptide levels [25–29]. Hydrophilic liquid interaction chromatography (HILIC) coupled with reducing end labeling or derivatization is an excellent approach to separate glycans or glycopeptides [30]. However, in positive mode, the ionization efficiency of native glycans especially sialylated species hinders the direct analysis of such species [31, 32]. Porous graphitic carbon (PGC) chromatography is another separation technique that is commonly used for the separation of glycans. PGC columns have unique ionic interaction with the analytes, prompting efficient separation. Studies that are detailing native and reducing end labeled glycans separation on PGC columns have been recently reviewed [33, 34]. However, the weak ionization of both native and some reducing-end labeled glycans does not permit sensitive analyses.
As a quick and efficient derivatization method, solid-phase permethylation has been used to dramatically increase the ionization efficiency of glycans, including sialylated structures [35, 36]. Recently, we have reported for the first time the isomeric separation of permethylated glycans at high sensitivity and efficiency, using PGC columns at high temperatures [37]. The LC resolution enhancement achieved in this study by elevating column temperature permitted the acquisition of tandem mass spectrum of each isomeric structure. With the combination of retention time and MS/MS, a series of isomeric forms of standard glycans were unequivocally characterized [37]. Here, we are applying the same method to assess changes in isomeric glycans resulting from the development of HCC. We are also comparing such data to what other data acquired to non-isomeric C18 analysis results.
2. Materials and Methods
2.1 Chemicals and Reagents
PNGase F was obtained from New England Biolabs (Ipswich, MA). The mouse anti-human haptoglobin antibody was purchased from Abcam (Cambridge, MA). Borane-ammonia complex, sodium hydroxide beads, and iodomethane were acquired from Sigma-Aldrich (St. Louis, MO). Dimethyl sulfoxide (DMSO) was bought from Mallinckrodt Chemicals (Phillipsburg, NJ). HPLC grade methanol and acetonitrile were purchased from Fisher Scientific (Fair Lawn, NJ). HPLC water was obtained from Avantor (Central Valley, PA). Spin columns were purchased from Harvard Apparatus (Holliston, MA).
Serum samples were provided by the University Hospital, Ann Arbor, Michigan according to IRB approval (10 cases of hepatocellular carcinoma (HCC) and 10 cases of liver cirrhosis.) The clinical information associated with the samples used in this study are summarized in Table 1 and Table S1.
Table 1.
Patient Clinical Information.
| Disease diagnosis | HCC | Cirrhosis |
|---|---|---|
| Number | 10 | 10 |
| Etiology% (HBV/HCV/ALC)a | 10/60/30 | 20/50/30 |
| Gender % (M/F) | 70/30 | 60/40 |
| Age (mean ± SD) | 58.9 ± 11 | 60.0 ± 7 |
| AFP levelb (median), ng/mL | 9.35 | 3.80 |
| MELDc score | 9.8 ± 5.6 | 9.3 ± 1.9 |
| TNM stage % (I/II/III/IV) | 0/70/10/20 | NA |
HBV: hepatitis B virus; HCV: hepatitis C virus; ALC: alcohol consumption.
AFP level was provided by Division of Gastroenterology, University of Michigan.
MELD: Model for end-stage liver disease.
2.2 Purification of Haptoglobin from Serum
Haptoglobin was purified from a 20-μL aliquot of serum for each patient by using an HPLC-based antibody-immobilized column developed in-house as previously reported [38]. Briefly, the mouse anti-human haptoglobin antibody was covalently immobilized on the UltraLink hydrazide resin (Thermo Scientific, Rockford, IL) and then packed into a PEEK column (4.6 mm × 50 mm). The immunoaffinity purification of haptoglobin was performed on a Beckman Coulter ProteomeLab PPS system (Fullerton, CA) based on the HPLC platform developed previously [38]. The bound haptoglobin fraction was eluted with stripping buffer (0.1 M Glycine, pH 2.5) and then immediately neutralized with 0.1 M Tris-HCl (pH 8.0). Subsequently, the enriched haptoglobin was desalted using a YM-3 centrifugal filter device (Millipore, Billerica, MA) by buffer exchange with water for three times and then dried down in a SpeedVac concentrator (Thermo). Before glycan release, the purity of the eluted haptoglobin was confirmed by 1D SDS-PAGE followed by silver staining using ProteoSilver™ Plus Silver Stain Kit (Sigma).
2.3 N-Glycan Release from Serum Haptoglobin
The N-glycans of haptoglobin were released and extracted according to the procedure described previously [39]. The purified haptoglobin was dissolved in 9 μL of deionized water, followed by adding a 1-μL aliquot of denaturing solution (0.2% SDS, 100 mM 2-mercaptoethanol), and incubated at 60 °C for 30 min. After cooling down, 4.3 μL of ammonium bicarbonate (50 mM) solution was added to obtain a final concentration of 15 mM. A 0.4-μL aliquot of PNGase F (two units). was added and incubated with the sample at 37 °C for 16 h, followed by quenching the enzymatic reaction at 95 °C for 10 min. The mixture of the released N-glycans and the protein were dried in a SpeedVac concentrator. Finally, N-glycans were extracted using porous graphitized carbon tips (Sigma) and then dried prior glycan permethylation and MS analysis.
2.4 Permethylation of released N-glycans
The released haptoglobin glycans from both cirrhosis and HCC samples were reduced and permethylated following the conventional protocol as previously described [36, 40, 41]. Briefly, an aqueous reduction borane-ammonia complex solution was prepared (composed of 10 μg/μL prepared in HPLC water). A 10-μL aliquot of the reduction borane-ammonia complex solution was added to each free glycan sample and incubated at 60 °C in a water bath for 1 hour. The reduced glycans were then washed with methanol and dried in a SpeedVac concentrator. This step was repeated to remove borate salt. The step was repeated several times until no white pellet was observed after drying.
Sodium hydroxide beads were soaked in DMSO and loaded into a spin column for solid-phase permethylation. The beads were drained by centrifuging in the spin column and washed one more time with DMSO. At the same time, the reduced glycans were resuspended in 30-μL DMSO, 20-μL iodomethane, and 1.2-μL HPLC water aliquots before applying to the spin columns. An additional 20-μL aliquot of iodomethane was added to the spin column after incubation for 25 min and incubated for another 15 min. The spin column was then centrifuged and washed with a 30-μL aliquot of acetonitrile (ACN). Finally, the collected solutions were dried overnight in SpeedVac concentrator and then resuspended in 20% ACN, 0.1 % formic acid (FA) buffer prior to LC-MS/MS analysis.
2.5 LC-MS/MS conditions
Although it is important to analyze the sample in random order, however, our previous results have demonstrated that the reproducibility and stability of both C18 and PGC-LC-MS/MS facilitated comparable results with and without randomization. Therefore, 10 cirrhosis samples, in both methods, were analyzed prior to the 10 HCC samples.
2.5.1. C18-LC-MS/MS conditions
After permethylation, the separation was conducted on an Acclaim PepMap C18 column (75 μm× 15 cm, 2 μm, 100 Å; Thermo Scientific, Pittsburgh, PA) using ultimate 3000 nanoUHPLC system (Dionex, Sunnyvale, CA). The previously employed LC at 55°C conditions was applied here [20]. Briefly, mobile phase A contains 98% HPLC water, 2% ACN, 0.1% FA, while mobile phase B is 100% ACN with 0.1% FA. The gradient started at 20% mobile phase B for the beginning 10 min and increased to 38% at 11 min. In the next 32 minutes, the organic phase gradually developed to 60%. After that, it ramped to 90% within 3 min and was maintained for 4 min. Finally, the percentage of mobile phase B dropped to 20% in 1 min and kept at that percentage for 9 min to pre-equilibrate the system. The nanoUHPLC system was interfaced to an LTQ Orbitrap Velos (Thermo Scientific, San Jose, CA) for MS analysis. The full MS range was set to 700–2000 m/z with a resolution of 15,000, followed by CID and HCD DDA (data-dependent analysis) MS/MS scans on the top 4 most intense ions. The activation energy of CID was set to 30% normalized energy with a 15 ms activation time while a 45% normalized energy was used for HCD with 0.1 ms of activation. In both fragmentation methods, activation Q value was set to 0.250.
2.5.2. PGC-LC-MS/MS conditions
The PGC-LC-MS/MS was performed using a high-temperature separation technique reported by our group previously [37]. The separation was performed on the same UHPLC platform with a HyperCarb PGC column (75 μM × 100 mm, 5 μM particle size; Thermo Scientific, Pittsburgh, PA). The temperature was set to 75°C to achieve the optimized separation. The content of mobile phase A and B were the same as the C18 separation mentioned above. A flux of 350 nL/min instead of 650 nL/min in the previous work was conducted on the column to obtain an improved resolution and higher intensity. The elution began with 20% of mobile phase B for 10 min and ramped to 35% at 11 min. The content of mobile phase B was increased to 60% in the next 9 minutes linearly. Then the increasing rate slightly slowed down and reached 90% at 46 min. High organic phase was maintained for 11 minutes. Finally, the gradient decreased to 20% in 1 min and column equilibrated for 2 minutes at 20% B. Tandem MS was set to scan the top 6 most intense ions, while the other settings remained the same as the C18-LC-MS/MS method.
3. Results and discussion
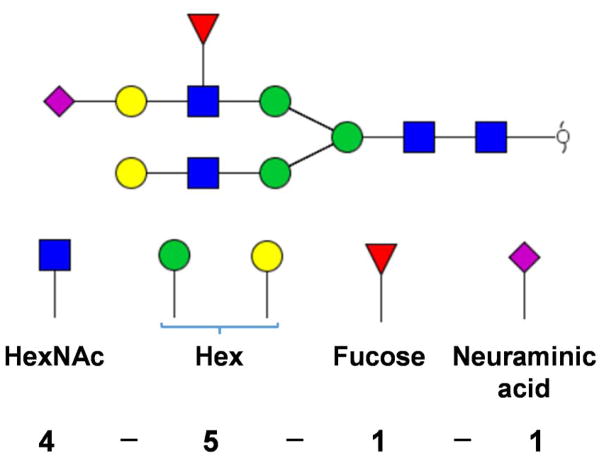
To simplify the annotation of glycan structures, a 4-digit nomenclature was employed here. Each digit represented the number of monosaccharides associated with an N-glycan structure in the following order: HexNAc–hexose–fucose–sialic acid (see Scheme 1). The quantification of N-glycan structures was based on the sum of peak areas of the extracted ion chromatogram (EIC) for each glycan using theoretical m/z values representing proton molecular ion as well as ammonium and sodium molecular ion adducts with a mass tolerance of 10 ppm. Each peak was assigned and integrated manually. All peak areas were normalized by total peak areas.
Scheme 1.
An example of glycan structure nomenclature used in this report. The model glycan structure contains 4 HexNAc, 3 Mannose, 2 Galactose, 1 Fucose and 1 Neuraminic acid residues. Hence, the nomenclature is [4-5-1-1]. Symbols:
 , GlcNAc;
 , mannose;
 galactose;
 , fucose;
 , N-acetylneuraminic acid.
3.1 C18-LC-MS/MS analysis
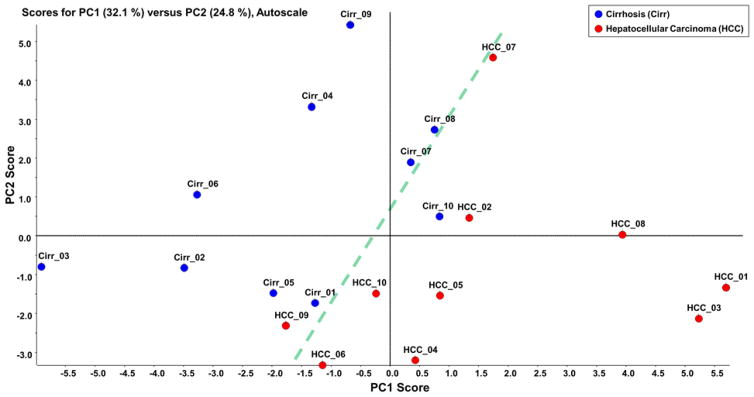
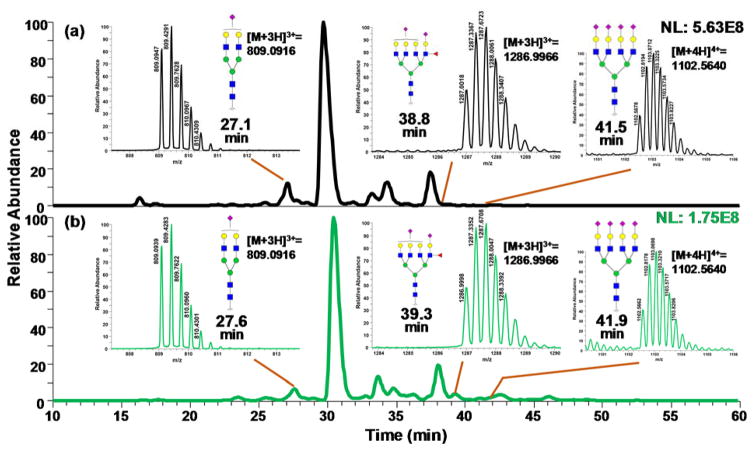
Initially, C18-LC-MS/MS analysis of permethylated glycans was used to identify the glycan structures between the different cohorts. Totally, 25 glycan structures were identified and quantified (Table S2). Unsupervised principal component analysis (PCA) was performed using Markerview™ (AB Sciex, Framingham, MA) in which all data points were analyzed without designation to avoid overfitting of data. The group properties of the 20 samples were analyzed using the relative abundances of each glycan structure calculated as described above. The PCA plot is shown in Figure 1 in which the glycosylation pattern of the cirrhosis and HCC samples can be mostly discriminated, although two samples did not correctly cluster. Loading plot of unsupervised PCA is depicted in Figure S1. Fucosylated structures seem to be primarily responsible for the discrimination in the PCA plot. Two-tailed student t-test was performed on the quantitative data similar to what have been used in biomarker studies performed by other groups [25, 42, 43]. Among the 25 glycan structures, 10 demonstrated significant discrimination with a p-value lower than 0.05. Figure 2 depicts the base peak intensity chromatograms for samples representing both cirrhosis and HCC. In Figure S2, the EIC of the significant glycans in cirrhosis and HCC samples were compared, demonstrating an excellent reproducibility regarding retention time and resolution. The glycans were well resolved by the C18 reversed-phase chromatography, even though some structures showed relatively low abundances. The retention time largely depended on the size of glycan structures and the number of sialic acids. The retention time order of elution is used to eliminate false positives, resulting from m/z overlap [20].
Figure 1.
Unsupervised PCA plot of the glycans that were quantitatively determined byC18-LC-MS/MS analysis. The corresponding loading plot is shown in Figure S1.
Figure 2.
Base peak intensity chromatograms of LC-MS/MS analyses of permethylated glycans derived from sera collected from cirrhotic (a) and hepatocellular carcinoma (b) patients. The insets depict the MS of glycans depicting statistically significant differences between the two cohorts. Symbols: as in Scheme 1.
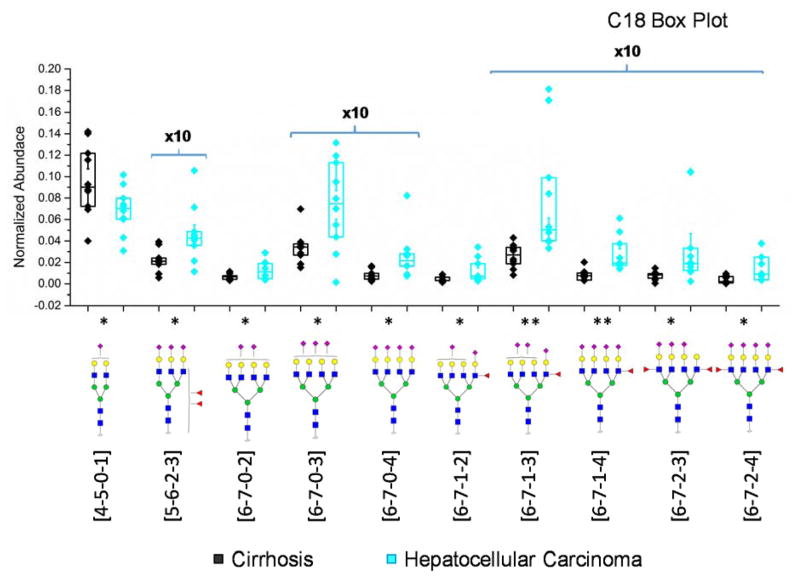
The abundance of glycans in cirrhosis and HCC samples was compared. Box plots illustrating the abundance of the statistically significant glycan structures are shown in Figure 3. All the statistically significant glycan structures were sialylated. Except [4-5-0-1], 9 sialylated glycans were upregulated in HCC relative to cirrhosis. Although the two tetraantennary difucosylated structures revealed a significant difference and were previously demonstrated as a potential biomarker to distinguish cirrhosis and HCC [38, 39, 44, 45], the most significant difference lay in [6-7-1-3] and [6-7-1-4] in our case. ROC curves of the 6 most significant glycans were generated and depicted in Figure S3. Although the sample sizes were not large enough, the area under curves for all six structures are higher than 0.8, a value defined to be indicative of potential biomarkers.
Figure 3.
Box plots of normalized abundances of significant glycan structures based on the C18-LC-MS/MS analysis. Y-axis associated with glycans present at low abundances were 10x magnified. Asterisks indicate the level of statistical significance. Boxes depicted 25% and 75% of the samples while the whiskers showed standard error. Symbols: as in Scheme 1.
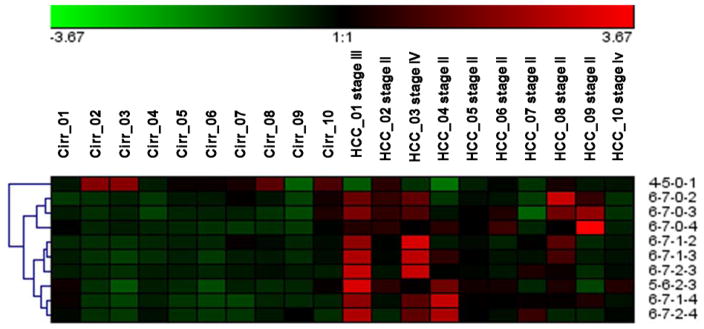
Unlike previous studies, the neuraminidase digestion was not necessary for the current study due to the enhancement in ionization efficiency of sialylated species by permethylation. Therefore, the glycans differing in the numbers of sialic acids can be revealed by permethylation. It is also worth mentioning that instead of commonly-seen core fucosylation, the glycans derived from these samples were highly branch-fucosylated. This discovery agrees with a reported glycoform profiling results of serum haptoglobin derived from prostate cancer patients and control subjects.[46] In Figure 4, the heat map generated from the relative abundances of each of the glycans also illustrated that tetraantennary sialic acids are more abundant in HCC haptoglobin, while monosialylated biantennary glycan [4-5-0-1] was downregulated in cirrhosis relative to HCC. Also, from the cluster tree labeled in the heat map, fucosylated tetraantennary species showed similarity with each other, and non-fucosylated classified in a different category.
Figure 4.
Heat map of the C18-LC-MS/MS analysis of glycans that have illustrated significant differences between the two cohorts.
Our C18-LC-MS/MS analysis of permethylated glycans permitted the identification of more glycans than the previous studies of haptoglobin glycosylation patterns in various types of cancer-related diseases. Previously, only 8 glycan structures were identified and quantified since N-neuraminidase was employed to remove sialic acids prior to analysis [39]. Fujimura et al. study, identified 16 permethylated haptoglobin glycan structures derived from blood sera of prostate cancer patients [46]. All 16 glycan structures were identified in our study except for one In another study, 10 glycans derived from haptoglobin isolated from blood sera collected from pancreatic cancer patients were identified by pyridylamino (PA) reducing end labeling and LC-MS analysis [47]. Accordingly, our C18-LC-MS/MS analysis of permethylated glycans provided the highest sensitivity as suggested by the number of glycans detected. This great sensitivity is expected since permethylation enhances MS ionization by at least 2-orders of magnitudes relative to native glycans [48, 49].
Since the quantitation results were achieved using C18-LC-MS/MS, the detailed information about glycan isomers including sialic acid linkage isomers and fucosylation isomers could not be well defined. Therefore, we employed our newly developed PGC-LC-MS/MS analysis of permethylated glycans [37] to provide insights about the roles of glycan isomers in the development of HCC.
3.2 PGC-LC-MS/MS analysis
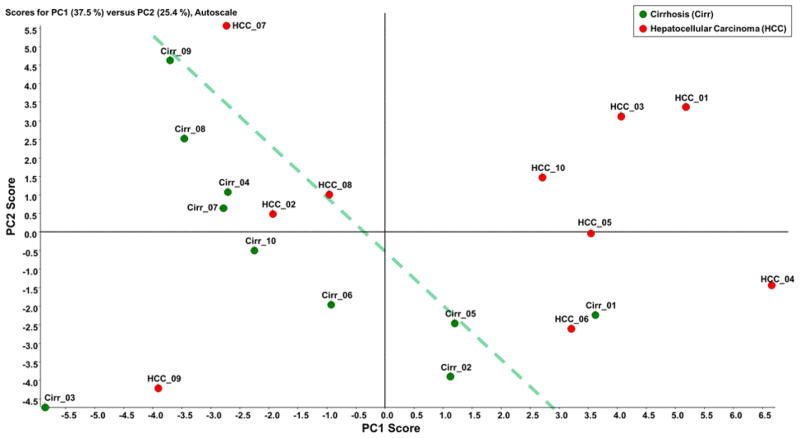
After a logarithmic transformation of the normalized abundance values, Figure 5 depicts unsupervised PCA plot of the glycans resolved on PGC columns. The numerical data for quantitation are summarized in Table S3. Loading plot is depicted in Figure S4. Fucosylated structures are still responsible for the discrimination shown in the PCA plot. The result demonstrated the difference between glycosylation patterns of cirrhosis and HCC haptoglobin to be noticeably similar to what was observed in the case of C18 separation (compare Figures 1 and 5).
Figure 5.
Unsupervised PCA plot of the glycans that were quantitatively determined by PGC-LC-MS/MS analysis. The corresponding loading plot was shown in Figure S4.
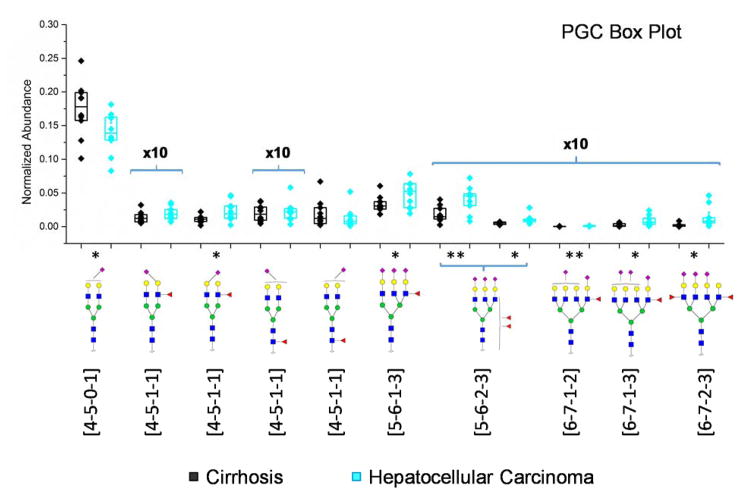
As shown in Figure 6, a boxplot comparison was utilized to describe the discrimination in the normalized abundance of the statistically significant glycan structures determined by t-test. The [4-5-0-1] glycan structure in the case of PGC-LC-MS/MS analysis was also the most abundant glycan with statistical significance. This structure exhibited a downregulation between cirrhosis and HCC. ROC curves of the 6 most significant glycans were generated and depicted in Figure S5. AUCs were shown in the inset of Figure S5, suggesting a good ability for these structures distinguish cirrhosis and HCC samples.
Figure 6.
Box plot of normalized abundances of the glycan structures that depicted significant different among the two cohorts upon PGC-LC-MS/MS analysis, Y-axis associated with glycans present at low abundances were 10x magnified. The significant [5-6-1-3] refers to one of two isomers found with larger retention time, while for [5-6-2-3], to the left side is the first eluted isomer and on the right is the second isomer. Boxes depicted 25% and 75% of the samples while the whiskers showed standard error. Asterisks indicate the level of statistical significance. Symbols: as in Scheme 1.
The assignments of the isomers were based on three criteria: CID MS/MS, retention time and elution order. For the fucosylated glycans, since the possibility of forming isomers resulted from the fucose attachment to core or branch GlcNAc, the diagnostic fragment ions at m/z 468.4 999.7 and 638.5, etc. can be employed to distinguish between the different structure isomers [37]. Also, sialic acids with a α-2,6 linkage always eluted 3–4 minutes later than its counterpart with α-2,3 linkage, regardless of the branch to which it is attached as shown previously [50]. Based on this fact, [4-5-0-1] can be specified to α-2,6 linkage according to the retention time when compared to the standard glycans from bovine fetuin [37]. EIC of [4-5-0-2] and [5-6-0-1] glycan isomers are depicted in Figure S6 and SI 7, respectively.
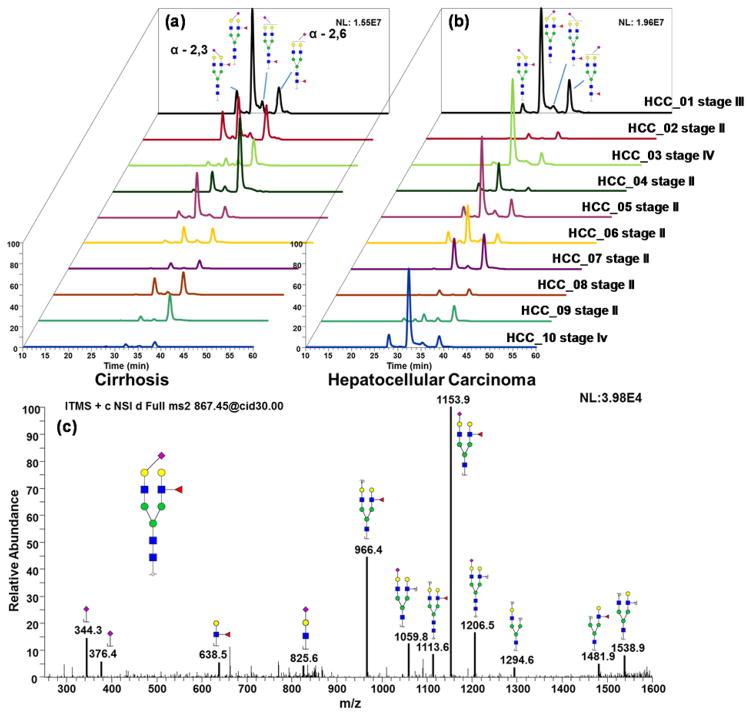
Figure 7 depicts the EIC of protonated [4-5-1-1] at m/z 867.1213, in which four peaks were detected in both cirrhosis (Figure 7a) and HCC (Figure 7b). The most intense peak was significantly more abundant in HCC haptoglobin compared to liver cirrhosis. The assignment of fucosylation positions was based on its MS/MS spectrum depicted in Figure 7c. As we noticed, the most commonly used characteristic peak for core-fucosylated glycans at m/z 468.3 was not present in this spectrum. Instead, a fragment at m/z 1153.9 and m/z 966.4 provided solid evidence of branch-fucosylation, since, for permethylated glycans, fucose migration was not possible. Thus, the only reasonable explanation was the existence of a branch-fucosylated structure. Moreover, the fact that sialic acid and fucose were attached to different arms was revealed. According to the presence of fragments at m/z 638.5 and 825.6, the possibility of sialyl-Lewis x (SLex) was ruled out. Although the arm attachment (i.e. whether fucose was attached to the α3 or α6 arms) remained unknown, the fucosylation and sialylation sites were confirmed.
Figure 7.
EIC of biantennary monosialylated branch-fucosylated glycan linkage isomers derived from (a) cirrhotic and (b) hepatocellular carcinoma patients. (c) MS/MS interpretation of biantennary monosialylated branch-fucosylated glycan. Symbols: as in Scheme 1.
Since the first peak at 27.2 min exhibits similar MS/MS pattern (Figure S8) as the second peak, we considered them as both branch-fucosylated glycans, even though the sialic acid is attached to different branches. However, the third peak (Figure S9) and the fourth peak (Figure S10) both had distinct MS/MS spectra from the first two peaks, where the diagnostic peaks for core-fucosylation at m/z 468.3 were presented in both cases. Thus, the first two peaks were considered as branch-fucosylated, and the latter two were the core-fucosylated peaks. The sialic acid linkages were annotated based on the retention time where the rule of the elution order was applied. Therefore, the first eluting peak was assigned as α-2,3 linkage and the second one was recognized as α-2,6 linked.
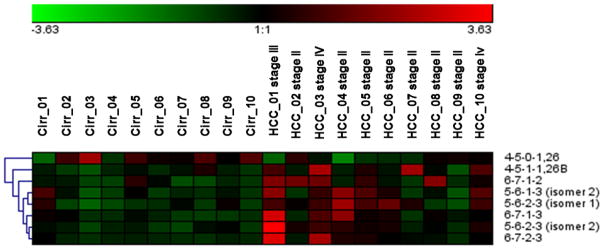
Another issue worth mentioning is that two of the PGC-significant structures, [4-5-1-1] and [5-6-1-3], were not detected by t-test upon C18 quantitation. It is possible that these two specific isomers were masked by the other non-significant ones with the same m/z. Therefore, an isomeric separation on PGC could provide additional potential biomarkers for early stage liver cancer diagnostic. Even though the p-value is relatively high for these glycans, the advantage in abundance could make it useful as a potential biomarker. Compared to our C18 t-test result, tetra-sialylated structures and other large sized glycans were missing in the PGC-LC-MS/MS analysis. On the one hand, it is possible that some of the structures or isomers were not eluted due to the strong retention feature of the PGC column material. On the contrary, after the isomers were separated, the intensity would decrease evidently to the point below the limit of quantitation (LOQ) or even limit of detection (LOD). This applies especially to the complex structures since the theoretical numbers of isomeric structures increase exponentially with the size of the structure. Nevertheless, according to the box-plot result, the most significant glycan was the isomer of [5-6-2-3] that eluted first on the column. As noticed, the highly sialylated structures were less significant in the case of PGC separation. Although carry-over in PGC because of the strong interaction between the column and the analytes has been previously reported [51], these non-eluting isomers could be more significance in this case. In Figure 8, the cluster properties were described in a heat map. Except for α-2,6 linked [4-5-1-1], all other structures can be clustered into an upregulated group, which suggests that the transformation of cirrhosis to HCC could promote an increased expression of fucosylated and sialylated structures.
Figure 8.
Heat map of the PGC LC-MS/MS analysis of glycans that have illustrated significance differences between the two cohorts, where [4-5-0-1,26] refers to the α-2,6 linked sialic acid and [4-5-1-1,26B] refers toα-2,6 linked sialic acid and a branch fucose.
Although efforts have been devoted to assigning the fucosylation sites of glycoforms associated with HCC, separation of the glycan isomers, as well as the sialic acid linkages, largely remained unclear. Previously, the glycan isomers caused by the difference in fucosylation sites were noticed and illustrated by MS/MS and MS3; however, no isomeric assignment was reported [52]. IMS/MS were also utilized for glycan profiling in serum from HCC patients. Although the isomeric structures of [4-5-0-1] were resolved and compared, the assignment was not achieved [5353]. To our knowledge, this is the first work that quantitatively compares the glycosylation pattern between cirrhosis and HCC at the isomeric level in which glycan isomers are identified.
4. Conclusion
In this study, N-glycans released from haptoglobin purified from the serum of cirrhotic and HCC patients were analyzed by C18 and PGC liquid chromatography. The glycan structures associated with cirrhosis and HCC exhibited a discernible pattern. In C18 separation, 10 glycan structures were found to be significant; while on the PGC column, 8 glycan isomers were considered quantitatively unique. Determination of sialic acid and fucose linkages was facilitated by PGC-LC-MS/MS analysis. This work shows that glycan isomers would make a difference in quantitative pattern characteristics in the biomarker discovery process, where the technique can even be applied to early stage cancer detection. Therefore, future efforts will be devoted to isomeric glycans as biomarkers and their biological synthesis pathway that potentially influences the glycosylation pattern of haptoglobin in blood serum.
Supplementary Material
Acknowledgments
This work was supported by NIH Grants 1R01GM112490-03 (YM), R01GM49500 (DML) and R01CA160254 (DML).
References
- 1.Ferlay J, Shin HR, Bray F, Forman D, Mathers C, Parkin DM. Int J Cancer. 2010;127:2893–2917. doi: 10.1002/ijc.25516. [DOI] [PubMed] [Google Scholar]
- 2.Kamangar F, Dores GM, Anderson WF. J Clin Oncol. 2006;24:2137–2150. doi: 10.1200/JCO.2005.05.2308. [DOI] [PubMed] [Google Scholar]
- 3.Yin X, Zheng SS, Zhang L, Xie XY, Wang Y, Zhang BH, Wu W, Qiu S, Ren ZG. Gene. 2017;596:53–88. doi: 10.1016/j.gene.2016.10.008. [DOI] [PubMed] [Google Scholar]
- 4.El-Serag HB. N Engl J Med. 2011;365:1118–1127. doi: 10.1056/NEJMra1001683. [DOI] [PubMed] [Google Scholar]
- 5.Llovet JM, Bru C, Bruix J. Semin Liver Dis. 1999;19:329–338. doi: 10.1055/s-2007-1007122. [DOI] [PubMed] [Google Scholar]
- 6.Ma X, Wang X, Yang C, Wang Z, Han B, Wu L, Zhuang L. Anticancer Res. 2016;36:6389–6398. doi: 10.21873/anticanres.11236. [DOI] [PubMed] [Google Scholar]
- 7.Wang F, Huang J, Zhu Z, Ma X, Cao L, Zhang Y, Chen W, Dong Y. Cancer Prev Res (Phila) 2016;9:739–749. doi: 10.1158/1940-6207.CAPR-16-0023. [DOI] [PubMed] [Google Scholar]
- 8.Liu X, Chi X, Gong Q, Gao L, Niu Y, Cheng M, Si Y, Wang M, Zhong J, Niu J, Yang W. PLoS One. 2015;10:e0127518. doi: 10.1371/journal.pone.0127518. [DOI] [PMC free article] [PubMed] [Google Scholar]
- 9.Cheng HT, Chang YH, Chen YY, Lee TH, Tai DI, Lin DY. J Chin Med Assoc. 2007;70:310–317. doi: 10.1016/S1726-4901(08)70011-X. [DOI] [PubMed] [Google Scholar]
- 10.Di Bisceglie AM, Sterling RK, Chung RT, Everhart JE, Dienstag JL, Bonkovsky HL, Wright EC, Everson GT, Lindsay KL, Lok AS, Lee WM, Morgan TR, Ghany MG, Gretch DR. J Hepatol. 2005;43:434–441. doi: 10.1016/j.jhep.2005.03.019. [DOI] [PubMed] [Google Scholar]
- 11.Dwek RA. Chem Rev. 1996;96:683–720. doi: 10.1021/cr940283b. [DOI] [PubMed] [Google Scholar]
- 12.Khoury GA, Baliban RC, Floudas CA. Sci Rep. 2011;1 doi: 10.1038/srep00090. [DOI] [PMC free article] [PubMed] [Google Scholar]
- 13.Terao N, Takamatsu S, Minehira T, Sobajima T, Nakayama K, Kamada Y, Miyoshi E. World J Gastroenterol. 2015;21:3876–3887. doi: 10.3748/wjg.v21.i13.3876. [DOI] [PMC free article] [PubMed] [Google Scholar]
- 14.Zhao YP, Xu XY, Fang M, Wang H, You Q, Yi CH, Ji J, Gu X, Zhou PT, Cheng C, Gao CF. PLoS One. 2014;9:e94536. doi: 10.1371/journal.pone.0094536. [DOI] [PMC free article] [PubMed] [Google Scholar]
- 15.Feng X, Zhao L, Gao S, Song X, Dong W, Zhao Y, Zhou H, Cheng L, Miao X, Jia L. Gene. 2016;578:232–241. doi: 10.1016/j.gene.2015.12.028. [DOI] [PubMed] [Google Scholar]
- 16.Sato Y, Nakata K, Kato Y, Shima M, Ishii N, Koji T, Taketa K, Endo Y, Nagataki S. N Engl J Med. 1993;328:1802–1806. doi: 10.1056/NEJM199306243282502. [DOI] [PubMed] [Google Scholar]
- 17.Taketa K, Endo Y, Sekiya C, Tanikawa K, Koji T, Taga H, Satomura S, Matsuura S, Kawai T, Hirai H. Cancer Res. 1993;53:5419–5423. [PubMed] [Google Scholar]
- 18.Shiraki K, Takase K, Tameda Y, Hamada M, Kosaka Y, Nakano T. Hepatology. 1995;22:802–807. [PubMed] [Google Scholar]
- 19.Lim TS, Kim do Y, Han KH, Kim HS, Shin SH, Jung KS, Kim BK, Kim SU, Park JY, Ahn SH. Scand J Gastroenterol. 2016;51:344–353. doi: 10.3109/00365521.2015.1082190. [DOI] [PubMed] [Google Scholar]
- 20.Zhou S, Hu Y, Mechref Y. Electrophoresis. 2016;37:1506–1513. doi: 10.1002/elps.201500568. [DOI] [PMC free article] [PubMed] [Google Scholar]
- 21.Tsai TH, Wang M, Di Poto C, Hu Y, Zhou S, Zhao Y, Varghese RS, Luo Y, Tadesse MG, Ziada DH, Desai CS, Shetty K, Mechref Y, Ressom HW. J Proteome Res. 2014;13:4859–4868. doi: 10.1021/pr500460k. [DOI] [PMC free article] [PubMed] [Google Scholar]
- 22.Chovanec M, Plzak J, Betka J, Brabec J, Kodet R, Smetana K., Jr Oncol Rep. 2004;12:297–301. [PubMed] [Google Scholar]
- 23.Holikova Z, Hrdlickova-Cela E, Plzak J, Smetana K, Jr, Betka J, Dvorankova B, Esner M, Wasano K, Andre S, Kaltner H, Motlik J, Hercogova J, Kodet R, Gabius HJ. APMIS. 2002;110:845–856. doi: 10.1034/j.1600-0463.2002.1101202.x. [DOI] [PubMed] [Google Scholar]
- 24.Mondal G, Chatterjee U, Chawla YK, Chatterjee BP. Glycoconj J. 2011;28:1–9. doi: 10.1007/s10719-010-9316-z. [DOI] [PubMed] [Google Scholar]
- 25.Hua S, An HJ, Ozcan S, Ro GS, Soares S, DeVere-White R, Lebrilla CB. Analyst. 2011;136:3663–3671. doi: 10.1039/c1an15093f. [DOI] [PMC free article] [PubMed] [Google Scholar]
- 26.Michael C, Rizzi AM. J Chromatogr A. 2015;1383:88–95. doi: 10.1016/j.chroma.2015.01.028. [DOI] [PubMed] [Google Scholar]
- 27.Tao S, Huang Y, Boyes BE, Orlando R. Anal Chem. 2014;86:10584–10590. doi: 10.1021/ac5020996. [DOI] [PMC free article] [PubMed] [Google Scholar]
- 28.Brereton KR, Green DB. Talanta. 2012;100:384–390. doi: 10.1016/j.talanta.2012.08.003. [DOI] [PubMed] [Google Scholar]
- 29.Huang Y, Nie Y, Boyes B, Orlando R. J Biomol Tech. 2016;27:98–104. doi: 10.7171/jbt.16-2703-003. [DOI] [PMC free article] [PubMed] [Google Scholar]
- 30.Kailemia MJ, Ruhaak LR, Lebrilla CB, Amster IJ. Anal Chem. 2014;86:196–212. doi: 10.1021/ac403969n. [DOI] [PMC free article] [PubMed] [Google Scholar]
- 31.Zaia J. Mass Spectrom Rev. 2004;23:161–227. doi: 10.1002/mas.10073. [DOI] [PubMed] [Google Scholar]
- 32.Alley WR, Jr, Madera M, Mechref Y, Novotny MV. Anal Chem. 2010;82:5095–5106. doi: 10.1021/ac100131e. [DOI] [PMC free article] [PubMed] [Google Scholar]
- 33.Kolarich D, Windwarder M, Alagesan K, Altmann F. Methods Mol Biol. 2015;1321:427–435. doi: 10.1007/978-1-4939-2760-9_29. [DOI] [PubMed] [Google Scholar]
- 34.Zhang Q, Feng X, Li H, Liu BF, Lin Y, Liu X. Anal Chem. 2014;86:7913–7919. doi: 10.1021/ac501844b. [DOI] [PubMed] [Google Scholar]
- 35.Mechref Y, Kang P, Novotny MV. Methods Mol Biol. 2009;534:53–64. doi: 10.1007/978-1-59745-022-5_4. [DOI] [PubMed] [Google Scholar]
- 36.Kang P, Mechref Y, Novotny MV. Rapid Commun Mass Spectrom. 2008;22:721–734. doi: 10.1002/rcm.3395. [DOI] [PubMed] [Google Scholar]
- 37.Zhou S, Dong X, Veillon L, Huang Y, Mechref Y. Anal Bioanal Chem. 2016 doi: 10.1007/s00216-016-9996-8. [DOI] [PMC free article] [PubMed] [Google Scholar]
- 38.Zhu J, Wu J, Yin H, Marrero J, Lubman DM. J Proteome Res. 2015;14:4932–4939. doi: 10.1021/acs.jproteome.5b00662. [DOI] [PMC free article] [PubMed] [Google Scholar]
- 39.Zhu J, Lin Z, Wu J, Yin H, Dai J, Feng Z, Marrero J, Lubman DM. J Proteome Res. 2014;13:2986–2997. doi: 10.1021/pr500128t. [DOI] [PMC free article] [PubMed] [Google Scholar]
- 40.Kang P, Mechref Y, Klouckova I, Novotny MV. Rapid Commun Mass Spectrom. 2005;19:3421–3428. doi: 10.1002/rcm.2210. [DOI] [PMC free article] [PubMed] [Google Scholar]
- 41.Mechref Y, Hussein A, Bekesova S, Pungpapong V, Zhang M, Dobrolecki LE, Hickey RJ, Hammoud ZT, Novotny MV. J Proteome Res. 2009;8:2656–2666. doi: 10.1021/pr8008385. [DOI] [PMC free article] [PubMed] [Google Scholar]
- 42.de Leoz ML, An HJ, Kronewitter S, Kim J, Beecroft S, Vinall R, Miyamoto S, de Vere White R, Lam KS, Lebrilla C. Dis Markers. 2008;25:243–258. doi: 10.1155/2008/515318. [DOI] [PMC free article] [PubMed] [Google Scholar]
- 43.Nie S, Lo A, Wu J, Zhu J, Tan Z, Simeone DM, Anderson MA, Shedden KA, Ruffin MT, Lubman DM. J Proteome Res. 2014;13:1873–1884. doi: 10.1021/pr400967x. [DOI] [PMC free article] [PubMed] [Google Scholar]
- 44.Yin H, Tan Z, Wu J, Zhu J, Shedden KA, Marrero J, Lubman DM. J Proteome Res. 2015;14:4876–4884. doi: 10.1021/acs.jproteome.5b00718. [DOI] [PMC free article] [PubMed] [Google Scholar]
- 45.Zhang Y, Zhu J, Yin H, Marrero J, Zhang XX, Lubman DM. J Proteome Res. 2015;14:5388–5395. doi: 10.1021/acs.jproteome.5b00792. [DOI] [PMC free article] [PubMed] [Google Scholar]
- 46.Fujimura T, Shinohara Y, Tissot B, Pang PC, Kurogochi M, Saito S, Arai Y, Sadilek M, Murayama K, Dell A, Nishimura S, Hakomori SI. Int J Cancer. 2008;122:39–49. doi: 10.1002/ijc.22958. [DOI] [PubMed] [Google Scholar]
- 47.Okuyama N, Ide Y, Nakano M, Nakagawa T, Yamanaka K, Moriwaki K, Murata K, Ohigashi H, Yokoyama S, Eguchi H, Ishikawa O, Ito T, Kato M, Kasahara A, Kawano S, Gu J, Taniguchi N, Miyoshi E. Int J Cancer. 2006;118:2803–2808. doi: 10.1002/ijc.21728. [DOI] [PubMed] [Google Scholar]
- 48.Mechref Y, Hu Y, Desantos-Garcia JL, Hussein A, Tang H. Mol Cell Proteomics. 2013;12:874–884. doi: 10.1074/mcp.R112.026310. [DOI] [PMC free article] [PubMed] [Google Scholar]
- 49.Mechref Y, Zhou S, Hu Y, Hussein A, Tang H. Encyclopedia of Analytical Chemistry. 2014 Published Online. [Google Scholar]
- 50.Zhou S, Dong X, Huang Y, Vellion L, Kitagawa D, Aquino A, Mechref Y. Anal Chem. Submitted. [Google Scholar]
- 51.Pabst M, Altmann F. Anal Chem. 2008;80:7534–7542. doi: 10.1021/ac801024r. [DOI] [PubMed] [Google Scholar]
- 52.Pompach P, Ashline DJ, Brnakova Z, Benicky J, Sanda M, Goldman R. J Proteome Res. 2014;13:5561–5569. doi: 10.1021/pr5005482. [DOI] [PMC free article] [PubMed] [Google Scholar]
- 53.Isailovic D, Kurulugama RT, Plasencia MD, Stokes ST, Kyselova Z, Goldman R, Mechref Y, Novotny MV, Clemmer DE. J Proteome Res. 2008;7:1109–1117. doi: 10.1021/pr700702r. [DOI] [PMC free article] [PubMed] [Google Scholar]
Associated Data
This section collects any data citations, data availability statements, or supplementary materials included in this article.


