

Abstract
Fatty liver is the most common type of liver disease, affecting nearly one third of the U.S. population and more than half a billion people worldwide. Abnormalities in endoplasmic reticulum (ER) calcium handling and mitochondrial function each have been implicated in abnormal lipid droplet formation. Here we show that the type 1 isoform of the inositol 1,4,5‐trisphosphate receptor (InsP3R1) specifically links ER calcium release to mitochondrial calcium signaling and lipid droplet formation in hepatocytes. Moreover, liver‐specific InsP3R1 knockout mice have impaired mitochondrial calcium signaling, decreased hepatic triglycerides, and reduced lipid droplet formation and are resistant to the development of fatty liver. Patients with nonalcoholic steatohepatitis, the most malignant form of fatty liver, have increased hepatic expression of InsP3R1, and the extent of ER–mitochondrial colocalization correlates with the degree of steatosis in human liver biopsies. Conclusion: InsP3R1 plays a central role in lipid droplet formation in hepatocytes, and the data suggest that it is involved in the development of human fatty liver disease. (Hepatology Communications 2017;1:23–35)
Abbreviations
- ATP
adenosine triphosphate
- BSA
bovine serum albumin
- ER
endoplasmic reticulum
- FFPE
formalin‐fixed, paraffin‐embedded
- HE
hyperinsulinemic‐euglycemic
- HEPES
4‐(2‐hydroxyethyl)‐1‐piperazine ethanesulfonic acid
- HFD
high‐fat diet
- InsP3
inositol 1,4,5‐trisphosphate
- InsP3R
inositol 1,4,5‐trisphosphate receptor
- KO
knockout
- LSKO
liver‐specific knockout
- mRNA
messenger RNA
- NAFLD
nonalcoholic fatty liver disease
- NASH
nonalcoholic steatohepatitis
- PCR
polymerase chain reaction
- PDI
protein disulfide isomerase
- SEM
standard error of the mean
- Tom‐22
translocase of outer mitochondrial membrane 22
- WT
wild‐type
Introduction
Nonalcoholic fatty liver disease (NAFLD) is the most common form of chronic liver disease worldwide, affecting more than 25% of the global population.1 Prevalence in Europe and the US may be as high as one in three individuals.1 Although many individuals with NAFLD have simple hepatic steatosis, a subset also develop hepatic inflammation, termed nonalcoholic steatohepatitis (NASH). Those patients are at particularly high risk to progress to cirrhosis and hepatocellular carcinoma,1 the third leading cause of cancer death worldwide.2 NAFLD is often, but not always, associated with obesity and diabetes3 and is an independent risk factor for coronary artery disease.4, 5 Recent studies using several different animal models implicate abnormal handling of calcium (Ca2+) by the endoplasmic reticulum (ER)6, 7, 8 or mitochondrial dysfunction9, 10, 11 as the basis for aberrant lipid accumulation in hepatocytes. Ca2+ signals have well‐established importance in the cascade of events linking hormonal signaling to metabolic processes in the liver,12, 13, 14 and the inositol 1,4,5 trisphosphate receptor (InsP3R) is the only intracellular calcium release channel in hepatocytes.15 There are three InsP3R isoforms, with varying sensitivity to Ca2+ and inositol 1,4,5 trisphosphate (InsP3) and distinct tissue and subcellular expression patterns.16 In hepatocytes, the predominant isoforms are InsP3R1 and InsP3R2, with the latter being most concentrated in the region of the ER along the apical (canalicular) membrane.15 Conversely, InsP3R1 is diffusely distributed throughout the cytoplasm.15 Ca2+ homeostasis, and more specifically InsP3R, plays an important role in metabolic pathways in the liver, but isoform‐specific effects are not well characterized.7, 17, 18, 19, 20 Although InsP3R2 is the predominant isoform in hepatocytes15 and is important for regulating bile secretion,21, 22 InsP3R2 knockout (KO) mice have no apparent metabolic phenotype.23 Therefore, we examined the role of InsP3R1 in hepatic steatosis. Given the nearly ubiquitous expression of InsP3R1,16 in addition to the fact that whole body InsP3R1 KO mice die in the perinatal period,24 a hepatocyte‐specific KO was generated to appropriately interrogate the metabolic role of InsP3R1 in the liver.
Materials and Methods
MOUSE STRAINS AND ISOLATION AND SANDWICH CULTURE OF MOUSE HEPATOCYTES
Floxed InsP3R1 mice were created and imported from our colleagues in the laboratory of Andrew Marks at Columbia University. Briefly, exon 4, the second coding exon of the Itpr1 gene, encoding InsP3R1, was flanked with loxP sites. The final InsP3R1 flox/flox mice were crossed for six generations onto a C57/bl6 background. InsP3R1 flox/flox mice were crossed with Alb‐Cre mice to obtain InsP3R1 Cre: flox/+ mice, which were backcrossed with InsP3R1 flox/flox mice to generate Cre: flox/flox mice. Breeders from the second generation of the crossing of Cre: flox/flox mice were used for experiments. Male littermate flox/flox and Cre: flox/flox InsP3R1 liver‐specific knockout (LSKO) mice were selected for experiments. Genotyping was performed with the following primers with the first set identifying Cre recombinase and the second set for the InsP3R1 flox allele. The flox primers generate a wild‐type (WT) polymerase chain reaction (PCR) product of size 320 bp and a mutant PCR product, containing the loxP sites of 406 bp (Cre: TG CCACGACCAAGTGACAGCAATG [forward], AGAGACGGAAATCCATCGCTCG [reverse]; InsP3R1 flox: GAAGCCGGGGACCTTAACA ATC [forward], TTGGCAATACTTATTCTGTA GACAAAC [reverse]). InsP3R2 whole body KO (InsP3R2 KO) mice were a gift from Ju Chen (University of California, San Diego). Mouse hepatocytes were isolated in the Cell Isolation Core of the Yale Liver Center. Briefly, livers from WT and InsP3R1 LSKO mice and InsP3R2 KO mice were perfused with Hanks A and then Hanks B medium containing 0.05% collagenase (Roche Applied Science, Indianapolis, IN) and 0.8 units of trypsin inhibitor (Sigma‐Aldrich, St. Louis, MO) per unit of tryptic activity. Livers were minced and passed through a 40‐µm nylon mesh filter, and the resultant cells were washed. Isolated hepatocytes were resuspended in complete Williams medium E. Cells were then seeded onto collagen‐I–coated coverslips and incubated at 37°C for 2 hours before transfection with plasmids. Cells were coated with a second layer of collagen‐I 24 hours after transfection and were used in the experiments 96 hours after plating. All experimental procedures and euthanasia were approved by the Institutional Animal Care and Use Committee.
DETECTION OF Ca2+ SIGNALS IN THE CYTOPLASM AND MITOCHONDRIA
Cells were transfected with the cytosolic red fluorescent protein‐tagged genetically encoded Ca2+ indicator for optical imaging R‐GECO25 (Addgene plasmid #32444) and the mitochondrial matrix‐targeted Ca2+ indicator Inverse Pericam (a gift from Gyorgy Hajnoczky, Thomas Jefferson University) using Lipofectamine RNAiMAX according to the manufacturer's instructions. Ca2+ imaging experiments were performed in 4‐(2‐hydroxyethyl)‐1‐piperazine ethanesulfonic acid (HEPES)‐buffered solution (NaCl, 130 mmol/L; KCl, 5 mmol/L; CaCl2, 1.25 mmol/L; KH2PO4, 1.2 mmol/L; MgSO4, 1 mmol/L; HEPES, 19.7 mmol/L; glucose, 5 mmol/L; pH 7.4) after 96 hours of transfection, when hepatocytes were fully polarized. Coverslips containing the cells were transferred to a custom‐built perfusion chamber on the stage of an LSM 710 Duo confocal microscope (Zeiss, Thornwood, NY). Cytosolic and mitochondrial Ca2+ signals were monitored in R‐GECO/inverse Pericam‐transfected cells during stimulation with 10 µM adenosine triphosphate (ATP) (Sigma‐Aldrich) using a 40× objective lens. Changes in fluorescence were normalized by the initial fluorescence (F0) and were expressed as (F/F0) × 100% as described previously.15
TRANSMISSION ELECTRON MICROSCOPY OF HEPATOCYTES IN SANDWICH CULTURE
Cultured cells on coverslips were fixed in 2% glutaraldehyde, 100 mM Na‐cacodylate buffer (pH 7.4) at room temperature for 1 hour. After rinsing with the same buffer twice, cells were postfixed in 0.5% OsO4 (osmium tetroxide) at room temperature for 30 minutes, followed by 2% aqueous uranyl acetate 30 minutes, dehydrated in a graded series of ethanol up to 100% and finally infiltrated and embedded in Embed812 resin (Electron Microscopy Science, Hatfield, PA). Sample blocks were hardened overnight at 60°C. Thin sections (50‐60 nm) were cut with a Leica ultramicrotome and poststained with uranyl acetate and lead citrate. Sample grids were examined on an electron microscope equipped with a FEI Tecnai field emission gun with an accelerating voltage of 200 kV, digital images were recorded with a FEI 4k × 4k Eagle CCD camera. Sample preparation and imaging were performed at CCMI EM Core Facility, Yale University. The total mitochondrial length and percentage of total mitochondria length that localized within 40 nm of ER membranes were quantified by a blinded observer in 20 photomicrographs of WT and InsP3R1 LSKO hepatocytes.
IN VITRO INDUCTION OF STEATOSIS
Steatosis was induced by incubation of primary WT or InsP3R1 LSKO hepatocytes with complete William's medium E supplemented with bovine serum albumin (BSA)‐conjugated oleic acid at the concentration of 250 μM for 0, 2, 4, 8, or 16 hours. Control cell cultures were incubated with medium supplemented with BSA. After incubation, cells were stained with Bodipy 493/503 (Molecular Probes, Eugene, OR) according to the manufacturer's instructions and were imaged using confocal microscopy with an excitation of 488 nm and an emission collected between 505‐565 nm. Changes in lipid accumulation were quantified using Image J software (National Institutes of Health, Bethesda, MD) and normalized by way of initial Bodipy fluorescence (0 hours).
IN VIVO METABOLIC STATE ANALYSIS
Male littermate mice (age, 10‐12 weeks) were individually housed and given 2 weeks to acclimate to the calorimetric apparatus (TSE Systems, Bad Homburg, Germany). The environment was temperature controlled (23°C) and lighting was restricted to a 12‐hour light/dark cycle with free access to food and water. The comprehensive animal metabolic monitoring system (CLAMS; Columbus Instruments) was used to evaluate physical activity, food consumption, and energy expenditure. Energy expenditure and respiratory exchange ratio were calculated from the gas exchange data [energy expenditure = (3.815 + 1.232 × RER) × VO2], with RER determined as the ratio of VCO2 to VO2. Activity was measured in horizontal and vertical directions using infrared beams to count the beam breaks during a specified period. Feeding was measured by recording the difference in the scale measurement of the center feeder from one time point to another. Drinking was assessed by way of an automated system counting consumed water droplets.
Plasma triglyceride levels were measured using Triglyceride‐SL detection reagent (Sekisui Diagnostics, Lexington, MA). Liver triglycerides were determined using the Triglyceride‐SL detection reagent after tissue homogenization and lipid extraction in chloroform/methanol (2:1), followed by acidification with H2SO4 and phase separation by way of centrifugation.
HYPERINSULINEMIC‐EUGLYCEMIC CLAMP STUDIES
Hyperinsulinemic‐euglycemic (HE) clamp studies were performed as described previously26 and in accordance with recommendations provided by the Mouse Metabolic Phenotyping Consortium.27 These experiments were performed by the Yale Mouse Metabolic Phenotyping Center Analytical Core. Surgical implantation of a right jugular vein catheter was performed 1 week prior to HE clamp studies, allowing mice time to recover. Mice were fasted overnight for 14 hours and in the morning were continuously infused with 0.05 μCi/min 3‐[3H]glucose for 2 hours to assess basal glucose turnover. HE clamping was conducted for 140 minutes with a primed/continuous infusion of human insulin (Novolin; Novo Nordisk, Princeton, NJ) and a variable infusion of 20% dextrose to maintain euglycemia (120 mg/dL).
For the insulin prime, insulin was infused simultaneous to infusion of 3‐[3H]glucose at a rate of 7.14 mU/kg/min for 4 min. Then the insulin infusion rate was dropped to 3 mU/kg/min for the remainder of the experiment. 3‐[3H]glucose was continuously infused at a rate of 0.1 μCi/min to determine insulin stimulated glucose uptake and endogenous glucose production after the basal period. A 10 μCi bolus of [14C]2‐deoxyglucose was injected after 90 minutes to estimate the insulin‐stimulated tissue‐specific glucose uptake. Blood samples were taken at 0 and 135 min for plasma fatty acid and insulin concentrations. At the end of the study, mice were anesthetized with an intravenous injection of 150 mg/kg pentobarbital and tissues were harvested, frozen in liquid nitrogen, and stored at −80°C until later analysis.
Basal and insulin‐stimulated whole body glucose turnover rates were calculated as ([3‐3H]glucose infusion (in dpm)/(plasma glucose specific activity (dpm per mg)) at the end of the basal period and during the final 40 min of the clamp, respectively. Endogenous glucose production = (rate of total glucose appearance) – (glucose infusion rate).
ANALYSIS OF SAMPLES FOR HUMAN STUDIES
Formalin‐fixed, paraffin‐embedded (FFPE) liver biopsy specimens from patients with histologically normal‐appearing liver (n = 5), simple steatosis (n = 5), and NASH (n = 4) were retrieved from the archived specimen bank of the Department of Pathology (Yale‐New Haven Hospital). After deparaffinization and antigen retrieval with citrate buffer pH 6.0, samples were stained overnight with a combination of endoplasmic reticulum (protein disulfide isomerase [PDI]) and mitochondrial (translocase of outer mitochondrial membrane 22 [Tom‐22]) antibodies. Secondary antibodies were Alexa 488 and Alexa 555, respectively. A total of five images per specimen were collected at 40× magnification on a Leica SP8 STED 3× confocal microscope. Mander's colocalization coefficients28 were calculated using the Intensity Correlation Analysis plug‐in of ImageJ software based on five subcellular regions of interest (average area = 7.58 ± 0.14 μm2) blindly selected in each field. Results are expressed as the mean ± standard error of the mean (SEM). All human studies were approved by the Yale Human Investigation Committee.
EXPRESSION ANALYSIS BY REAL‐TIME PCR
Total RNA was extracted from FFPE human biopsies and from frozen livers of WT and InsP3R1 LSKO mice using the RNeasy FFPE kit and RNeasy Mini Kit, respectively (Qiagen, Germantown, MD). After reverse transcription, relative messenger RNA (mRNA) expression of selected genes was quantified with Taqman primers in a ABI 7500 Real‐time PCR system (ThermoFisher, Waltham, MA).
Results
LOSS OF InsP3R1 IN HEPATOCYTES LEADS TO REDUCED LIPID ACCUMULATION IN VITRO AND IN VIVO
Mice expressing Cre recombinase under the control of an albumin promoter were crossed with InsP3R1fl/fl mice in which exon 4 of Itpr1 was flanked by loxP sites as described previously.17 To confirm that the deletion was effective at the protein level, we performed western blot analyses on whole liver homogenate, which revealed that InsP3R1 protein is dramatically reduced in the livers of InsP3R1 liver‐specific knockout (InsP3R1 LSKO) mice (Supporting Fig. S1a). We attribute the residual expression of InsP3R1 in the InsP3R1 LSKO lanes to the use of whole liver homogenate in which other InsP3R1‐expressing cells are present. Western blot analyses of total cell lysates of isolated hepatocytes from InsP3R1 LSKO mice showed complete absence of InsP3R1 (Supporting Fig. S1a). InsP3R1 LSKO mice developed normally and were determined to have normal basal metabolic rates, as demonstrated by measurements of energy expenditure, VO2, VCO2, and physical activity (Supporting Fig. S1b‐h). In order to evaluate the contribution of InsP3R1 to the development of hepatic steatosis, we fed mice a high‐fat diet (HFD) (60% of calories from fat, Research Diets Inc.) that results in obesity and fatty liver.29 The mice were placed on an HFD at 4 weeks of age. After 9 weeks on an HFD, body weights of InsP3R1fl/fl and InsP3R1 LSKO littermates began to diverge and were significantly different at the last time point (Supporting Fig. S1i). The results of body composition measurements demonstrate that after 10 weeks on an HFD, InsP3R1 LSKO were leaner than their InsP3R1fl/fl littermates (Fig. 1A). Liver histology demonstrated that InsP3R1 LSKO mice were also protected from hepatic steatosis, whereas littermate controls have marked steatosis in their livers over the same time period (Fig. 1B). Serum and liver triglycerides were reduced in InsP3R1 LSKO mice as well (Fig. 1C,D). To corroborate the in vivo findings, ex vivo InsP3R1 LSKO hepatocytes from chow‐fed mice were incubated with oleic acid alongside hepatocytes from WT chow‐fed mice. The results revealed reduced lipid droplet accumulation in hepatocytes lacking InsP3R1, as demonstrated by time‐lapse confocal imaging of Bodipy fluorescence (Fig. 1E).
Figure 1.
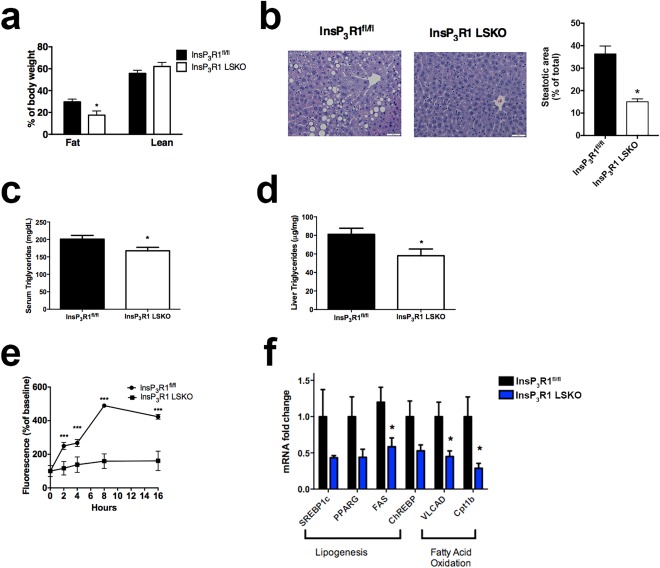
Loss of InsP3R1 in hepatocytes leads to reduced lipid accumulation in vitro and in vivo. (A) Body composition measured by 1H‐magnetic resonance spectroscopy after 8‐9 weeks of HFD feeding (n = 6‐9). (B) Hematoxylin and eosin staining of formalin‐fixed sections of the left liver lobe after 10 weeks of HFD feeding (representative image; n = 6). Scale bars = 50 μm. Quantification of the steatotic area relative to total liver area is shown in the histogram. (C) Serum triglycerides from overnight‐fasted mice (n = 8). (D) Liver triglycerides in overnight‐fasted animals (n = 8). (E) Cellular uptake of 250 μM oleic acid measured at 0, 2, 4, 8, and 16 hours by way of quantification of Bodipy fluorescence, normalized to baseline (n = 40 cells, n = 5 animals). (F) Relative mRNA expression of lipogenic and beta‐oxidation genes in WT and InsP3R1 LSKO livers after 10 weeks of HFD feeding (n = 5). Statistical significance was determined using a Student t test. All error bars represent the SEM. *P < 0.05. ***P < 0.001.
To investigate the mechanism by which InsP3R1 promotes lipid accumulation in hepatocytes, we performed expression analysis by qPCR of key genes involved in lipogenesis and fatty acid oxidation. WT and InsP3R1 LSKO mice were subjected to 10 weeks of HFD feeding, after which the animals were overnight‐fasted (16 hours) and total liver mRNA was isolated. As shown in Figure 1F, the absence of InsP3R1 was associated with decreased expression of lipogenic genes: sterol regulatory element‐binding protein, peroxisome proliferator‐activated receptor γ, and carbohydrate‐responsive element‐binding protein, as well as the enzyme fatty acid synthase, which is consistent with the reduced lipid accumulation in InsP3R1 LSKO livers. However, the expression of two essential beta‐oxidation enzymes, very long‐chain acyl‐coenzyme A dehydrogenase and carnitine palmitoyltransferase IB, was also reduced in livers from InsP3R1 LSKO mice. These results suggest that InsP3R1 exerts complex control of lipid metabolism in hepatocytes that is not limited to regulation of lipid consumption and synthesis.
HEPATOCYTES LACKING InsP3R1 HAVE IMPAIRED MITOCHONDRIAL CALCIUM SIGNALS
To examine the effect of InsP3R1 loss on Ca2+ signaling in the affected cells, primary hepatocytes were isolated from WT, InsP3R1 LSKO, and InsP3R2 whole body KO (InsP3R2 KO) mice and were maintained in collagen sandwich culture to preserve cell polarity as described previously.21, 22 Because mitochondria are essential organelles of lipid metabolism, we used tools to separately measure the cytosolic and mitochondrial Ca2+ signals. Hepatocytes were transfected with a genetically encoded cytosolic Ca2+ indicator, R‐GECO or Pericam, an inverse Ca2+ indicator targeted to the mitochondria, or both.30, 31 When stimulated with extracellular ATP, the amplitudes of cytosolic Ca2+ responses were similar in the WT hepatocytes and those lacking InsP3R1 or InsP3R2 (Fig. 2A). In contrast, the amplitude of the mitochondrial Ca2+ responses were significantly diminished in the cells without InsP3R1 compared with WT hepatocytes, whereas cells lacking InsP3R2 were similar to WT hepatocytes (Fig. 2B). These results distinguish polarized hepatocytes lacking InsP3R1 from those lacking InsP3R2. Extracellular ATP stimulates not only P2Y receptors, which increase Ca2+ via InsP3, but also P2X receptors, which act as plasma membrane Ca2+ channels. Therefore, to confirm the relevance of these findings for InsP3R1 signaling, cells were stimulated with phenylephrine, which increases Ca2+ in hepatocytes only through α1B‐adrenergic receptor‐linked InsP3 formation.32 Hormone‐induced InsP3‐mediated signals in hepatocytes and other polarized epithelia begin in the apical “trigger” zone, where the InsP3R is most concentrated. In hepatocytes, the trigger zone consists only of InsP3R2.15 When these are absent, a Ca2+ signal is only generated in the presence of very high concentrations of agonist or when InsP3 is uncaged, as these conditions can activate the nonapical receptors, which are InsP3R1 in hepatocytes.33 Our studies with phenylephrine confirmed that hepatocytes lacking InsP3R1 have impaired mitochondrial Ca2+ signaling (Fig. 2C). To more directly test the role of each InsP3R isoform in hepatocyte Ca2+ signaling, caged InsP3 was photoreleased while cytoplasmic and mitochondrial Ca2+ signals were monitored by time‐lapse confocal imaging.15 A mitochondrial calcium signal was observed in 83% of the WT cells in which a cytosolic calcium signal was detected (n = 12). A similar percentage of InsP3R2 KO hepatocytes in which there was a cytosolic signal had mitochondrial responses (85% of n = 7 cells; P = 0.56), whereas mitochondrial responses were observed in only 60% of InsP3R1 LSKO hepatocytes in which there was a cytosolic signal (n = 10 cells; P = 0.02). These studies provide supporting evidence that InsP3R1 plays a more direct role than InsP3R2 in generating mitochondrial calcium signals.
Figure 2.
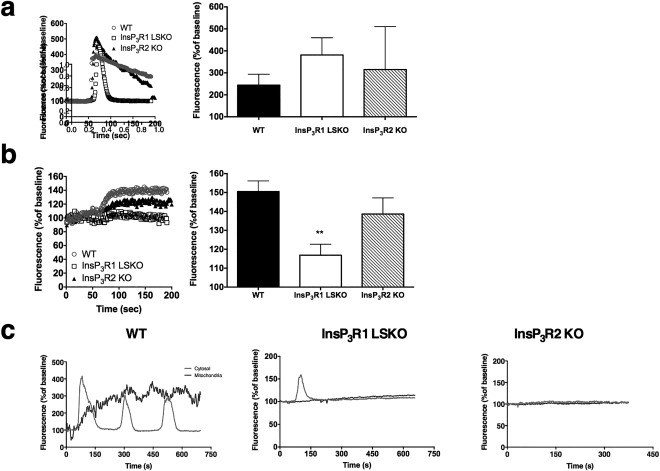
Hepatocytes lacking InsP3R1 have impaired mitochondrial Ca2+ signals. (A,B) Freshly isolated hepatocytes from WT C57/Bl6 mice, InsP3R1 LSKO, and InsP3R2 whole body KO mice were maintained in collagen sandwich cultures and transfected with a genetically encoded cytosolic calcium indicator, R‐GECO (A), and a mitochondrial matrix‐targeted calcium indicator, Inverse PeriCam (B). Cells were stimulated with 10 μM ATP at 50 seconds. Whole cell fluorescence was recorded over time. Representative traces for each group and summarized results from n = 12 cells, n = 2‐4 coverslips per group. Histograms show average amplitude of ATP‐induced Ca2+ signals. (C) Representative traces of cytosolic (light gray) and mitochondrial (dark gray) Ca2+ signals after stimulation with 5 μM phenylephrine (n = 3). Statistical significance was determined using a Student t test. All error bars represent the SEM. **P < 0.01.
ER TO MITOCHONDRIA ASSOCIATION IS PRESERVED IN InsP3R1 LSKO HEPATOCYTES
Because the absence of InsP3Rs might disrupt the association of mitochondria and ER and thus decrease Ca2+ transfer into the mitochondria, we evaluated the association of these organelles by way of electron microscopy. The percentage of total mitochondrial length in proximity to ER membranes (distance ≤40 nm) was similar in WT and InsP3R1 LSKO mice (Fig. 3). In addition, the total mitochondrial perimeter was unchanged in InsP3R1 LSKO hepatocytes when compared with WT cells (WT 8429 ± 4339 nm versus InsP3R1 LSKO 9387 ± 3138 nm). These results show that ER to mitochondria association is not disrupted in the absence of InsP3R1. Moreover, they suggest that the impaired mitochondrial Ca2+ signals in InsP3R1 LSKO hepatocytes are not a result of nonspecific dissociation of ER to mitochondrial contacts.
Figure 3.
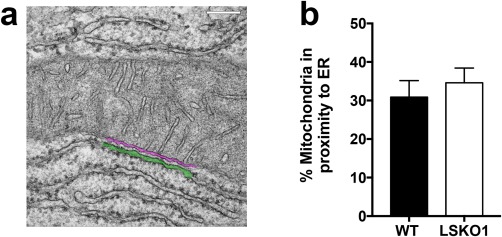
ER–mitochondria association is maintained in InsP3R1 LSKO hepatocytes. (A) Representative EM micrograph of a WT mouse hepatocyte in which regions of close contact between the ER membranes (green) and mitochondria (magenta) are magnified. (B) Quantification of total mitochondrial length located within 40 nm of ER membranes shows no significant difference between WT (30.86 ± 4.31%; n = 20 fields) and InsP3R1 LSKO (34.59 ± 3.82%; n = 20 fields) hepatocytes. P = 0.52.
InsP3R1 LSKO MICE HAVE NORMAL RATES OF GLUCOSE PRODUCTION AND INSULIN SENSITIVITY
We anticipated that protection from lipid accumulation in the liver and reduced whole body adiposity might lead to differences in glucose and insulin homeostasis. In order to evaluate insulin sensitivity directly, we conducted HE clamps on adult mice fed a short‐term HFD of 4 weeks.34 During the clamp, plasma glucose concentrations and glucose infusion rates were equivalent demonstrating that whole animal insulin sensitivity is unchanged in the InsP3R1 LSKO mice (Fig. 4A,B). Importantly, there was no difference in clamped plasma insulin levels between groups (data not shown). These data provide strong evidence to support the notion that loss of hepatic InsP3R1 does not significantly affect insulin sensitivity. In addition, basal and clamped hepatic glucose production and plasma fatty acid levels were unaltered, and clamped glucose uptake was not different either (Fig. 4C‐F).
Figure 4.
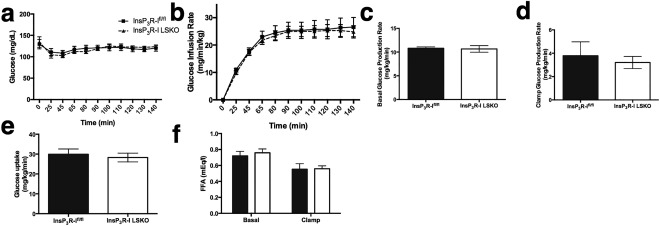
InsP3R1 LSKO mice have normal rates of glucose production and insulin sensitivity after HFD feeding. (A,B) Plasma glucose levels (A) and glucose infusion rates (B) during an HE clamp (n = 10‐12). (C) Basal endogenous glucose production measured under fasting conditions before the start of the clamp (n = 10‐12). (D‐F) Glucose production measured during the clamp (D), glucose uptake (E), and circulating free fatty acids (FFA) (F). Statistical significance was determined using a Student t test. All error bars represent the SEM.
HEPATOCYTES FROM MICE FED AN HFD HAVE ENHANCED MITOCHONDRIAL Ca2+ RESPONSES AND ER/MITOCHONDRIA COLOCALIZATION
Given our observation that InsP3R1 LSKO mice are protected from hepatic steatosis, we analyzed mitochondrial Ca2+ responses to ATP stimulation in hepatocytes taken from mice chronically fed an HFD and their chow‐fed littermates. We observed that HFD‐fed mice had enhanced Ca2+ responses in their mitochondria (Fig. 5A). Because InsP3Rs are known to serve as a conduit for Ca2+ between the ER and mitochondria,35, 36 we examined colocalization between the two organelles using fluorescent markers, represented by the Pearson's coefficient.37 Pearson's coefficient is a calculated value that reflects the degree of linear correlation between two numbers that range from −1 to +1. Hepatocytes from mice fed an HFD had significantly more colocalization between ER and mitochondria when compared with hepatocytes isolated from chow‐fed controls (chow‐fed, 0.55 ± 0.03 versus HFD, 0.66 ± 0.03) (Fig. 5B).
Figure 5.
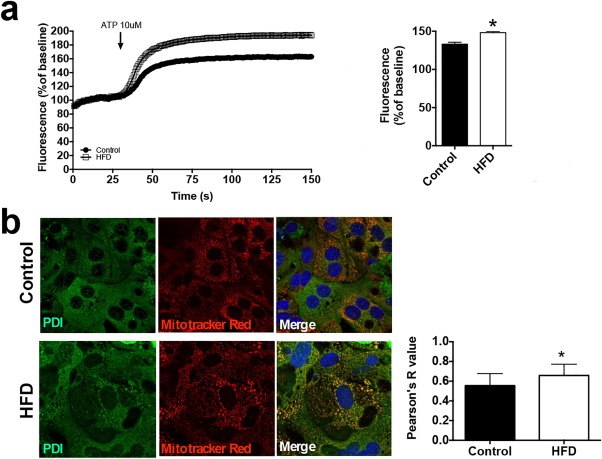
HFD hepatocytes have enhanced mitochondrial Ca2+ signals and increased ER–mitochondrial colocalization. (A) ATP‐induced mitochondrial Ca2+ signals were measured in hepatocytes isolated from mice chronically fed an HFD for 6 months and their chow control littermates (n = 10 cells from three mice). The histogram shows the peak amplitude of mitochondrial Ca2+ signals at 150 seconds. (B) Labeling of ER (PDI, green) and mitochondria (Mitotracker Red, red) indicates an increase in the interaction of both organelles in HFD hepatocytes; colocalization test of immunostaining images (n = 3). Statistical significance was determined using a Student t test. All error bars represent the SEM. *P < 0.05.
ER–MITOCHONDRIAL COLOCALIZATION IS INCREASED IN HUMAN FATTY LIVER
To explore the clinical relevance of transmission of calcium signals from ER to mitochondria, we measured the fraction of mitochondria that colocalized with ER in patients with fatty liver disease. First, liver biopsies from patients with histologically normal livers, simple steatosis, and NASH were stained with hematoxylin and eosin. The histology images demonstrate increased lipid content in steatosis and NASH as well as hepatocyte ballooning, inflammation, and fibrosis in the NASH samples (Fig. 6A). Colocalization of the ER marker PDI and the mitochondrial marker Tom‐22 was increased in hepatocytes in liver biopsy specimens from patients with both simple steatosis and NASH when compared with normal livers. Furthermore, colocalization, represented by Mander's coefficient,37 was increased in NASH specimens compared with specimens with simple steatosis, suggesting a correlation with severity of disease. Mander's coefficient is a calculated value that reflects the degree of linear correlation between two numbers that range from −1 to +1 and is independent of the absolute magnitude of each variable (Fig. 6B,C). Similar results were obtained by Pearson's coefficient. Moreover, InsP3R1 mRNA was increased in NASH biopsy specimens when compared with control liver biopsies (Fig. 6D). These results suggest that there is increased association between ER and mitochondria in human fatty liver disease. It is important to note that the association increases with worsening disease severity and is associated with elevated expression of InsP3R1 in NASH.
Figure 6.
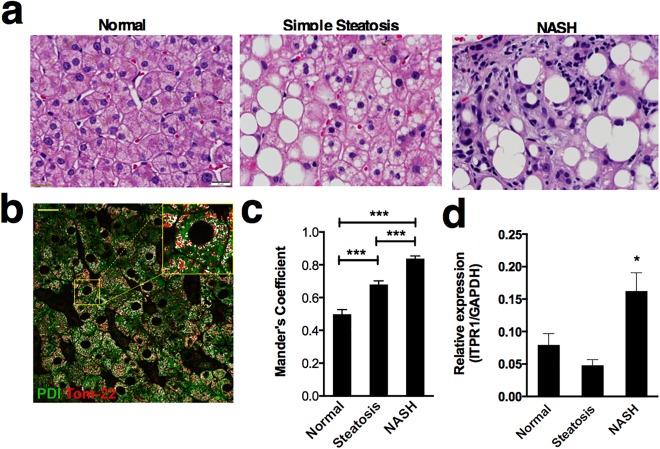
Increased association of ER and mitochondria in human fatty liver disease. (A) Representative images of hematoxylin and eosin staining of a normal, simple steatosis, and NASH human liver biopsy. Regions of lipid accumulation (negative image) are present in both simple steatosis and NASH. In addition to steatosis, NASH specimens also display inflammatory infiltrate and fibrosis. Scale bar = 20 μm. (B) Representative image of a histologically normal human liver biopsy specimen stained with markers for an ER protein (PDI, green) and a mitochondrial protein (Tom‐22, red). Colocalized pixels are highlighted in white. The inset shows a magnified area within the field. Scale bar = 20 μm. (C) Mander's colocalization coefficients of mitochondria to ER shows that the fraction of mitochondria associated with ER is increased in both simple steatosis (n = 5 patients) and NASH (n = 4) in comparison with normal liver (n = 5) and that the coefficient for biopsies from NASH patients is significantly greater than that for patients with simple steatosis. Coefficient values are based on 25 separate determinations in each biopsy specimen. (D) InsP3R1 mRNA expression in human liver specimens is significantly increased in NASH patients compared with control and simple steatosis (n = 6 biopsies per condition). Statistical significance was determined by way of analysis of variance (C) or by using a Student t test (D). All error bars represent the SEM. *P < 0.05. ***P < 0.001.
Discussion
Remarkably, Ca2+, a single ion, is able to control a multitude of cellular processes ranging from cell proliferation,38 contraction,39 and apoptosis40 to gene transcription41 and exocytosis.42 Differing temporal properties and subcellular localization are two ways in which Ca2+ is able to regulate many processes simultaneously with precision.43, 44, 45 Previous studies have demonstrated the importance of subcellular localization of Ca2+ signals, specifically in hepatocytes, as a high concentration of InsP3R2 channels under the canalicular membrane support insertion into the canalicular membrane of transporters that are important for bile secretion.21, 22 Nuclear InsP3R‐mediated Ca2+ signals are distinct from cytosolic signals and are important for cell proliferation and liver regeneration.44, 46 Likewise, mitochondrial Ca2+ is a key component of cellular metabolism,47 including in hepatocytes,48 and regulates apoptosis in the liver as well.49 Our previous observations with a whole body InsP3R2 KO mouse23 led us to investigate the specific role of hepatic InsP3R1. Here, we show InsP3R1 has a distinct role from InsP3R2 in hepatocytes. This not only serves as another example of the specificity of intracellular Ca2+ as a messenger, it also shows that subcellular localization of InsP3R isoforms may be a critical component of the pathophysiology underlying the development of human fatty liver disease.
Fatty liver frequently occurs concomitantly with obesity and diabetes, but it can also occur independently.50 In fact, despite recent reports implicating InsP3R1‐mediated Ca2+ signals in hepatic glucose production and insulin sensitivity,17, 18 we found that hepatic InsP3R1 was not necessary for these processes in mouse models after short‐term HFD feeding, and that protection from hepatic steatosis was disconnected from glucose and insulin signaling phenotypes under the conditions of the experiments reported here. Polymorphisms in APOC3,51 PNPLA3,52 and TM6SF253 each have been identified as risk factors for fatty liver disease. Our understanding of how each of these genes affects steatosis is evolving, but a common final pathway may relate to increased ER stress.54, 55 Dysfunctional ER Ca2+ handling has emerged as a possible explanation for the link between lipid overload and the ER stress response.7 Three independent groups have suggested that the cause is down‐regulation of SERCA, the Ca2+‐ATPase on the ER membrane that pumps Ca2+ from the cytosol into the ER.7, 10, 56 However, hepatic mitochondrial dysfunction driven by Ca2+ overload also contributes to the development of hepatic steatosis.10, 11 Ca2+ uptake into the mitochondria is largely derived from the ER36; therefore, it is not surprising that increased contact between the ER and mitochondria also has been implicated in the pathogenesis of hepatic steatosis.19 InsP3R1 was one of the proteins shown to be up‐regulated and enriched in the mitochondrial associated membranes of animal models of obesity.19 Reducing InsP3R1 expression in animal models corrects the mitochondrial dysfunction associated with HFDs,19 a finding that is consistent with our genetic liver‐specific model of InsP3R1 deficiency, which was protected from the accumulation of lipid in the liver upon high‐fat feeding. Here, we link these basic concepts to human disease by showing that patients with fatty liver have increased hepatic InsP3R1expression and that patients with simple steatosis and NASH have enhanced ER–mitochondrial colocalization relative to histologically normal liver. Furthermore, the degree of ER–mitochondrial colocalization correlated with severity of disease. Thus, we provide evidence from patients that corroborates work in current and previous animal models to support the role of hepatic InsP3R1 in the development of NAFLD. Future work may determine the extent to which aberrant InsP3R1 signaling is responsible for fatty liver disease in patients and explore its potential as a therapeutic target.
Supporting information
Additional Supporting Information may be found at onlinelibrary.wiley.com/doi/10.1002/hep4.1012/suppinfo.
Supporting Information
Supporting Figure S1. (a) Immunoblot of whole liver homogenate, n=3. (b) InsP3R1 LSKO and InsP3R1fl/fl littermates were studied in metabolic cages for a 24 hr period. Each graph represents the average of n=6 InsP3R1fl/fl and n=10 InsP3R1 LSKO mice. (b‐c) Food consumption was measured in the dark (active) and light (inactive) cycle. Respiratory exchange ratio (RER), rates of O2 consumption and CO2 production are equivalent (e‐g). Physical activity, measured by an infrared beam, reflects the sleep and wake cycles of the mice (h). Mice placed on HFD at 4 weeks of age were weighed every week for 9 consecutive weeks alongside littermates few a regular chow diet (i).
Acknowledgment
We thank Kathy Harry and Emma Kruglov for technical assistance. We thank Robert Campbell (University of Alberta) for the cytosolic red fluorescent protein‐tagged genetically encoded Ca2+ indicator for optical imaging R‐GECO (Addgene plasmid # 32444), Gyorgy Hajnoczky (Thomas Jefferson University) for the mitochondrial matrix‐targeted Ca2+ indicator inverse Pericam, and Andrew Marks (Columbia University) and Ju Chen (University of California, San Diego) for the genetically modified mice.
Potential conflict of interest: Nothing to report.
This study was funded by National Institutes of Health grants DK034989 (to the Yale Liver Center), DK057751, DK090744, DK45710, DK61747, DK40936, DK059635, DK45735, and CT DPH2014‐0139.
REFERENCES
- 1. Younossi ZM, Koenig AB, Abdelatif D, Fazel Y, Henry L, Wymer M. Global epidemiology of non‐alcoholic fatty liver disease‐meta‐analytic assessment of prevalence, incidence and outcomes. Hepatology 2016;64:73–84. [DOI] [PubMed] [Google Scholar]
- 2. Jemal A, Bray F, Center MM, Ferlay J, Ward E, Forman D. Global cancer statistics. CA Cancer J Clin 2011;61:69–90. [DOI] [PubMed] [Google Scholar]
- 3. Goh GB, Pagadala MR, Dasarathy J, Unalp‐Arida A, Sargent R, Hawkins C, et al. Clinical spectrum of non‐alcoholic fatty liver disease in diabetic and non‐diabetic patients. BBA Clin 2015;3:141–145. [DOI] [PMC free article] [PubMed] [Google Scholar]
- 4. Stranges S, Trevisan M, Dorn JM, Dmochowski J, Donahue RP. Body fat distribution, liver enzymes, and risk of hypertension: evidence from the Western New York Study. Hypertension 2005;46:1186–1193. [DOI] [PMC free article] [PubMed] [Google Scholar]
- 5. Volzke H, Robinson DM, Kleine V, Deutscher R, Hoffmann W, Ludemann J, et al. Hepatic steatosis is associated with an increased risk of carotid atherosclerosis. World J Gastroenterol 2005;11:1848–1853. [DOI] [PMC free article] [PubMed] [Google Scholar]
- 6. Park SW, Zhou Y, Lee J, Lee J, Ozcan U. Sarco(endo)plasmic reticulum Ca2+‐ATPase 2b is a major regulator of endoplasmic reticulum stress and glucose homeostasis in obesity. Proc Natl Acad Sci U S A 2010;107:19320–19325. [DOI] [PMC free article] [PubMed] [Google Scholar]
- 7. Fu S, Yang L, Li P, Hofmann O, Dicker L, Hide W, et al. Aberrant lipid metabolism disrupts calcium homeostasis causing liver endoplasmic reticulum stress in obesity. Nature 2011;473:528–531. [DOI] [PMC free article] [PubMed] [Google Scholar]
- 8. Wilson CH, Ali ES, Scrimgeour N, Martin AM, Hua J, Tallis GA, et al. Steatosis inhibits liver cell store‐operated Ca(2)(+) entry and reduces ER Ca(2)(+) through a protein kinase C‐dependent mechanism. Biochem J 2015;466:379–390. [DOI] [PubMed] [Google Scholar]
- 9. Satapati S, Kucejova B, Duarte JA, Fletcher JA, Reynolds L, Sunny NE, et al. Mitochondrial metabolism mediates oxidative stress and inflammation in fatty liver. J Clin Invest 2015;125:4447–4462. [DOI] [PMC free article] [PubMed] [Google Scholar]
- 10. Egnatchik RA, Leamy AK, Jacobson DA, Shiota M, Young JD. ER calcium release promotes mitochondrial dysfunction and hepatic cell lipotoxicity in response to palmitate overload. Mol Metab 2014;3:544–553. [DOI] [PMC free article] [PubMed] [Google Scholar]
- 11. Lee SJ, Zhang J, Choi AM, Kim HP. Mitochondrial dysfunction induces formation of lipid droplets as a generalized response to stress. Oxid Med Cell Longev 2013;2013:327167. [DOI] [PMC free article] [PubMed] [Google Scholar]
- 12. Kraus‐Friedmann N, Feng L. The role of intracellular Ca2+ in the regulation of gluconeogenesis. Metabolism 1996;45:389–403. [DOI] [PubMed] [Google Scholar]
- 13. Assimacopoulos‐Jeannet FD, Blackmore PF, Exton JH. Studies on alpha‐adrenergic activation of hepatic glucose output. Studies on role of calcium in alpha‐adrenergic activation of phosphorylase. J Biol Chem 1977;252:2662–2669. [PubMed] [Google Scholar]
- 14. Amaya MJ, Nathanson MH. Calcium signaling in the liver. Compr Physiol 2013;3:515–539. [DOI] [PMC free article] [PubMed] [Google Scholar]
- 15. Hirata K, Pusl T, O'Neill AF, Dranoff JA, Nathanson MH. The type II inositol 1,4,5‐trisphosphate receptor can trigger Ca2+ waves in rat hepatocytes. Gastroenterology 2002;122:1088–1100. [DOI] [PubMed] [Google Scholar]
- 16. Wojcikiewicz RJ. Type I, II, and III inositol 1,4,5‐trisphosphate receptors are unequally susceptible to down‐regulation and are expressed in markedly different proportions in different cell types. J Biol Chem 1995;270:11678–11683. [DOI] [PubMed] [Google Scholar]
- 17. Ozcan L, Wong CC, Li G, Xu T, Pajvani U, Park SK, et al. Calcium signaling through CaMKII regulates hepatic glucose production in fasting and obesity. Cell Metab 2012;15:739–751. [DOI] [PMC free article] [PubMed] [Google Scholar]
- 18. Wang Y, Li G, Goode J, Paz JC, Ouyang K, Screaton R, et al. Inositol‐1,4,5‐trisphosphate receptor regulates hepatic gluconeogenesis in fasting and diabetes. Nature 2012;485:128–132. [DOI] [PMC free article] [PubMed] [Google Scholar]
- 19. Arruda AP, Pers BM, Parlakgul G, Guney E, Inouye K, Hotamisligil GS. Chronic enrichment of hepatic endoplasmic reticulum‐mitochondria contact leads to mitochondrial dysfunction in obesity. Nat Med 2014;20:1427–1435. [DOI] [PMC free article] [PubMed] [Google Scholar]
- 20. Arruda AP, Hotamisligil GS. Calcium homeostasis and organelle function in the pathogenesis of obesity and diabetes. Cell Metab 2015;22:381–397. [DOI] [PMC free article] [PubMed] [Google Scholar]
- 21. Kruglov EA, Gautam S, Guerra MT, Nathanson MH. Type 2 inositol 1,4,5‐trisphosphate receptor modulates bile salt export pump activity in rat hepatocytes. Hepatology 2011;54:1790–1799. [DOI] [PMC free article] [PubMed] [Google Scholar]
- 22. Cruz LN, Guerra MT, Kruglov E, Mennone A, Garcia CR, Chen J, et al. Regulation of multidrug resistance‐associated protein 2 by calcium signaling in mouse liver. Hepatology 2010;52:327–337. [DOI] [PMC free article] [PubMed] [Google Scholar]
- 23. Feriod CN, Nguyen L, Jurczak MJ, Kruglov EA, Nathanson MH, Shulman GI, et al. Inositol 1,4,5‐trisphosphate receptor type II (InsP3R‐II) is reduced in obese mice, but metabolic homeostasis is preserved in mice lacking InsP3R‐II. Am J Physiol Endocrinol Metab 2014;307:E1057–E1064. [DOI] [PMC free article] [PubMed] [Google Scholar]
- 24. Matsumoto M, Nakagawa T, Inoue T, Nagata E, Tanaka K, Takano H, et al. Ataxia and epileptic seizures in mice lacking type 1 inositol 1,4,5‐trisphosphate receptor. Nature 1996;379:168–171. [DOI] [PubMed] [Google Scholar]
- 25. Zhao Y, Araki S, Wu J, Teramoto T, Chang YF, Nakano M, et al. An expanded palette of genetically encoded Ca(2)(+) indicators. Science 2011;333:1888–1891. [DOI] [PMC free article] [PubMed] [Google Scholar]
- 26. Jurczak MJ, Lee AH, Jornayvaz FR, Lee HY, Birkenfeld AL, Guigni BA, et al. Dissociation of inositol‐requiring enzyme (IRE1alpha)‐mediated c‐Jun N‐terminal kinase activation from hepatic insulin resistance in conditional X‐box‐binding protein‐1 (XBP1) knock‐out mice. J Biol Chem 2012;287:2558–2567. [DOI] [PMC free article] [PubMed] [Google Scholar]
- 27. Ayala JE, Samuel VT, Morton GJ, Obici S, Croniger CM, Shulman GI, et al. Standard operating procedures for describing and performing metabolic tests of glucose homeostasis in mice. Dis Model Mech 2010;3:525–534. [DOI] [PMC free article] [PubMed] [Google Scholar]
- 28. Dunn KW, Kamocka MM, McDonald JH. A practical guide to evaluating colocalization in biological microscopy. Am J Physiol Cell Physiol 2011;300:C723–C742. [DOI] [PMC free article] [PubMed] [Google Scholar]
- 29. Fraulob JC, Ogg‐Diamantino R, Fernandes‐Santos C, Aguila MB, Mandarim‐de‐Lacerda CA. A mouse model of metabolic syndrome: insulin resistance, fatty liver and non‐alcoholic fatty pancreas disease (NAFPD) in C57BL/6 mice fed a high fat diet. J Clin Biochem Nutr 2010;46:212–223. [DOI] [PMC free article] [PubMed] [Google Scholar]
- 30. Amaya MJ, Oliveira AG, Schroeder LK, Allgeyer ES, Bewersdorf J, Nathanson MH. Apical localization of inositol 1,4,5‐trisphosphate receptors is independent of extended synaptotagmins in hepatocytes. PLoS One 2014;9:e114043. [DOI] [PMC free article] [PubMed] [Google Scholar]
- 31. Frieden M, James D, Castelbou C, Danckaert A, Martinou JC, Demaurex N. Ca(2+) homeostasis during mitochondrial fragmentation and perinuclear clustering induced by hFis1. J Biol Chem 2004;279:22704–22714. [DOI] [PubMed] [Google Scholar]
- 32. Rooney TA, Sass EJ, Thomas AP. Characterization of cytosolic calcium oscillations induced by phenylephrine and vasopressin in single Fura‐2 loaded hepatocytes. J Biol Chem 1989;264:17131–17141. [PubMed] [Google Scholar]
- 33. Hernandez E, Leite MF, Guerra MT, Kruglov EA, Bruna‐Romero O, Rodrigues MA, et al. The spatial distribution of inositol 1,4,5‐trisphosphate receptor isoforms shapes Ca2+ waves. J Biol Chem 2007;282:10057–10067. [DOI] [PMC free article] [PubMed] [Google Scholar]
- 34. Turner N, Kowalski GM, Leslie SJ, Risis S, Yang C, Lee‐Young RS, et al. Distinct patterns of tissue‐specific lipid accumulation during the induction of insulin resistance in mice by high‐fat feeding. Diabetologia 2013;56:1638–1648. [DOI] [PubMed] [Google Scholar]
- 35. Rizzuto R, Pinton P, Carrington W, Fay FS, Fogarty KE, Lifshitz LM, et al. Close contacts with the endoplasmic reticulum as determinants of mitochondrial Ca2+ responses. Science 1998;280:1763–1766. [DOI] [PubMed] [Google Scholar]
- 36. Szabadkai G, Simoni AM, Rizzuto R. Mitochondrial Ca2+ uptake requires sustained Ca2+ release from the endoplasmic reticulum. J Biol Chem 2003;278:15153–15161. [DOI] [PubMed] [Google Scholar]
- 37. Adler J, Parmryd I. Quantifying colocalization by correlation: the Pearson correlation coefficient is superior to the Mander's overlap coefficient. Cytometry A 2010;77:733–742. [DOI] [PubMed] [Google Scholar]
- 38. Rodrigues MA, Gomes DA, Leite MF, Grant W, Zhang L, Lam W, et al. Nucleoplasmic calcium is required for cell proliferation. J Biol Chem 2007;282:17061–17068. [DOI] [PMC free article] [PubMed] [Google Scholar]
- 39. Lipp P, Laine M, Tovey SC, Burrell KM, Berridge MJ, Li W, et al. Functional InsP3 receptors that may modulate excitation‐contraction coupling in the heart. Curr Biol 2000;10:939–942. [DOI] [PubMed] [Google Scholar]
- 40. Pinton P, Giorgi C, Siviero R, Zecchini E, Rizzuto R. Calcium and apoptosis: ER‐mitochondria Ca2+ transfer in the control of apoptosis. Oncogene 2008;27:6407–6418. [DOI] [PMC free article] [PubMed] [Google Scholar]
- 41. Dolmetsch RE, Xu K, Lewis RS. Calcium oscillations increase the efficiency and specificity of gene expression. Nature 1998;392:933–936. [DOI] [PubMed] [Google Scholar]
- 42. Wadel K, Neher E, Sakaba T. The coupling between synaptic vesicles and Ca2+ channels determines fast neurotransmitter release. Neuron 2007;53:563–575. [DOI] [PubMed] [Google Scholar]
- 43. Miyakawa T, Maeda A, Yamazawa T, Hirose K, Kurosaki T, Iino M. Encoding of Ca2+ signals by differential expression of IP3 receptor subtypes. EMBO J 1999;18:1303–1308. [DOI] [PMC free article] [PubMed] [Google Scholar]
- 44. Leite MF, Thrower EC, Echevarria W, Koulen P, Hirata K, Bennett AM, et al. Nuclear and cytosolic calcium are regulated independently. Proc Natl Acad Sci U S A 2003;100:2975–2980. [DOI] [PMC free article] [PubMed] [Google Scholar]
- 45. Uhlen P, Burch PM, Zito CI, Estrada M, Ehrlich BE, Bennett AM. Gain‐of‐function/Noonan syndrome SHP‐2/Ptpn11 mutants enhance calcium oscillations and impair NFAT signaling. Proc Natl Acad Sci U S A 2006;103:2160–2165. [DOI] [PMC free article] [PubMed] [Google Scholar]
- 46. Amaya MJ, Oliveira AG, Guimaraes ES, Casteluber MC, Carvalho SM, Andrade LM, et al. The insulin receptor translocates to the nucleus to regulate cell proliferation in liver. Hepatology 2014;59:274–283. [DOI] [PMC free article] [PubMed] [Google Scholar]
- 47. Jouaville LS, Pinton P, Bastianutto C, Rutter GA, Rizzuto R. Regulation of mitochondrial ATP synthesis by calcium: evidence for a long‐term metabolic priming. Proc Natl Acad Sci U S A 1999;96:13807–13812. [DOI] [PMC free article] [PubMed] [Google Scholar]
- 48. Hajnoczky G, Robb‐Gaspers LD, Seitz MB, Thomas AP. Decoding of cytosolic calcium oscillations in the mitochondria. Cell 1995;82:415–424. [DOI] [PubMed] [Google Scholar]
- 49. Guerra MT, Fonseca EA, Melo FM, Andrade VA, Aguiar CJ, Andrade LM, et al. Mitochondrial calcium regulates rat liver regeneration through the modulation of apoptosis. Hepatology 2011;54:296–306. [DOI] [PMC free article] [PubMed] [Google Scholar]
- 50. Shulman GI. Ectopic fat in insulin resistance, dyslipidemia, and cardiometabolic disease. N Engl J Med 2014;371:1131–1141. [DOI] [PubMed] [Google Scholar]
- 51. Petersen KF, Dufour S, Hariri A, Nelson‐Williams C, Foo JN, Zhang XM, et al. Apolipoprotein C3 gene variants in nonalcoholic fatty liver disease. N Engl J Med 2010;362:1082–1089. [DOI] [PMC free article] [PubMed] [Google Scholar]
- 52. Romeo S, Kozlitina J, Xing C, Pertsemlidis A, Cox D, Pennacchio LA, et al. Genetic variation in PNPLA3 confers susceptibility to nonalcoholic fatty liver disease. Nat Genet 2008;40:1461–1465. [DOI] [PMC free article] [PubMed] [Google Scholar]
- 53. Kozlitina J, Smagris E, Stender S, Nordestgaard BG, Zhou HH, Tybjaerg‐Hansen A, et al. Exome‐wide association study identifies a TM6SF2 variant that confers susceptibility to nonalcoholic fatty liver disease. Nat Genet 2014;46:352–356. [DOI] [PMC free article] [PubMed] [Google Scholar]
- 54. Pagliassotti MJ. Endoplasmic reticulum stress in nonalcoholic fatty liver disease. Annu Rev Nutr 2012;32:17–33. [DOI] [PubMed] [Google Scholar]
- 55. Ozcan U, Cao Q, Yilmaz E, Lee AH, Iwakoshi NN, Ozdelen E, et al. Endoplasmic reticulum stress links obesity, insulin action, and type 2 diabetes. Science 2004;306:457–461. [DOI] [PubMed] [Google Scholar]
- 56. Zhang J, Li Y, Jiang S, Yu H, An W. Enhanced endoplasmic reticulum SERCA activity by overexpression of hepatic stimulator substance gene prevents hepatic cells from ER stress‐induced apoptosis. Am J Physiol Cell Physiol 2014;306:C279–C290. [DOI] [PubMed] [Google Scholar]
Associated Data
This section collects any data citations, data availability statements, or supplementary materials included in this article.
Supplementary Materials
Additional Supporting Information may be found at onlinelibrary.wiley.com/doi/10.1002/hep4.1012/suppinfo.
Supporting Information
Supporting Figure S1. (a) Immunoblot of whole liver homogenate, n=3. (b) InsP3R1 LSKO and InsP3R1fl/fl littermates were studied in metabolic cages for a 24 hr period. Each graph represents the average of n=6 InsP3R1fl/fl and n=10 InsP3R1 LSKO mice. (b‐c) Food consumption was measured in the dark (active) and light (inactive) cycle. Respiratory exchange ratio (RER), rates of O2 consumption and CO2 production are equivalent (e‐g). Physical activity, measured by an infrared beam, reflects the sleep and wake cycles of the mice (h). Mice placed on HFD at 4 weeks of age were weighed every week for 9 consecutive weeks alongside littermates few a regular chow diet (i).