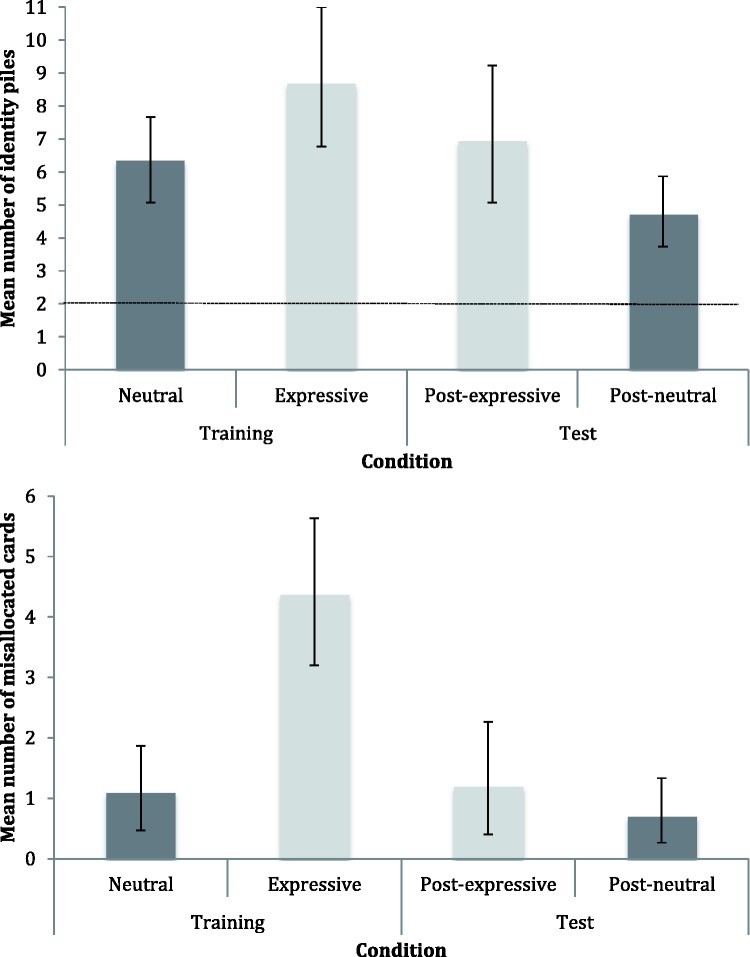
Figure 5.
Results for Experiment 2. Upper panel: Mean number of identity piles per participant, by condition. Dotted line indicates veridical number of identity piles.
Lower panel: Mean number of misallocated cards per participant, by condition. Shading indicates data from the two different participant groups, and error bars denote 95% confidence intervals.

